[VD08] Drinking water quality 

Key message

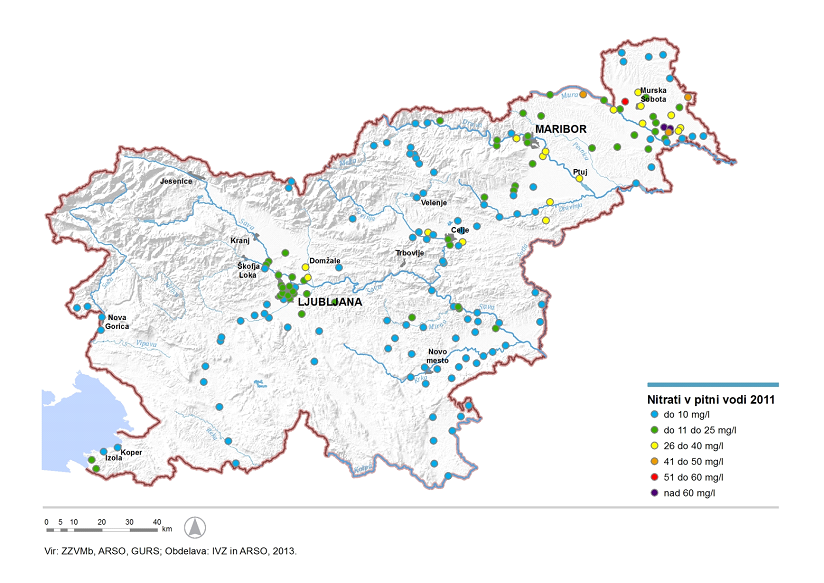
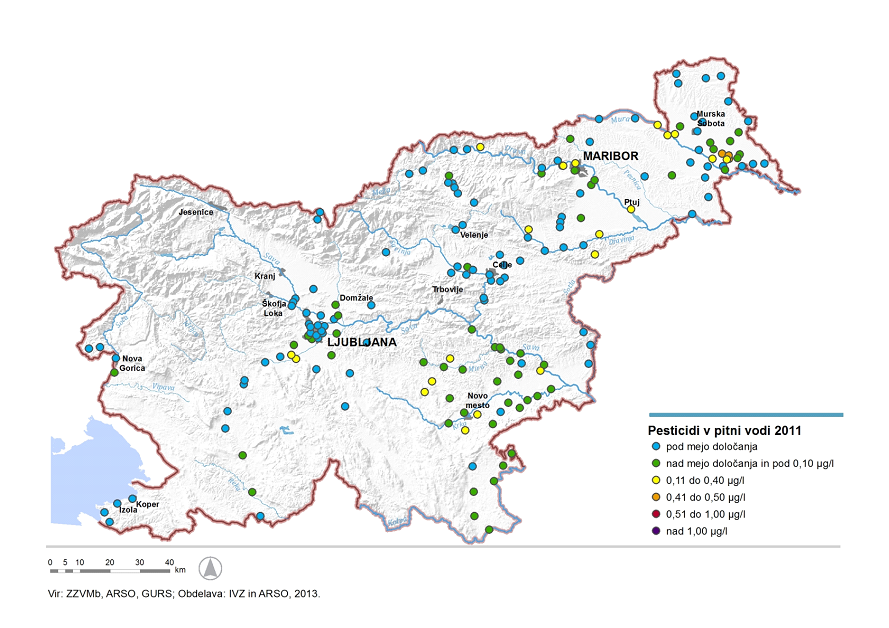
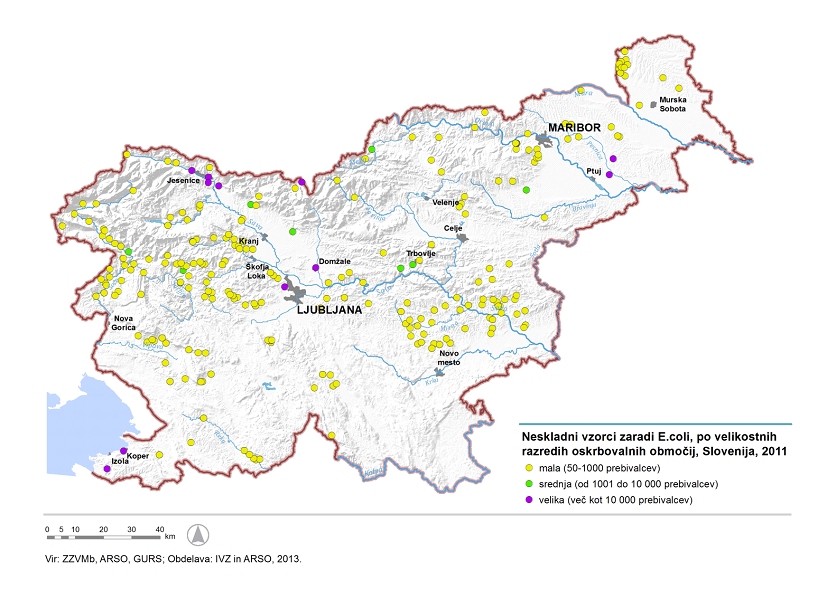
Bigger supply areas generally have adequate drinking water quality. From preventive health point of view, the most problematic are small supply areas, serving 50-1000 inhabitants, mainly due to faecal contamination. The results of chemical tests indicate contamination of drinking water with pesticides and nitrates, particularly in the northeast and southeast Slovenia. The problem are also supply areas which are supplied with surface water, among which in terms of risks to health are included in karst sources of drinking water, as they have occasionally faecal contamination.
Charts
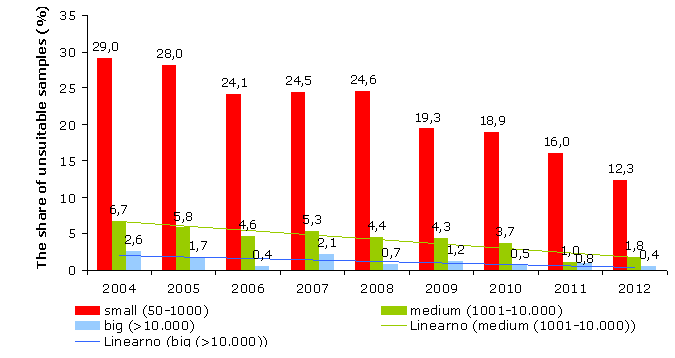
Institute of Public Health of the Republic of Sloveni,2005-2008;ZZV MB, 2009-2013.
| 2004 | 2005 | 2006 | 2007 | 2008 | 2009 | 2010 | 2011 | 2012 | ||
|---|---|---|---|---|---|---|---|---|---|---|
| small (50-1000) | % | 29 | 28 | 24 | 25 | 25 | 19 | 19 | 16 | 12 |
| medium (1001-10.000) | % | 7 | 6 | 5 | 5 | 4 | 4 | 4 | 1 | 2 |
| big (>10.000) | % | 3 | 2 | 0 | 2 | 1 | 1 | 1 | 1 | 0 |
| TOTAL | % | 19 | 18 | 10 | 11 | 10 | 8 | 9 | 8 | 7 |
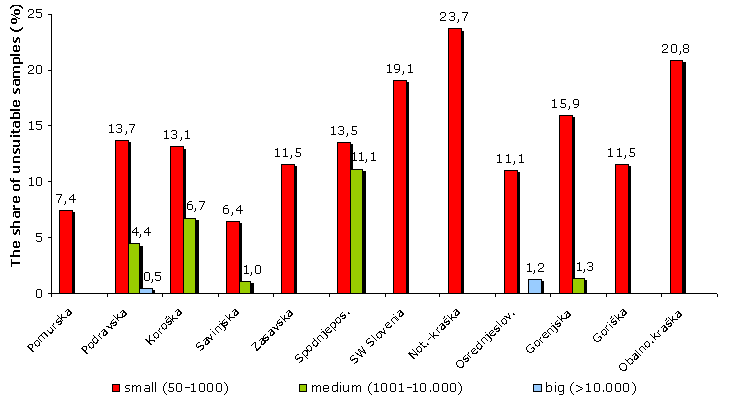
Institute of Public Health of the Republic of Slovenia, 2005 - 2008; ZZV MB, 2009-2013
| Slovenia | Pomurska | Podravska | Koroška | Savinjska | Zasavska | Spodnjepos. | SW Slovenia | Not.-kraška | Osrednjeslov. | ||
|---|---|---|---|---|---|---|---|---|---|---|---|
| small (50-1000) | nmb. | 12.3 | 7.4 | 13.7 | 13.1 | 6.4 | 11.5 | 13.5 | 19.1 | 23.7 | 11.1 |
| medium (1001-10.000) | % | 1.8 | 4.4 | 6.7 | 1 | 11.1 | |||||
| big (>10.000) | nmb. | 0.4 | 0.5 | 1.2 | |||||||
| TOTAL | nmb. | 6.7 | 4 | 4.7 | 11 | 3.5 | 5.9 | 12.1 | 9.8 | 10.6 | 4.5 |
| Gorenjska | Goriška | Obalno.kraška | |||||||||
| small (50-1000) | nmb. | 15.9 | 11.5 | 20.8 | |||||||
| medium (1001-10.000) | % | 1.3 | |||||||||
| big (>10.000) | nmb. | ||||||||||
| TOTAL | nmb. | 7.9 | 8.5 | 5.1 |
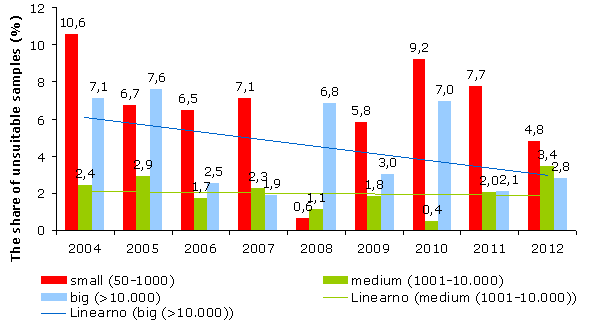
Institute of Public Health of the Republic of Slovenia,2005 - 2008; ZZV MB, 2009-2013.
| 2004 | 2005 | 2006 | 2007 | 2008 | 2009 | 2010 | 2011 | 2012 | ||
|---|---|---|---|---|---|---|---|---|---|---|
| small (50-1000) | % | 10.6 | 6.7 | 6.5 | 7.1 | 0.6 | 5.8 | 9.2 | 7.7 | 4.8 |
| medium (1001-10.000) | % | 2.4 | 2.9 | 1.7 | 2.3 | 1.1 | 1.8 | 0.4 | 2 | 3.4 |
| big (>10.000) | % | 7.1 | 7.6 | 2.5 | 1.9 | 6.8 | 3 | 7 | 2.1 | 2.8 |
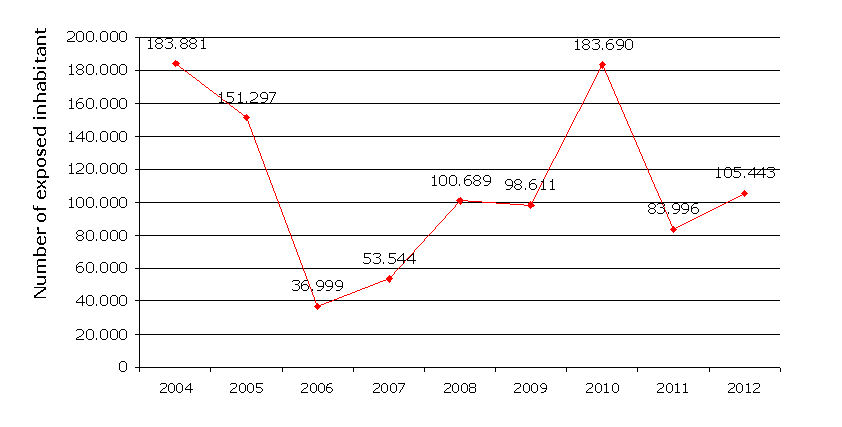
Institute of Public Health, 2005 - 2008; ZZV MB, 2009-2013.
| 2004 | 2005 | 2006 | 2007 | 2008 | 2009 | 2010 | 2011 | 2012 | ||
|---|---|---|---|---|---|---|---|---|---|---|
| Atrazin | µg/l | 0.2 | 0.2 | 0.2 | 0.3 | 0.2 | 0.2 | 0.2 | 0.2 | 0.2 |
| Bentazon | µg/l | - | 1 | 1.4 | 0.5 | 0.4 | 0.4 | 0.1 | 0.1 | |
| Bromacil | µg/l | - | - | - | - | - | - | 0.2 | ||
| Desetil-atrazin | µg/l | 0.3 | 0.3 | 0.4 | 0.3 | 0.3 | 0.3 | 0.4 | 0.4 | 0.2 |
| Dikamba | µg/l | - | - | - | - | - | 0.2 | - | ||
| Dimetenamid | µg/l | 0.3 | - | - | - | - | - | - | ||
| Klortoluron | µg/l | - | - | - | - | - | - | 0.1 | ||
| Mekoprop | µg/l | - | 0.2 | - | - | - | - | - | ||
| Metolaklor | µg/l | - | 0.6 | - | - | 0.1 | 0.7 | - | 0.1 | 0.2 |
| Mezotrion | µg/l | - | - | - | - | 0.1 | - | - | ||
| Permetrin | µg/l | - | - | - | 0.2 | - | - | - | ||
| Terbutilazin | µg/l | - | 0.5 | - | - | - | - | - | 0.2 | |
| Metazaklor | µg/l | - | - | - | - | - | - | - | 0.1 | |
| Pesticidi-vsota | µg/l | - | 0.9 | 1.4 | 0.6 | 0.7 | 0.7 | 0.6 | - | |
| Number of exposed inhabitants | No. | 183881 | 151297 | 36999 | 53544 | 100689 | 98611 | 183690 | 83996 | 105443 |
Institute of Public Health of the Republic of Slovenia, 2005 - 2008; ZZV MB, 2009-2013.
| 2004 | 2005 | 2006 | 2007 | 2008 | 2009 | 2010 | 2011 | 2012 | ||
|---|---|---|---|---|---|---|---|---|---|---|
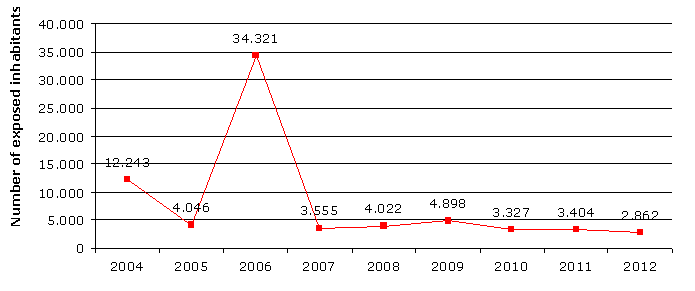
| Number of inhabitants | no. | 12243 | 4046 | 34321 | 3555 | 4022 | 4898 | 3327 | 3404 | 2862 |
| Max. Concentration of nitrates | no. | 84 | 93 | 75 | 60 | 62 | 66 | 66 | 71 | 71 |
ZZV Maribor, 2011.
ZZV Maribor, 2011.
ZZV Maribor, 2011


