[ZD05] Access to safe drinking water

Key message

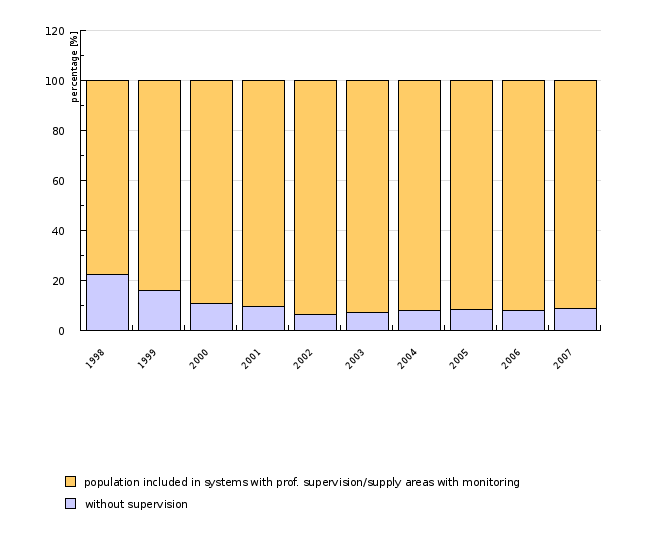
The majority (91 %) of the population of the Republic of Slovenia is supplied with drinking water from supply systems that are included in internal quality control. In the light of public health, the most problematic are small supply areas, which are faecally strongly polluted, primarily due to inappropriate professional management and insufficient supervision.
Definition
The indicator shows the number and percentage of inhabitants of the Republic of Slovenia, who are supplied with drinking water from drinking water supply systems that were included in drinking water monitoring in the period 2004-2007 or in internal quality control in the period 1998-2003. The drinking water supply system represents a supply area, which can be subdivided into several smaller units or supply zones.
A supply zone is a geographically defined within which water intended for human consumption comes from one or more sources and within which water quality may be considered as being approximately uniform. The Rules on Drinking Water classifies in Slovenia supply areas in categories by size, which are classified into small, mid and big areas with regard to the number of inhabitants supplied with drinking water (50-1000, 1001-10.000 and >10.000 inhabitants).
Charts
The database on drinking water supply systems and on the compliance of drinking water, National Institute of Public Health of the Republic of Slovenia, Monitoring on Drinking Water 2004-2007
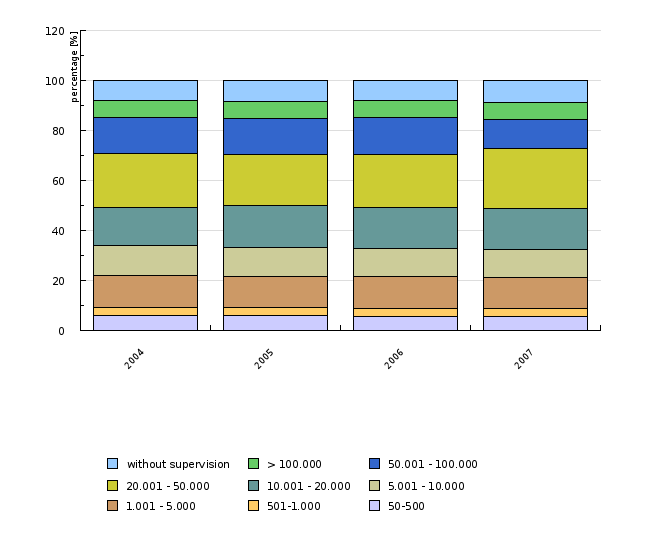
| 2004 | 2005 | 2006 | 2007 | ||
|---|---|---|---|---|---|
| 50-500 | No. | 119622 | 120712 | 115467 | 115692 |
| 501-1.000 | No. | 60545 | 63495 | 63881 | 65618 |
| 1.001 - 5.000 | No. | 257466 | 249602 | 252175 | 249523 |
| 5.001 - 10.000 | No. | 237706 | 233540 | 229876 | 220533 |
| 10.001 - 20.000 | No. | 304223 | 334488 | 323988 | 334102 |
| 20.001 - 50.000 | No. | 431573 | 403647 | 431688 | 481406 |
| 50.001 - 100.000 | No. | 292000 | 292000 | 292000 | 241000 |
| > 100.000 | No. | 137000 | 137000 | 137000 | 137000 |
| without supervision | No. | 156869 | 166630 | 162441 | 174532 |
| 50-500 | % | 6 | 6 | 5.7 | 5.7 |
| 501-1.000 | % | 3 | 3.2 | 3.2 | 3.2 |
| 1.001 - 5.000 | % | 12.9 | 12.5 | 12.6 | 12.4 |
| 5.001 - 10.000 | % | 11.9 | 11.7 | 11.4 | 10.9 |
| 10.001 - 20.000 | % | 15.2 | 16.7 | 16.1 | 16.5 |
| 20.001 - 50.000 | % | 21.6 | 20.2 | 21.5 | 23.8 |
| 50.001 - 100.000 | % | 14.6 | 14.6 | 14.5 | 11.9 |
| > 100.000 | % | 6.9 | 6.8 | 6.8 | 6.8 |
| without supervision | % | 7.9 | 8.3 | 8.1 | 8.6 |
The database on drinking water supply systems and on the compliance of drinking water, National Institute of Public Health of the Republic of Slovenia, Monitoring on Drinking Water 2004-2007
| 2004 | 2005 | 2006 | 2007 | ||
|---|---|---|---|---|---|
| 50-500 | No. | 706 | 721 | 692 | 697 |
| 501-1.000 | No. | 85 | 90 | 90 | 91 |
| 1.001 - 5.000 | No. | 112 | 109 | 111 | 111 |
| 5.001 - 10.000 | No. | 32 | 32 | 32 | 31 |
| 10.001 - 20.000 | No. | 22 | 24 | 23 | 24 |
| 20.001 - 50.000 | No. | 15 | 14 | 15 | 16 |
| 50.001 - 100.000 | No. | 4 | 4 | 4 | 3 |
| > 100.000 | No. | 1 | 1 | 1 | 1 |
The database on drinking water supply systems and on the compliance of drinking water, National Institute of Public Health of the Republic of Slovenia, Monitoring on Drinking Water 2004-2007
| 1998 | 1999 | 2000 | 2001 | 2002 | 2003 | 2004 | 2005 | 2006 | 2007 | ||
|---|---|---|---|---|---|---|---|---|---|---|---|
| without supervision | No. | 440152 | 319342 | 211509 | 192841 | 124094 | 144609 | 156869 | 166630 | 162441 | 174532 |
| population included in systems with prof. supervision/supply areas with monitoring | No. | 1533987 | 1656948 | 1765720 | 1786056 | 1871624 | 1852164 | 1840135 | 1834484 | 1846075 | 1844874 |
| without supervision | % | 22.3 | 16.2 | 10.7 | 9.7 | 6.2 | 7.2 | 7.9 | 8.3 | 8.1 | 8.6 |
| population included in systems with prof. supervision/supply areas with monitoring | % | 77.7 | 83.8 | 89.3 | 90.3 | 93.8 | 92.8 | 92.1 | 91.7 | 91.9 | 91.4 |
The database on drinking water supply systems and on the compliance of drinking water, National Institute of Public Health of the Republic of Slovenia, Monitoring on Drinking Water 2007
| Slovenija | Celje | Koper | Kranj | Ljubljana | Maribor | Murska Sobota | Nova Gorica | Novo mesto | R/K | ||
|---|---|---|---|---|---|---|---|---|---|---|---|
| small (50-1000) | % | 9 | 12.2 | 3.6 | 9.2 | 6.9 | 3.8 | 17.5 | 16.7 | 10.9 | 17.1 |
| medium (100-10.000) | % | 23.3 | 22.8 | 1.8 | 28.3 | 24.8 | 14.1 | 22.9 | 24.2 | 34.1 | 59.4 |
| big (>10.000) | % | 59.1 | 40.1 | 88.3 | 52.4 | 68.7 | 79.4 | 39.8 | 52.5 | 43.4 | - |
| without supervision | % | 8.6 | 24.9 | 6.3 | 10.2 | -0.5 | 2.7 | 19.8 | 6.6 | 11.7 | 23.5 |
Goals
- Provision of access to safe and wholesomeness compliant drinking water to anyone, always, everywhere and in sufficient amounts.
- Complete capture of drinking water supply systems in the entire supervision area with appropriate professional management.
- Implementation of monitoring in all systems (check and audit monitoring).
- Informing and education of the population, which is not included in regular monitoring, about the provision of higher quality of drinking water (recommendations for handling in case of reasonable grounds that water represents a potential hazard to health).
- Increase in the size of the population, for which the results regarding the quality of drinking water will be known.
Comment
Approximately 91 % (or 1.840.000) of the population of the Republic of Slovenia was supplied with drinking water in supply areas, which were in the period 2004-2007 included in the drinking water monitoring. The differences between years were negligible and move between 0.2 and 0.7 percentage points. In the period 2004–2007, 8-9 % (or 156.000-175.000) of the population was supplied with drinking water from systems that supplied less than 50 persons or were, due to incomplete capture, not included in internal quality control (primarily in the size category of 50–500 inhabitants) and professionally supervised monitoring. The majority of the population of the Republic of Slovenia is bound to supply systems supplying 20.000-50.000 inhabitants (Figures 1 and 3).
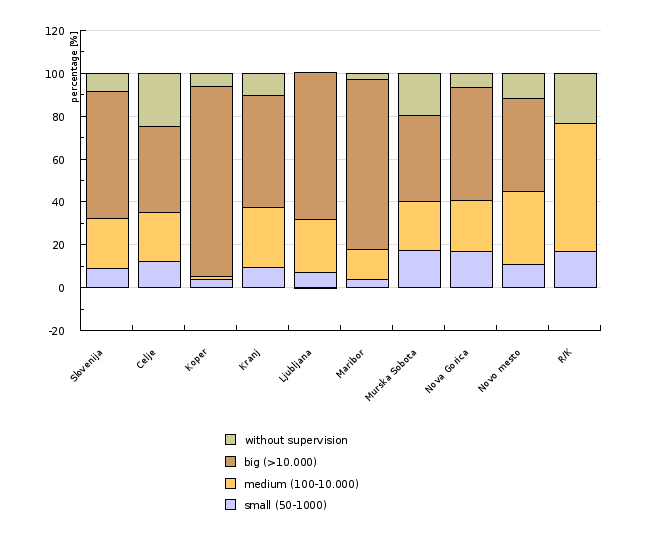
The databases on drinking water supply systems and on the compliance of drinking water, which were managed in the period 2004-2007 by the National Institute of Public Health of the Republic of Slovenia, clearly indicate that in Slovenia in this period 968-995 supply areas that supplied 50 or more inhabitants were recorded. The differences between years are minimum, while the decrease or increase of the number in years moves between 0.6 and 2.7 percentage points, primarily in the lowest size category of supply areas (50-500 persons) (Figure 2). The differences appear due to the improvement of records, suspension of small supply areas and inclusion of inhabitants in bigger supply areas. According to the distribution of local Institutes of Public Health (IPH), approximately one quarter of the population of IPH Celje and Ravne na Koroškem and one fifth of the population of IPH Murska Sobota remain without suitable control (Figure 4).
From the point of view of public health, the most problematic are small supply areas, since they are microbiologically, especially faecally, strongly polluted; moreover, there is also no data available on their chemical pollution. The majority of systems (72 % of all or 700 systems) supplying only 50-500 persons was included in the system of professional management due to the requirements of the Rules or the EU Directive on the quality of water intended for human consumption (Directive 98/83/EC) since they supply 50 or more persons. For the most part, these systems do not comply with the drinking water requirements, since they do not have appropriate professional management, especially drinking water treatment where this is necessary, insufficient supervision and other factors. The majority of these systems, which do not provide safe drinking water with regard to the regulations, would have to be suspended or appropriately regularized.
Methodology
Data for Slovenia:
Objectives summarised by: Action Plan for Water Supply (July 2006)
Source database: The database on drinking water supply systems and on the compliance of drinking water for the period 2004 - 2007 and the database on drinking water supply systems for the period 1998-2003.
The data referring to the period 2004-2007 was collected in accordance with the Rules on Drinking Water (OG RS, no. 19/04, 35/04, 26/06, 92/06, 25/09), on the basis of which the database on drinking water supply systems and on the compliance of drinking water was prepared. The database on the compliance of drinking water contains data collected through monitoring. The monitoring operator in the period 2004-2007 was the National Institute of Public Health of the Republic of Slovenia (NIPH). The databases contain data on the undertaker, drinking water supply system, supply area (water type, water preparation, number of supplied population) and test results of drinking water samples.
Until 2003, the main source of data are the databases on drinking water supply systems for the period 1998-2003, the basis of which is the Rules on Drinking Water Quality (OG RS, no. 46/97, 52/97, 54/98, 7/00). The data was provided by drinking water supply system undertakers within the framework of internal quality control and reported to the local Institutes of Public Health (IPH), with whom they had concluded agreements. NIPH prepared an annual report and communicated it to the Ministry of Health. The samples were taken in systems that supplied 20 or more persons, as a rule, after the treatment of water. Besides the changes in the monitoring methodology, the selection of parameters, their thresholds, sampling schemes, etc. were slightly changed in 2004; therefore, the results of monitoring in the period 2004-2007 are not completely comparable with the data in the period 1998-2003. They are only for the purposes of approximate comparison.
Data administrator: National Institute of Public Health of the Republic of Slovenia, Center for Environmental Health
Data acquisition date for this indicator: June 2009.
Methodology and frequency of data collection for the indicator: The database is refreshed and supplemented once a year. The methodology and frequency of data collection for the period up to 2003 is described in detail in the Rules on Drinking Water Quality and since 2004 in the Rules on Drinking Water and Drinking Water Monitoring Programme for the Period 2004-2007.
Data processing methodology: The data on the number of supply areas and the number of population supplied with drinking water is processed, by size categories of supply areas and by local Institutes of Public Health (IPH). The data are presented in Annual reports on drinking water, published on the website of the NIPH. For the purposes of transparency, the data are calculated in percentage shares.
Information concerning data quality:
Advantages: The data that is part of the international exchange was used for the indicator. The Rules on Drinking Water (OG RS, no. 19/04, 35/04, 26/06, 92/06, 25/09) is harmonised with the EU Directive on the quality of water intended for human consumption (Directive 98/83/EC). In accordance with the legislation, for the needs of verification, if drinking water fulfils the requirements of the rules, especially for compliance, monitoring bound to supply areas supplying 50 or more persons is implemented since 2004. It is provided by the Ministry of Health. Compliance must be guaranteed in places where water is used as drinking water; for instance, the taps of users.
Disadvantages: In accordance with the requirements of the rules, drinking water monitoring did not include systems supplying up to 50 persons as well as systems not included due to incomplete capture. Furthermore, monitoring was not implemented completly in the smallest supply areas.
The data for the period 2004-2007 is not totally comparable with the data for the period 1998-2003 due to the changes of the Rules on Drinking Water. In accordance with the former Rules on Drinking Water Quality, internal quality control was conducted in systems supplying 20 or more persons. According to the new Rules on Drinking Water referring to the data for the period 2004-2007, monitoring is performed in supply areas supplying 50 or more persons. Besides the changes in the size category of supply areas, changes appeared also in the selection of monitored parameters, their threshold values, etc. Due to the indicated reasons, we cannot talk about a continuity of data, but only about an approximate comparison. Up to 2003, sampling was provided by undertakers anywhere in the drinking water system, while in the period 2004-2007 sampling was provided by the Ministry of Health from the taps of users.
Relevance, accuracy, robustness, uncertainty:
Reliability of the indicator (archive data): the data for the period 1998-2003 is not comparable with the data for the period 2004-2007 due to the changes in the capture methodology of supply areas supplying 50 or more persons.
Uncertainty of the indicator (scenarios/projections): scenarios/projections were not created
Overall assessment (1 = no major comments, 3 = data to be considered with reservation)
Relevance: 1
Accuracy: 2 (incomplete capture)
Completeness over time: 2
Completeness over space: 1
Other sources and literature:
- Council Directive 98/83/EC of 3 November 1998 on the quality of water intended for human consumption
- Rules on Drinking Water (OG RS, no. 19/04, 35/04, 26/06, 92/06, 25/09)
- Rules on Drinking Water Quality (OG RS, no. 46/97, 52/97, 54/98, 7/00)
- Drinking Water Monitoring Programme. Institute of Public Health of the Republic of Slovenia.


