[KM09] Energy use in agriculture

Key message

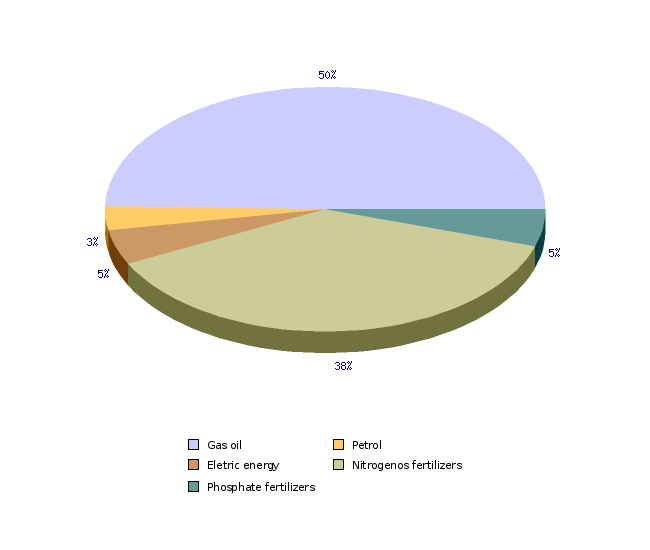
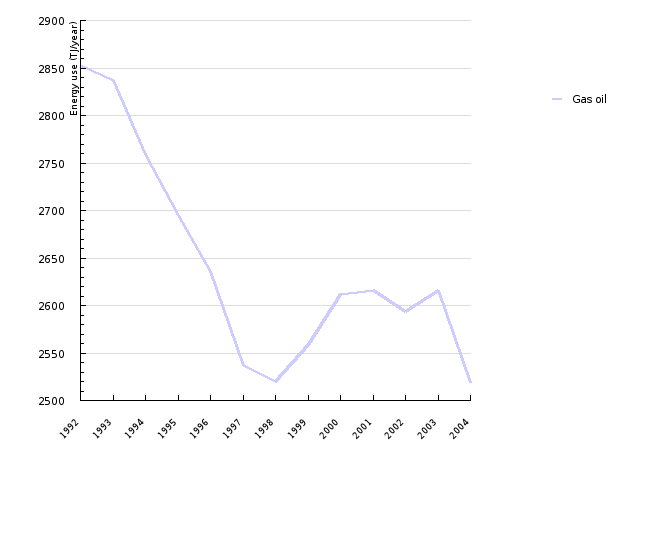
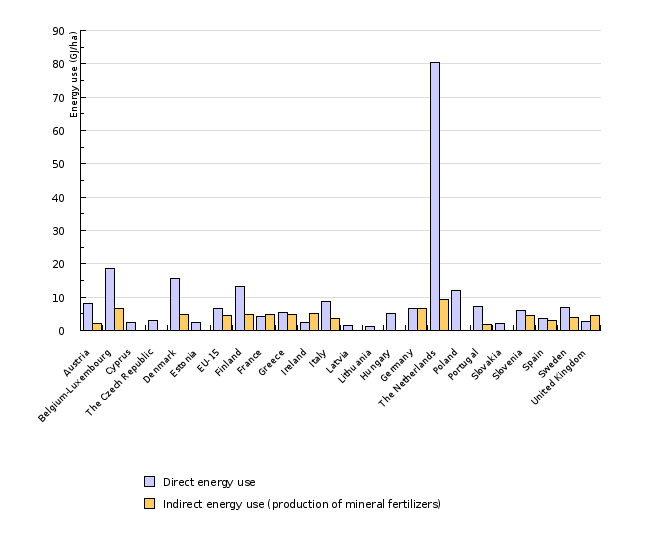
In Slovenia, gas oil used as a propellant for agricultural machinery takes up the largest part (49.6 %) of energy use in agriculture, followed by the energy for the production of mineral fertilizers (42,6 %) and electric energy (4.6 %). According to our estimates, Slovenia’s direct energy use in 2000 (energy for the production of mineral fertilizers excluded) totalled 5.9 GJ per hectare of utilised agricultural area, which is very close to the mean total energy use in the EU-15 (6.5 GJ). Slovenia’s use of energy for the production of mineral fertilizers (4.4 GJ/ha) is also at the EU-15 level. Between 1992 and 2004, the consumption of gas oil decreased by 11.7 %.
Definition
In agriculture, energy use is expressed by direct use of gas oil, petrol and electric energy and by indirect use for the production of mineral fertilizers. We also presented the consumption per hectare of utilised agricultural area and compared it with other European countries.
Charts
Agricultural Institute of Slovenia, 2003; Statistical Office of the Republic of Slovenia, 2006.
| Gas oil | Petrol | Eletric energy | Nitrogenos fertilizers | Phosphate fertilizers | ||
|---|---|---|---|---|---|---|
| 1991 | TJ/year | 248 | ||||
| 1992 | TJ/year | 2853 | 2265 | 219 | ||
| 1993 | TJ/year | 2837 | 1941 | 243 | ||
| 1994 | TJ/year | 2759 | 1975 | 268 | ||
| 1995 | TJ/year | 2695 | 1875 | 246 | ||
| 1996 | TJ/year | 2636 | 1820 | 240 | ||
| 1997 | TJ/year | 2537 | 181 | 1978 | 247 | |
| 1998 | TJ/year | 2520 | 2024 | 267 | ||
| 1999 | TJ/year | 2559 | 2000 | 279 | ||
| 2000 | TJ/year | 2612 | 166 | 244 | 1987 | 258 |
| 2001 | TJ/year | 2616 | 243 | 2022 | 235 | |
| 2002 | TJ/year | 2594 | 251 | 1944 | 222 | |
| 2003 | TJ/year | 2616 | 246 | 2007 | 217 | |
| 2004 | TJ/year | 2519 | 223 | 1760 | 207 |
Statistical Office of the Republic of Slovenia, 2006; Agricultural Institute of Slovenia, 2003; European Environment Agency, 2005.
| 1992 | 1993 | 1994 | 1995 | 1996 | 1997 | 1998 | 1999 | 2000 | 2001 | ||
|---|---|---|---|---|---|---|---|---|---|---|---|
| Gas oil | TJ/year | 2853 | 2837 | 2759 | 2695 | 2636 | 2537 | 2520 | 2559 | 2612 | 2616 |
| 2002 | 2003 | 2004 | |||||||||
| Gas oil | TJ/year | 2594 | 2616 | 2519 |
Statistical Office of the Republic of Slovenia, 2006; Agricultural Institute of Slovenia, 2003; European Environment Agency, 2005.
| 2000 | 2001 | 2002 | 2003 | 2004 | ||
|---|---|---|---|---|---|---|
| Eletric energy | TJ/year | 244 | 243 | 251 | 246 | 223 |
Statistical Office of the Republic of Slovenia, 2006; Agricultural Institute of Slovenia, 2003; European Environment Agency, 2005.
| 1992 | 1993 | 1994 | 1995 | 1996 | 1997 | 1998 | 1999 | 2000 | 2001 | ||
|---|---|---|---|---|---|---|---|---|---|---|---|
| Nitrogenos fertilizers | GJ/ha | 4.1 | 3.5 | 3.7 | 3.6 | 3.6 | 4 | 4.1 | 4 | 3.9 | 4 |
| Phosphate fertilizers | GJ/ha | 0.4 | 0.4 | 0.5 | 0.5 | 0.5 | 0.5 | 0.5 | 0.6 | 0.5 | 0.5 |
| Total | GJ/ha | 4.5 | 4 | 4.2 | 4 | 4 | 4.5 | 4.7 | 4.6 | 4.4 | 4.4 |
| 2002 | 2003 | 2004 | |||||||||
| Nitrogenos fertilizers | GJ/ha | 3.9 | 3.9 | 3.6 | |||||||
| Phosphate fertilizers | GJ/ha | 0.4 | 0.4 | 0.4 | |||||||
| Total | GJ/ha | 4.3 | 4.4 | 4 |
Eurostat, 2005; Agricultural Institute of Slovenia, 2003; Statistical Office of the Republic of Slovenia, 2006; European Environment Agency, 2005.
| Austria | Belgium-Luxembourg | Cyprus | The Czech Republic | Denmark | Estonia | EU-15 | Finland | France | Greece | ||
|---|---|---|---|---|---|---|---|---|---|---|---|
| Direct energy use | GJ/ha | 8.1 | 18.5 | 2.3 | 3.1 | 15.6 | 2.5 | 6.5 | 13.1 | 4.3 | 5.4 |
| Indirect energy use (production of mineral fertilizers) | GJ/ha | 2.2 | 6.6 | / | / | 4.8 | / | 4.4 | 4.7 | 4.9 | 4.7 |
| Ireland | Italy | Latvia | Lithuania | Hungary | Germany | The Netherlands | Poland | Portugal | Slovakia | ||
| Direct energy use | GJ/ha | 2.5 | 8.6 | 1.6 | 1.2 | 5 | 6.7 | 80.5 | 11.9 | 7.2 | 2.2 |
| Indirect energy use (production of mineral fertilizers) | GJ/ha | 5.1 | 3.5 | / | / | / | 6.6 | 9.3 | / | 1.9 | / |
| Slovenia | Spain | Sweden | United Kingdom | ||||||||
| Direct energy use | GJ/ha | 5.9 | 3.6 | 6.9 | 2.8 | ||||||
| Indirect energy use (production of mineral fertilizers) | GJ/ha | 4.4 | 2.9 | 4 | 4.4 |
Goals
By adopting the Kyoto Protocol, Slovenia entered the commitment to reduce the emissions of greenhouse gas (GHG) by 8 % in the first target period 2008–2012 relative to 1986. To achieve this goal, Slovenia has to accomplish the following sector goals outlined in the Operational Programme for Limiting Greenhouse gas Emissions:
– reduction of energy intensity (by 30 % by 2015 relative to 2000);
– a 12-percent share of renewable energy sources in the country’s total energy supply by 2010;
– a 2-percent share of biofuel in traffic by 2005 and a 5.75-percent share by 2010.
Agriculture can help achieve these goals in all these fields.
Comment
Gas oil used as a propellant for agricultural machinery presents the largest share (42.6 %) in the total energy use in agriculture. It is followed by the energy for the production of mineral fertilizers (42.6 %), electric energy (4.6 %) and petrol (3.2 %).
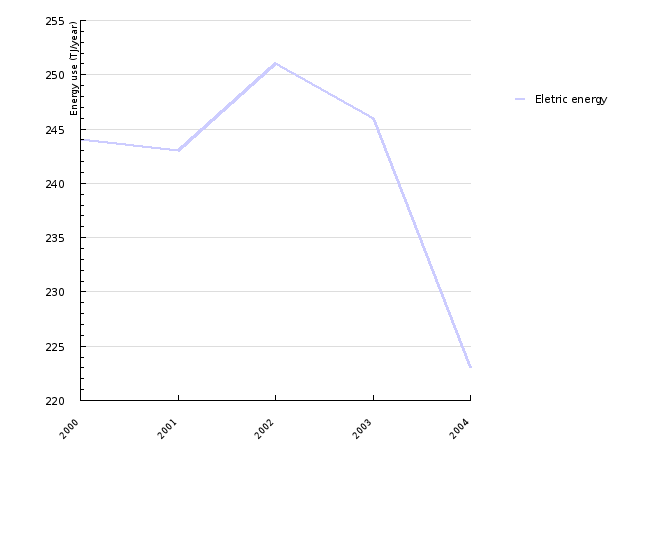
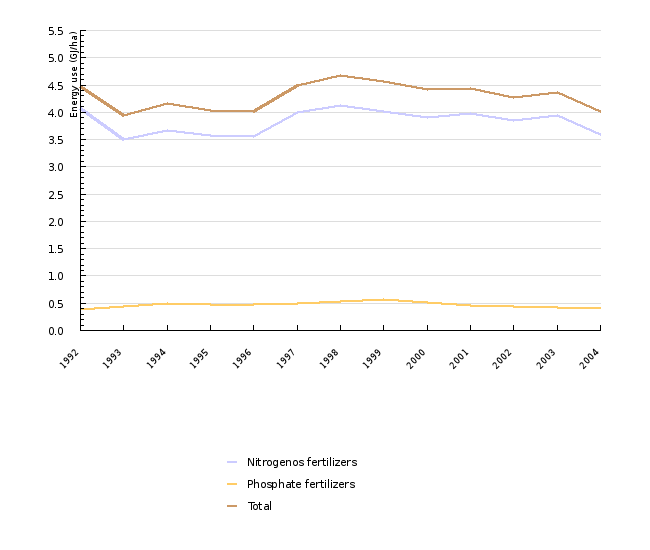
Between 1992 and 2004, the use of gas oil in agriculture declined by 11.7 %. In the 1991-2000 period, the consumption of petrol decreased, too, by 33.1 %. The use of electric energy was only monitored in the period between 2000 and 2004, when it declined by 8.6 %. The use of energy for the production of mineral fertilizers has also been on the decrease from 1998 on.
The consumption of gas oil, petrol and electric energy in 2002 totalled 5.9 GJ per hectare of utilised agricultural area. Slovenia’s average use is close to the EU-15 average (6.5 GJ/ha). The following factors are responsible for the increasing energy use in Slovenia: fragmentation of farmland, outdated machinery, long winters and thus increased demand for conserved fodder for domestic animals, and traditional methods of land cultivation by ploughing. The relatively small share of the production of crops in heated greenhouses is advantageous in terms of energy use. In 2000, the consumption of energy for the production of mineral fertilizers (4.4 GJ/ha) was at the EU-15 level (4.4 GJ/ha) as well. Slovenia does not produce mineral fertilizers and thus this energy does not have any impact on the national energy balance; however, indirectly, it burdens the environment with carbon dioxide.
Methodology
Data for Slovenia
Statistical Office of the Republic of Slovenia
Use of Fuels in Agriculture, Agricultural Institute of Slovenia, 2003
Energy use, Indicator Fact Sheet, European Environment Agency, 2005
Energy use in agriculture is presented as the direct use of gas oil, petrol and electric energy, and as the indirect use of energy for the production of mineral fertilizers. There are different ways to estimate the use of gas oil. In view of the previous studies on the use of fuel in agriculture and other data on energy use, we have concluded that the most credible estimate of the use of gas oil is relative to the utilised agricultural area, which is 140 l/ha (Use of Fuels in Agriculture, Agricultural Institute of Slovenia, 2003). We calculated the total use of gas oil on the basis of the utilised agricultural area and expressed it with gas oil energy in TJ. It should be noted that this is not the actual use but a rough estimate.
For the consumption of petrol, we used statistical data for agricultural businesses; for family farms, we made an estimate based on the number of family farms, the number of petrol-driven farming machinery and the estimated number of work hours. We acquired information on the consumption of electric energy in agriculture from the Statistical Office of the Republic of Slovenia. These are unpublished data collected for other statistical processing in agriculture (estimates, national accounts in agriculture). We calculated the data on the consumed energy for the production of mineral fertilizers using the data on the consumption of mineral fertilizers (Statistical Office of the Republic of Slovenia) and on the basis of the energy needed for the production of 1 kg of nutrients (European Environment Agency). The data supporting the above-discussed indicator are considered to be temporary evaluations. We will be able to make a more reliable assessment of energy use on farms as soon as the FADN accountancy data are available.
Data for Europe
Eurostat
Energy use, Indicator Fact Sheet, European Environment Agency, 2005
To calculate the final energy use per hectare on utilised agricultural area for 2000, we used the Eurostat data reporting the final consumption of energy in tons of oil equivalent and the Eurostat data on the utilised agricultural area. The use of energy for the production of mineral fertilizers is calculated from the Eurostat data on the consumption of individual nutrients.


