[ZR04] Emissions of non-methane volatile organic compounds

Definition
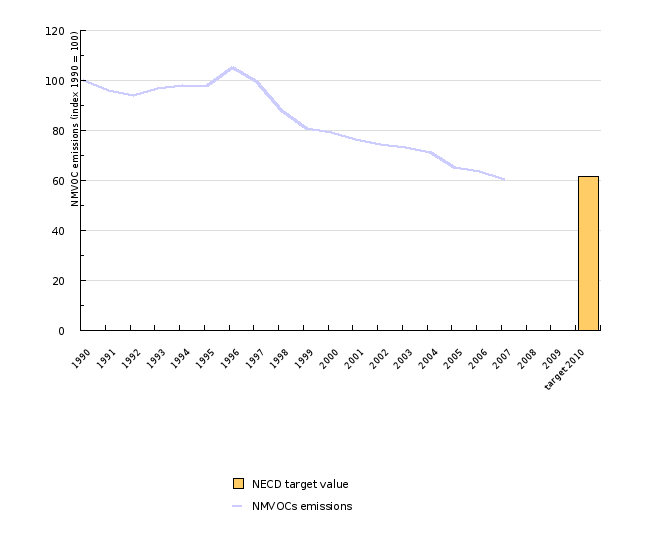
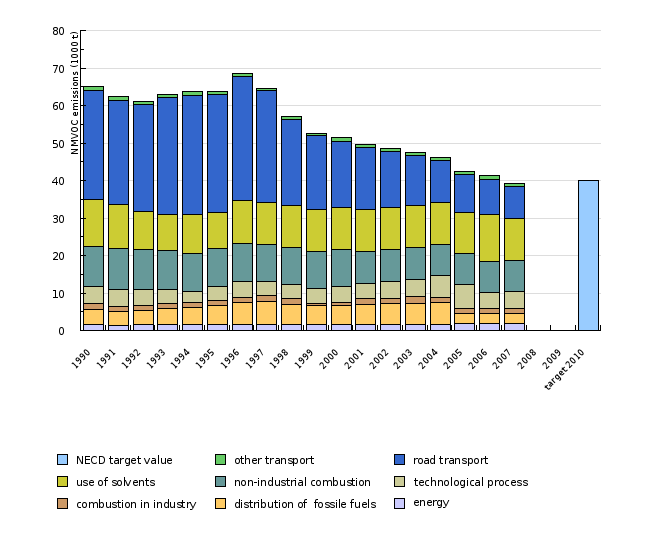
The indicator shows the trend in quantities of total non-methane volatile organic compounds (NMVOC) emissions in Slovenia and main source categories. The quantities of emissions are calculated in accordance with the methodology for creating the National Emission Inventory, based on the CORINAIR methodology. The emissions are shown in a time series from 1990 to 2003.
From 2000 the calculations of annual NMVOC emissions include sources from wood, waste wood and biomass combustion, and are not direclty comparable to previous years values.
Charts
National Emission Inventory, Environmental Agency of the Republic of Slovenia, 2008
| 1990 | 1991 | 1992 | 1993 | 1994 | 1995 | 1996 | 1997 | 1998 | 1999 | ||
|---|---|---|---|---|---|---|---|---|---|---|---|
| NMVOCs emissions | 1000 t | 64.972 | 62.47 | 61.178 | 62.841 | 63.668 | 63.777 | 68.453 | 64.619 | 57.104 | 52.617 |
| NMVOCs emissions | index (1990 = 100) | 100 | 96.149110386 | 94.1605614726 | 96.7201255926 | 97.9929815921 | 98.1607461676 | 105.357692544 | 99.4566890353 | 87.8901680724 | 80.9841162347 |
| NECD target value | index (1990 = 100) | ||||||||||
| 2000 | 2001 | 2002 | 2003 | 2004 | 2005 | 2006 | 2007 | 2008 | 2009 | ||
| NMVOCs emissions | 1000 t | 51.336 | 49.601 | 48.408 | 47.45 | 46.186 | 42.422 | 41.27 | 39.334 | ||
| NMVOCs emissions | index (1990 = 100) | 79.0124976913 | 76.3421166041 | 74.5059410207 | 73.0314597057 | 71.0860062796 | 65.2927414886 | 63.5196700117 | 60.5399248907 | ||
| NECD target value | index (1990 = 100) | ||||||||||
| target 2010 | |||||||||||
| NMVOCs emissions | 1000 t | 40 | |||||||||
| NMVOCs emissions | index (1990 = 100) | ||||||||||
| NECD target value | index (1990 = 100) | 61.5649818383 |
National Emission Inventory, Environmental Agency of the Republic of Slovenia, 2008
| 1990 | 1991 | 1992 | 1993 | 1994 | 1995 | 1996 | 1997 | 1998 | 1999 | ||
|---|---|---|---|---|---|---|---|---|---|---|---|
| energy | 1000 t | 1.6 | 1.4 | 1.6 | 1.6 | 1.5 | 1.5 | 1.5 | 1.6 | 1.7 | 1.5 |
| distribution of fossile fuels | 1000 t | 4.1 | 3.7 | 3.7 | 4.2 | 4.6 | 5.1 | 5.8 | 6 | 5.3 | 5.1 |
| combustion in industry | 1000 t | 1.6 | 1.3 | 1.4 | 1.3 | 1.4 | 1.3 | 1.5 | 1.6 | 1.6 | 0.7 |
| technological process | 1000 t | 4.5 | 4.6 | 4.2 | 3.8 | 3 | 3.9 | 4.3 | 3.8 | 3.6 | 4 |
| non-industrial combustion | 1000 t | 10.6 | 10.9 | 10.6 | 10.4 | 10.2 | 10 | 10.1 | 9.9 | 9.9 | 9.9 |
| use of solvents | 1000 t | 12.6 | 11.6 | 10.2 | 9.6 | 10.4 | 9.5 | 11.4 | 11.3 | 11.1 | 11.1 |
| road transport | 1000 t | 28.9 | 27.8 | 28.5 | 31.1 | 31.8 | 31.6 | 33.1 | 29.6 | 23 | 19.5 |
| other transport | 1000 t | 1.1 | 1 | 0.9 | 0.8 | 0.9 | 0.8 | 0.8 | 0.7 | 0.8 | 0.7 |
| 2000 | 2001 | 2002 | 2003 | 2004 | 2005 | 2006 | 2007 | 2008 | 2009 | ||
| energy | 1000 t | 1.5 | 1.6 | 1.7 | 1.6 | 1.7 | 1.8 | 1.8 | 1.9 | ||
| distribution of fossile fuels | 1000 t | 5.3 | 5.4 | 5.4 | 5.5 | 5.8 | 2.6 | 2.6 | 2.6 | ||
| combustion in industry | 1000 t | 0.7 | 1.4 | 1.5 | 2 | 1.3 | 1.3 | 1.5 | 1.3 | ||
| technological process | 1000 t | 4.2 | 4.1 | 4.5 | 4.5 | 5.8 | 6.4 | 4.1 | 4.5 | ||
| non-industrial combustion | 1000 t | 9.8 | 8.5 | 8.5 | 8.5 | 8.4 | 8.4 | 8.3 | 8.3 | ||
| use of solvents | 1000 t | 11.2 | 11.1 | 11.2 | 11.2 | 11.3 | 10.8 | 12.7 | 11.4 | ||
| road transport | 1000 t | 17.8 | 16.7 | 14.9 | 13.4 | 11.2 | 10.2 | 9.2 | 8.4 | ||
| other transport | 1000 t | 0.8 | 0.8 | 0.7 | 0.8 | 0.8 | 0.8 | 1 | 0.9 | ||
| target 2010 | |||||||||||
| energy | 1000 t | ||||||||||
| distribution of fossile fuels | 1000 t | ||||||||||
| combustion in industry | 1000 t | ||||||||||
| technological process | 1000 t | ||||||||||
| non-industrial combustion | 1000 t | ||||||||||
| use of solvents | 1000 t | ||||||||||
| road transport | 1000 t | ||||||||||
| other transport | 1000 t |
Goals
The main purpose of this indicator is to show NMVOC emissions and reduction thereof to the target value 40000, as required by the Protocol on the Reduction of Acidification, Eutrophication and Ground Ozone, and Directive 2001/81/EC on National Emissions Ceilings for Certain Atmospheric Pollutants (NECD). Air emission management and reduction is also a target of the National Environmental Action Programme.
Comment
Calculated NMVOC emissions exceede target value. The increase in 2000, shown by the figure ZR4-1, is caused by emission calculation methodology change. At energy production, industrial and non-industrial combustion also the emissions resulted from biomass combustion was taken into account as an important source of NMVOC emissions. Data for previous years are not available.
Methodology
The data are taken from the National Emission Inventory database. The database maintained at the Environmental Agency of the Republic of Slovenia contains emission assessments that are made on the basis of statistical data (on sold fuels, industrial production, agricultural activities, etc.) by using emission factors.


