[PP16] Wildfires
[PP16] Wildfires

Key message
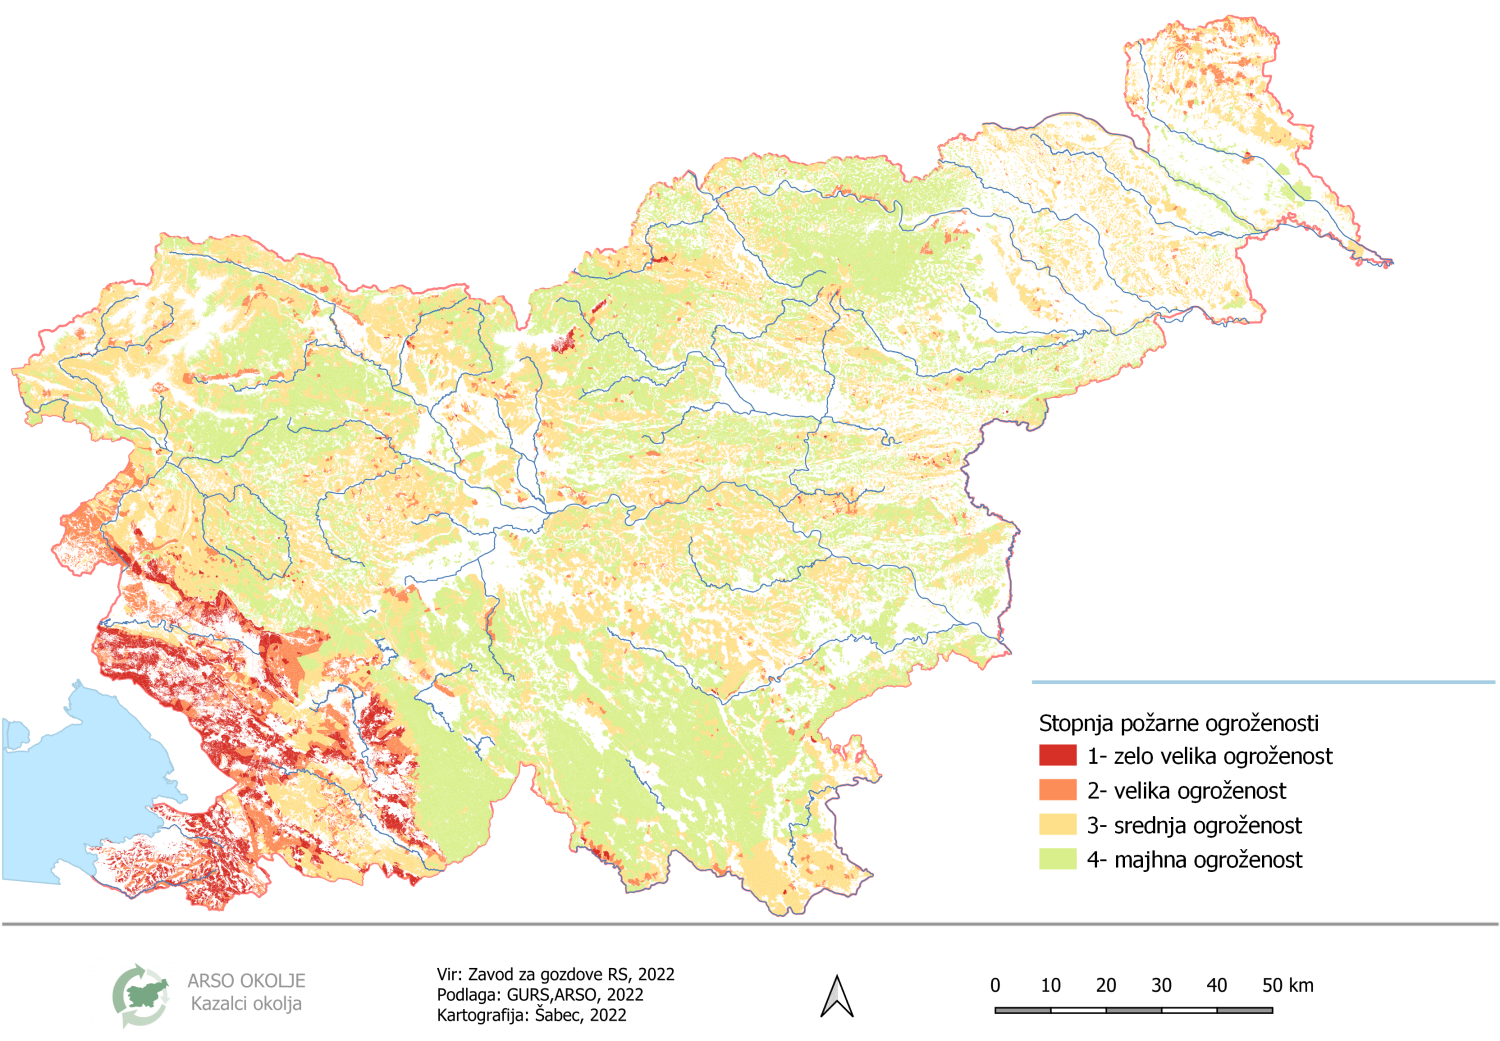
The number and area of wildfires varies greatly between years, as the incidence depends on the weather conditions in each year. In Slovenia, the western, sub-Mediterranean part of the country is the most endangered. Climate change will also pose a greater fire risk in the eastern part of Slovenia.
Charts
Figure PP16-1: Number of wildfires in Slovenia, by type of land use, 2005- 2021
Sources:
Administration for Civil Protection and Disaster Relief, 2022
| Forest fires [number] | Fires on cultivated land [number] | Medlands fires [number] | Other fires [number] | All fires in nature [number] | |
|---|---|---|---|---|---|
| 2005 | 244 | 41 | 783 | 422 | 1490 |
| 2006 | 297 | 62 | 577 | 543 | 1479 |
| 2007 | 443 | 109 | 814 | 466 | 1832 |
| 2008 | 172 | 57 | 600 | 492 | 1321 |
| 2009 | 281 | 59 | 907 | 379 | 1626 |
| 2010 | 134 | 32 | 417 | 403 | 986 |
| 2011 | 331 | 68 | 915 | 626 | 1940 |
| 2012 | 462 | 112 | 1349 | 837 | 2760 |
| 2013 | 268 | 63 | 453 | 598 | 1382 |
| 2014 | 154 | 26 | 266 | 442 | 888 |
| 2015 | 301 | 55 | 562 | 606 | 1524 |
| 2016 | 321 | 50 | 437 | 608 | 1416 |
| 2017 | 594 | 88 | 813 | 903 | 2398 |
| 2018 | 180 | 45 | 237 | 566 | 1028 |
| 2019 | 218 | 57 | 502 | 800 | 1577 |
| 2020 | 202 | 34 | 306 | 1088 | 1630 |
| 2021 | 104 | 36 | 401 | 893 | 1434 |
Figure PP16-2: Area of wildires fires by type of land use, 2005- 2021
Sources:
VIR: https://spin3.sos112.si/javno/porocilo/pozarinarava (22. 03. 2022)
| air transport[ha] | road transport[ha] | rail transport[ha] | pipeline transport[ha] | [ha] | |
|---|---|---|---|---|---|
| 2005 | 189.69 | 1.46 | 531.49 | 13.72 | 736.36 |
| 2006 | 1441.81 | 11.39 | 427.25 | 88.18 | 1968.63 |
| 2007 | 278.12 | 11.79 | 290.87 | 116.02 | 696.80 |
| 2008 | 579.94 | 13.35 | 364.45 | 79.12 | 1036.86 |
| 2009 | 292.56 | 13.70 | 597.98 | 91.31 | 995.55 |
| 2010 | 117.73 | 3.76 | 180.67 | 105.79 | 407.95 |
| 2011 | 293.10 | 32.83 | 579.15 | 255.13 | 1160.21 |
| 2012 | 358.90 | 11.11 | 694.01 | 265.37 | 1329.39 |
| 2013 | 100.12 | 9.49 | 107.47 | 217.65 | 434.73 |
| 2014 | 76.17 | 2.74 | 62.39 | 196.34 | 337.64 |
| 2015 | 187.39 | 60.61 | 182.13 | 266.95 | 697.08 |
| 2016 | 635.20 | 13.51 | 125.72 | 174.46 | 948.89 |
| 2017 | 449 | 37.12 | 385.78 | 811.95 | 1683.85 |
| 2018 | 74.44 | 16.42 | 100.10 | 403.21 | 594.17 |
| 2019 | 322.41 | 9.60 | 193.95 | 501.25 | 1027.21 |
| 2020 | 130.49 | 17.73 | 74.92 | 652.80 | 875.94 |
| 2021 | 115.13 | 35.99 | 102.38 | 609.34 | 862.84 |
Figure PP16-3: Map of fire-prone forests in Slovenia
Figure PP16-4: Number of fires in european countries 2020
Sources:
EFFIS, 2022
| count [%] | area [%] | |
|---|---|---|
| Czech Republic | 108 | 1305 |
| Luxemburg | 120 | 118 |
| Ireland | 142 | 23994 |
| Poland | 157 | 64 |
| Slovenia | 221 | 477 |
| Malta | 233 | 60 |
| Austria | 499 | 5258 |
| Portugal | 581 | 309 |
| Cyprus | 581 | 309 |
| Croatia | 627 | 5152 |
| Iceland | 724 | 1072 |
| Spain | 1239 | 2895 |
| Hungary | 1260 | 719 |
| Romania | 1260 | 719 |
| Bulgaria | 1360 | 368 |
| Belgium | 1360 | 368 |
| Greece | 2081 | 484 |
| EU-28 | 4865 | 55656 |
| Denmark | 5305 | 821 |
| Netherlands | 5305 | 821 |
| France | 6627 | 8417 |
| Italy | 7372 | 17077 |
| Germany | 9619 | 67170 |
| Latvia | 9619 | 67170 |
| Slovakia | 9619 | 67170 |
| Sweden | 9619 | 67170 |
| Estonia | 9619 | 67170 |
| Finland | 9619 | 67170 |
| Lithuania | 9619 | 67170 |
| United Kingdom | 9619 | 67170 |
| Finland | 9619 | 67170 |
| Sweden | 9619 | 67170 |
| Germany | 9619 | 67170 |
| Latvia | 9619 | 67170 |
Methodology
Date of data source summarization


