[PR04] Final energy consumption in transport

Key message

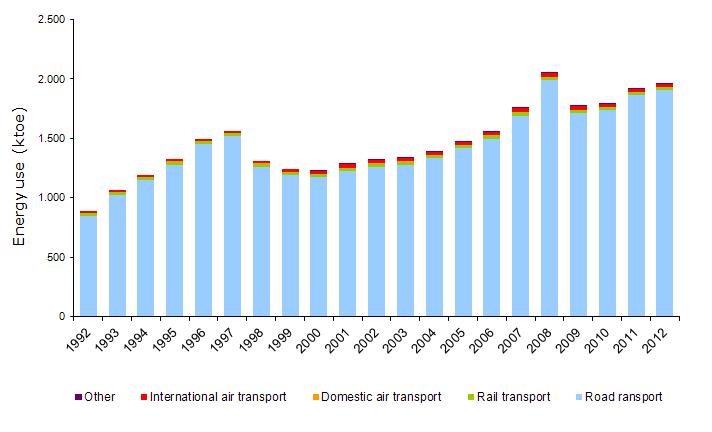
Energy consumption in transport has gradually increased after the decrease caused by the economic crisis. In 2012, the share of transport in the final use of energy equalled the highest share reached so far. Most energy is consumed in road transport, which is also growing at the fastest rate.
Definition
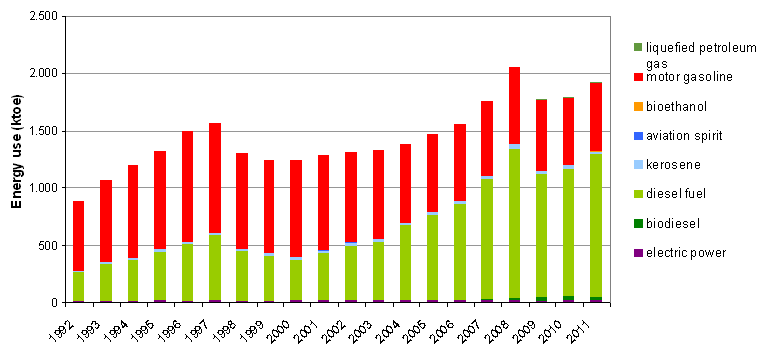
This indicator shows energy consumption in transport by transport mode (road, railway, maritime) and energy/fuel type. Energy consumption has a significant impact on the environment, e.g. through climate change, air pollutant emissions, noise, etc. Recent increases in energy consumption in transport have offset reduction in other sectors, which is reflected in greenhouse gas emissions, for example. Measures to improve energy efficiency of individual vehicles were effective to a certain point; the effect, however, was offset by the number of vehicles, travelled kilometres, etc. Transport is the only sector in which fossil fuels represent by far the largest share of energy sources.
It is important to reduce final energy consumption from the perspective of providing reliability of energy supply, competitiveness of economy as well as the efforts to reduce environmental impacts by reducing emissions of air pollutants and greenhouse gases.
Energy consumption is expressed in energy units (ktoe). The heating value of individual types of fuels is used for conversion from units of mass.
This indicator can be presented in relative (shares of individual sectors in total electricity consumption) or absolute unites. For presentation in absolute terms, the unit of one thousand tonnes of oil equivalents (ktoe) is used.
Charts
Statistical Office of the Republic of Slovenia, Jožef Stefan Institute, 2013.
| 1992 | 1993 | 1994 | 1995 | 1996 | 1997 | 1998 | 1999 | 2000 | 2001 | ||
|---|---|---|---|---|---|---|---|---|---|---|---|
| road ransport | ktoe | 845.5 | 1024.8 | 1146.1 | 1276 | 1450 | 1516.9 | 1261.1 | 1193.2 | 1176.8 | 1227.4 |
| rail transport | ktoe | 27.9 | 25.8 | 25.9 | 28.9 | 26 | 26.3 | 26 | 26 | 23.8 | 25 |
| domestic air transport | ktoe | 0 | 1 | 1 | 1 | 1 | 1 | 1 | 1 | 1 | 1 |
| international air transport | ktoe | 11.4 | 16.6 | 17.7 | 19.8 | 17.7 | 18.7 | 18.7 | 20.8 | 25 | 27 |
| other | ktoe | 0 | 0 | 0 | 0 | 0 | 0 | 0 | 0 | 10.1 | 8.1 |
| total | ktoe | 884.9 | 1068.3 | 1190.7 | 1325.7 | 1494.7 | 1562.9 | 1306.8 | 1241 | 1236.7 | 1288.6 |
| 2002 | 2003 | 2004 | 2005 | 2006 | 2007 | 2008 | 2009 | 2010 | 2011 | ||
| road ransport | ktoe | 1261 | 1277.8 | 1332.3 | 1418.5 | 1496.2 | 1690.9 | 1988.4 | 1716.7 | 1738.5 | 1866.2 |
| rail transport | ktoe | 26.5 | 26.8 | 27.7 | 28.3 | 28.4 | 28.4 | 28.4 | 24.8 | 26.3 | 25.7 |
| domestic air transport | ktoe | 1 | 1 | 1 | 1 | 1 | 1 | 1 | 1 | 1 | 1 |
| international air transport | ktoe | 29.1 | 26 | 19.8 | 22.9 | 25 | 32.2 | 35.4 | 27 | 26 | 23.9 |
| other | ktoe | 0.5 | 0.8 | 0.9 | 0.9 | 0.9 | 0.6 | 0.7 | 0.8 | 0.8 | 0.6 |
| total | ktoe | 1318.2 | 1332.4 | 1381.7 | 1471.6 | 1551.4 | 1753.1 | 2053.8 | 1770.4 | 1792.6 | 1917.5 |
Statistical Office of the Republic of Slovenia, Jožef Stefan Institute, 2013.
| 1992 | 1993 | 1994 | 1995 | 1996 | 1997 | 1998 | 1999 | 2000 | 2001 | ||
|---|---|---|---|---|---|---|---|---|---|---|---|
| electric power | ktoe | 13 | 13 | 13 | 15 | 14 | 14 | 14 | 14 | 23 | 22 |
| biodiesel | ktoe | 0 | 0 | 0 | 0 | 0 | 0 | 0 | 0 | 0 | 0 |
| diesel fuel | ktoe | 253 | 316 | 358 | 430 | 496 | 573 | 438 | 395 | 348 | 406 |
| kerosene | ktoe | 11 | 17 | 18 | 20 | 18 | 19 | 19 | 21 | 25 | 27 |
| aviation spirit | ktoe | 0 | 1 | 1 | 1 | 1 | 1 | 1 | 1 | 1 | 1 |
| bioethanol | ktoe | 0 | 0 | 0 | 0 | 0 | 0 | 0 | 0 | 0 | 0 |
| motor gasoline | ktoe | 607 | 722 | 801 | 860 | 967 | 956 | 836 | 811 | 840 | 833 |
| liquefied petroleum gas | ktoe | 0 | 0 | 0 | 0 | 0 | 0 | 0 | 0 | 0 | 0 |
| 2002 | 2003 | 2004 | 2005 | 2006 | 2007 | 2008 | 2009 | 2010 | 2011 | ||
| electric power | ktoe | 15 | 15 | 16 | 17 | 17 | 17 | 17 | 13 | 15 | 14 |
| biodiesel | ktoe | 0 | 0 | 0 | 0 | 2 | 13 | 22 | 28 | 42 | 31 |
| diesel fuel | ktoe | 475 | 511 | 651 | 749 | 840 | 1043 | 1300 | 1076 | 1111 | 1246 |
| kerosene | ktoe | 29 | 26 | 20 | 23 | 25 | 32 | 35 | 27 | 26 | 24 |
| aviation spirit | ktoe | 1 | 1 | 1 | 1 | 1 | 1 | 1 | 1 | 1 | 1 |
| bioethanol | ktoe | 0 | 0 | 0 | 0 | 0 | 1 | 3 | 2 | 3 | 4 |
| motor gasoline | ktoe | 798 | 779 | 693 | 682 | 665 | 644 | 673 | 618 | 589 | 591 |
| liquefied petroleum gas | ktoe | 0 | 0 | 0 | 0 | 1 | 2 | 2 | 4 | 5 | 7 |
Goals
Slovenia has no direct goal related to energy consumption in transport. An indirect goal can be identified within the target of 54–67% reduction in greenhouse gas emissions compared to base year levels (Kyoto Protocol).
- A 4% increase in GHG emissions from sources not included in the EU-ETS by 2020 compared to 2050 (Decision No 406/2009/EC of the European Parliament and of the Council of 23 April 2009 on the effort of Member States to reduce their greenhouse gas emissions to meet the Community’s greenhouse gas emission reduction commitments up to 2020);
- A 9% saving of final energy by 2016 (Directive 2006/32/EC of the European Parliament and of the Council of 5 April 2006 on energy end-use efficiency and energy services);
- To reach a 25% share of renewable energy sources in gross final energy consumption (Directive 2009/28/EC of the European Parliament and of the Council of 23 April 2009 on the promotion of the use of energy from renewable sources).
Comment
Energy consumption in transport amounted to 1,953 ktoe in 2012. It increased by 2% compared to the preceding year, by 59% compared to 2000 and by 120% compared to 1992. It was 6% below consumption in 2008, when the maximum within the monitoring period was reached. By far the largest quantity of energy was consumed in road transport, which represented more than 97% of total consumption in 2012. The share of international air transport was 1.2%, rail transport 1.3% and domestic air transport 0.05%. Among fuels, diesel prevailed in 2011 with 65%, followed by motor gasoline with 30.8%. Other fuels included biodiesel with 1.6%, kerosene with 1.2%, electricity with 0.7%, liquefied gas with 0.3%, biomethanol with 0.2% and aviation gasoline with 0.05%.
In 2011, transport represented 40% of final energy consumption, which was equal to the share in 2008. The share was 10% higher compared to 2005.
Energy consumption in transport is closely related with the volume of transport which, in turn, is still closely linked to economic growth. Reduction of the negative impacts of fossil fuel consumption in transport is among the goals stated in many European and Slovenian documents. It can be achieved by reducing transport demand, increasing energy efficiency of vehicles or increasing the share of alternative or more sustainable energy sources (biofuels in particular) and modes of transport (public transport, cycling, etc.).
So far, increased transport demand and an increasing share of road and air transport, combined with heavier and stronger cars and trucks have offset the technological improvements in energy efficiency of engines, which were smaller than planned. For this reason, in December 2008, the EU adopted the Regulation (EC) of the European Parliament and of the Council, setting emission performance standards for new passenger cars as part of the Community's integrated approach to reduce CO2 emissions from light-duty cargo vehicles. The regulation stipulates that average emissions of new vehicles after 2015 will not be allowed to exceed 130 g CO2/km, while an additional reduction in emissions by 10 g CO2/km will be achieved through the improvement of tires and the use of biofuels.
Nevertheless, it remains unclear when these technological improvements will make up for the growth in road transport (EEA, 2006). In Slovenia, the implementation of measures that will influence a change in behaviour in transport is extremely weak: the number of passenger kilometres in public transport is still decreasing, rail transport is limited by its infrastructure, in the past, investments have only been made in road infrastructure, etc.
In the EU-27, the share of road transport in transport energy consumption in 2011 amounted to 82%, air transport 14%, rail transport 2%, and domestic maritime transport 2%. In terms of total final energy consumption, transport represented 33.0%.
The orientation of transport policy towards sustainable energy use is indicated in the Resolution on Transport Policy, while specific measures are included in the draft second Energy Efficiency Action Plan for the period 2011–2016. The main problem in Slovenia remains the implementation of measures in the field of transport.


