[PR18] Exposure to traffic noise
[PR18] Exposure to traffic noise

Key message

The main source of environmental (ambient) noise is transport. Road traffic is the most widespread source. Percentage of the population exposed to different noise levels is high. People in urban areas are exposed to the highest levels of noise, because of concentration of population and traffic in the cities. Most worrying is a significant increase in noise at night, because people are most sensitive to noise at that time.
Charts
Figure PR18-1: Number of people exposed to noise above Lden and Lnight near major roads and railways in Slovenia in 2006
Sources:
Epi Spektrum, d.o.o., 2007; PNZ, d.o.o., 2007
| Ldvn | Lnoc | ||
|---|---|---|---|
| major roads | no. of inhabitants | 136343 | 85781 |
| major railways | no. of inhabitants | 10051 | 8691 |
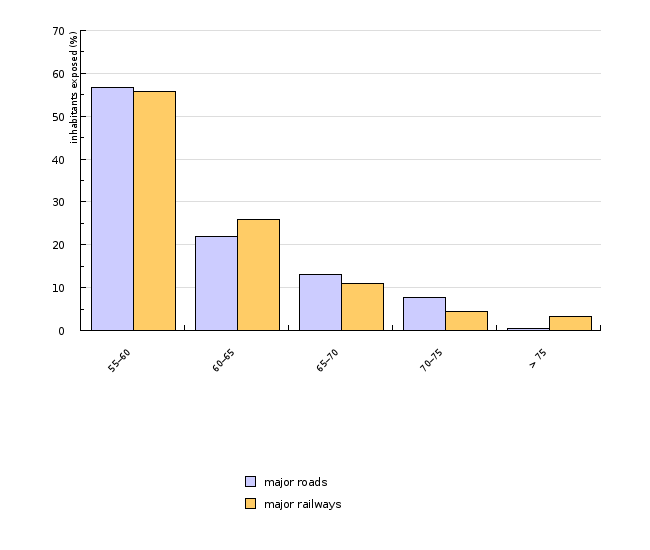
Figure PR18-2: Share of people exposed to noise above Lden near major roads and railways in Slovenia in 2006
Sources:
Epi Spektrum, d.o.o., 2007; PNZ, d.o.o., 2007
| 55–60 | 60–65 | 65–70 | 70–75 | > 75 | ||
|---|---|---|---|---|---|---|
| major roads | no. of inhabitants | 77425 | 29930 | 17923 | 10379 | 686 |
| major railways | no. of inhabitants | 5594 | 2593 | 1112 | 435 | 317 |
| major roads | % | 56.79 | 21.95 | 13.15 | 7.61 | 0.5 |
| major railways | % | 55.66 | 25.8 | 11.06 | 4.33 | 3.15 |
Figure PR18-3: Share of people exposed to noise above Lnight near major roads and railways in Slovenia in 2006
Sources:
Epi Spektrum, d.o.o., 2007; PNZ, d.o.o., 2007
| 50–55 | 55–60 | 60–65 | 65–70 | 70–75 | > 75 | ||
|---|---|---|---|---|---|---|---|
| major roads | no. of inhabitants | 48559 | 22383 | 13114 | 1704 | 21 | 0 |
| major railways | no. of inhabitants | 4665 | 2419 | 955 | 359 | 293 | 0 |
| major roads | % | 57 | 26 | 15 | 2 | 0 | 0 |
| major railways | % | 54 | 28 | 11 | 4 | 3 | 0 |
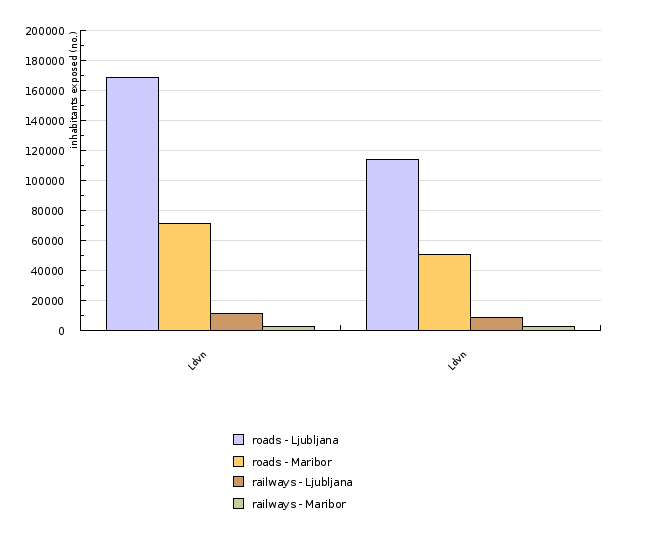
Figure PR18-4: Number of people exposed to noise above Lden and Lnight near roads and railways in Municipality of Ljubljana and Maribor in 2006
Sources:
A-projekt Nataša Kepe-Globevnik, s.p., 2008; Epi Spektrum, d.o.o., 2009
| Ldvn | Ldvn | ||
|---|---|---|---|
| roads - Ljubljana | no. of inhabitants | 168696 | 113945 |
| roads - Maribor | no. of inhabitants | 71406 | 50584 |
| railways - Ljubljana | no. of inhabitants | 11326 | 8832 |
| railways - Maribor | no. of inhabitants | 2704 | 2392 |
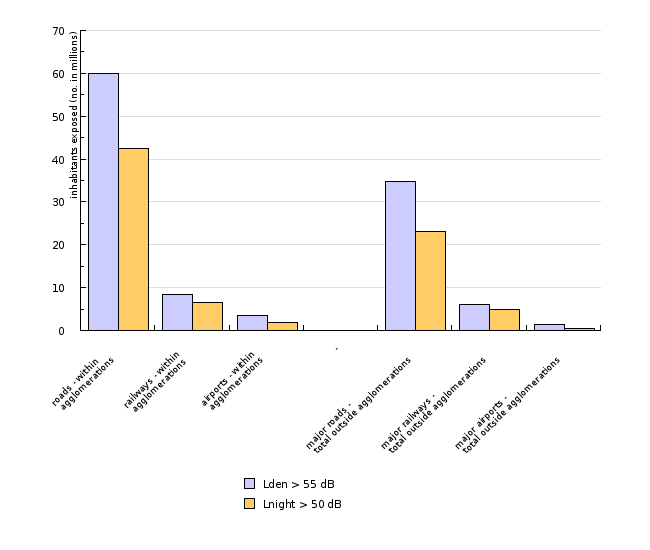
Figure PR18-5: Number of people exposed to noise above Lden and Lnight near roads, railways and airports within agglomerations and near major roads, railways and airports total outside agglomerations in EU-27, Norway and Switzerland in 2007
Sources:
EEA, Number of people exposed to noise in Europe, 2011
| roads - within agglomerations |
railways - within agglomerations |
airports - within agglomerations |
- | major roads - total outside agglomerations |
major railways - total outside agglomerations |
major airports - total outside agglomerations |
||
|---|---|---|---|---|---|---|---|---|
| Lden > 55 dB | no. of inhabitants (million) | 60.05 | 8.4 | 3.6 | 34.78 | 6.16 | 1.37 | |
| Lnight > 50 dB | no. of inhabitants (million) | 42.4 | 6.64 | 1.91 | 23.21 | 4.97 | 0.43 |
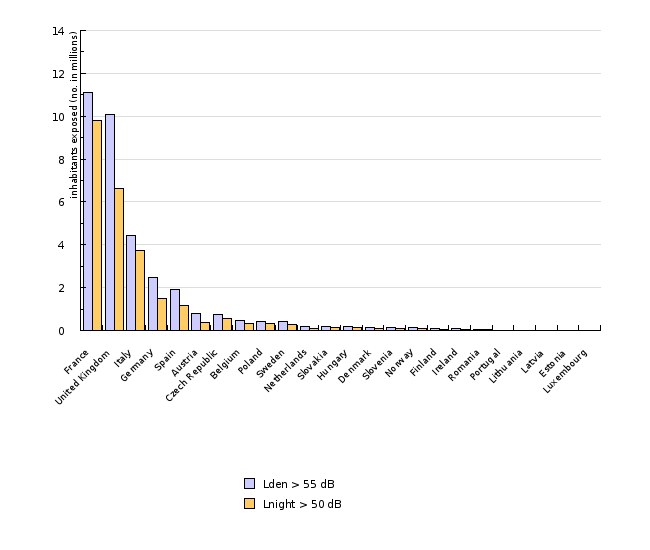
Figure PR18-6: Number of people exposed to noise above Lden and Lnight near major roads, railways and airports total outside agglomerations in some EU-27 countries in 2007
Sources:
EEA, Number of people exposed to noise in Europe, 2011
| France | United Kingdom | Italy | Germany | Spain | Austria | Czech Republic | Belgium | Poland | Sweden | ||
|---|---|---|---|---|---|---|---|---|---|---|---|
| Lden > 55 dB | no. of inhabitants (million) | 11.0992 | 10.087 | 4.4394 | 2.4855 | 1.8908 | 0.7785 | 0.7548 | 0.4872 | 0.4367 | 0.4214 |
| Lnight > 50 dB | no. of inhabitants (million) | 9.801 | 6.6049 | 3.7452 | 1.4791 | 1.182 | 0.3941 | 0.558 | 0.3353 | 0.3357 | 0.2905 |
| Netherlands | Slovakia | Hungary | Denmark | Slovenia | Norway | Finland | Ireland | Romania | Portugal | ||
| Lden > 55 dB | no. of inhabitants (million) | 0.1874 | 0.1844 | 0.1722 | 0.1603 | 0.1363 | 0.1316 | 0.102 | 0.0976 | 0.0668 | 0.0135 |
| Lnight > 50 dB | no. of inhabitants (million) | 0.0831 | 0.1396 | 0.1243 | 0.1141 | 0.0858 | 0.0887 | 0.0394 | 0.024 | 0.042 | 0.0069 |
| Lithuania | Latvia | Estonia | Luxembourg | ||||||||
| Lden > 55 dB | no. of inhabitants (million) | 0.0076 | 0.0015 | 0.0002 | 0.0001 | ||||||
| Lnight > 50 dB | no. of inhabitants (million) | 0.004 | 0.0005 | 0.0001 | 0 |


