[ZD20] Heat waves and daily number of deaths

Key message

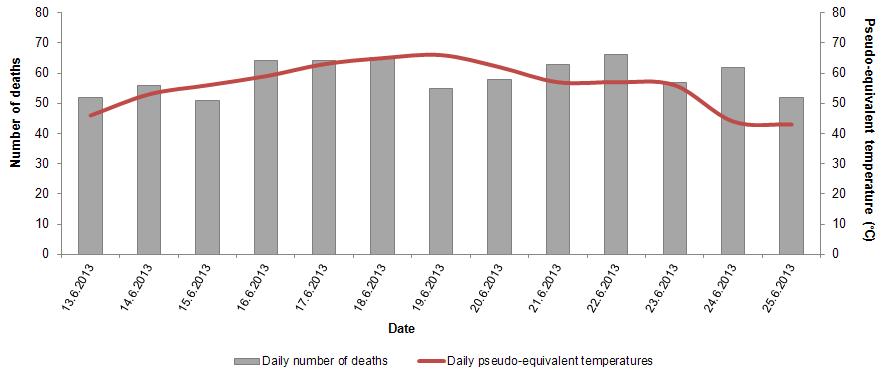
The daily number of deaths tends to increase during heat waves. Mortality during heat waves is greatest among the elderly and people with pre-existing chronic illnesses. Three heat waves occurred in 2013. The number of deaths increased during the heat waves, which can partially be contributed to high temperatures. In 2013, the average number of deaths during heat waves was 52 per day, while the regular average was 48 deaths per day.
Definition
This indicator monitored the daily number of deaths during heat waves in 2013 in the total population (all diagnoses of the International classification of diseases and related health problems for statistical purposes, ICD-10) in Slovenia.
Pseudo-equivalent temperature is an index indicating the combined effect of temperature and absolute air humidity. It is defined as the sum of air temperature and 1.5 multiplied by the partial pressure of water vapour.
Charts
NIJZ, ARSO
| 13.6.2013 | 14.6.2013 | 15.6.2013 | 16.6.2013 | 17.6.2013 | 18.6.2013 | 19.6.2013 | 20.6.2013 | 21.6.2013 | 22.6.2013 | ||
|---|---|---|---|---|---|---|---|---|---|---|---|
| Daily number of deaths | number of deaths | 52 | 56 | 51 | 64 | 64 | 65 | 55 | 58 | 63 | 66 |
| Daily pseudo-equivalent temperatures | °C | 46 | 53 | 56 | 59 | 63 | 65 | 66 | 62 | 57 | 57 |
| 23.6.2013 | 24.6.2013 | 25.6.2013 | |||||||||
| Daily number of deaths | number of deaths | 57 | 62 | 52 | |||||||
| Daily pseudo-equivalent temperatures | °C | 56 | 44 | 43 |
NIJZ, ARSO
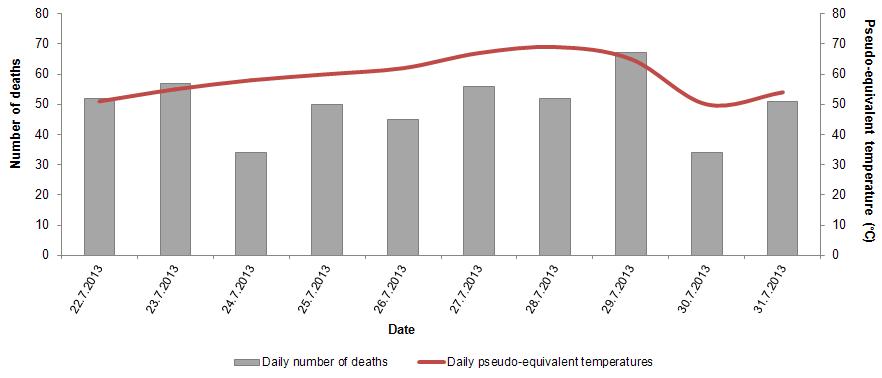
| 22.7.2013 | 23.7.2013 | 24.7.2013 | 25.7.2013 | 26.7.2013 | 27.7.2013 | 28.7.2013 | 29.7.2013 | 30.7.2013 | 31.7.2013 | ||
|---|---|---|---|---|---|---|---|---|---|---|---|
| Daily number of deaths | number of deaths | 52 | 57 | 34 | 50 | 45 | 56 | 52 | 67 | 34 | 51 |
| Daily pseudo-equivalent temperatures | °C | 51 | 55 | 58 | 60 | 62 | 67 | 69 | 65 | 50 | 54 |
NIJZ, ARSO
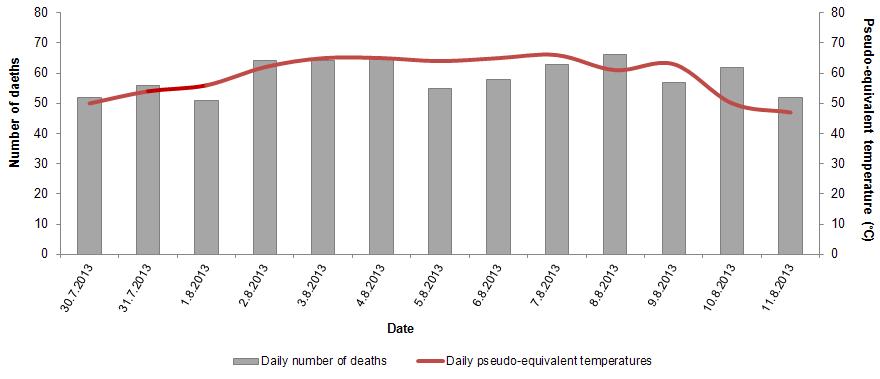
| 30.7.2013 | 31.7.2013 | 1.8.2013 | 2.8.2013 | 3.8.2013 | 4.8.2013 | 5.8.2013 | 6.8.2013 | 7.8.2013 | 8.8.2013 | ||
|---|---|---|---|---|---|---|---|---|---|---|---|
| Daily number of deaths | number of deaths | 34 | 51 | 50 | 52 | 51 | 40 | 47 | 61 | 56 | 56 |
| Daily pseudo-equivalent temperatures | °C | 50 | 54 | 56 | 62 | 65 | 65 | 64 | 65 | 66 | 61 |
| 9.8.2013 | 10.8.2013 | 11.8.2013 | |||||||||
| Daily number of deaths | number of deaths | 39 | 53 | 46 | |||||||
| Daily pseudo-equivalent temperatures | °C | 63 | 50 | 47 |
Goals
- monitoring the effect of heat waves, and
- providing information to the general and professional public, advocacy and calling upon various sectors to participate (in preparing and connecting various plans for the protection of public health).
Comment
A heat wave is not uniformly defined (WHO, 2009). For the purposes of this indicator, a heat wave is considered to be a period of 2 or more days when equivalent air temperature exceeds the value of 56°C. This is the value when the negative impact of humidity on a healthy organism begins to be felt in humans; in people with impaired health, the impact is felt earlier (Vida M., 1990). Pseudo-equivalent temperature shows the impact of temperature and air humidity.
In 2013, three heat waves were recorded: 15–23 June, 24–29 July and 1–9 August. Heat waves affect all those exposed (Matthies F. et al, 2008), while certain groups are particularly affected. The factors that increase their vulnerability are presented as risk factors. Heat illness risk factors and risk factors for the increased number of deaths due to exposure to heat include:
- age (the elderly and children are more vulnerable),
- health condition: patients suffering from illnesses that affect body heat regulation, mobility and judgment ability are more vulnerable (e.g. patients suffering from cardiovascular diseases, respiratory diseases, diabetes, kidney diseases, mental disorders, immobile patients, etc.; also, certain drugs tend to affect body temperature regulation),
- socio-economic status (low socio-economic status, homelessness, social isolation, limited access to health institutions),
- environmental factors: air pollution and poor living conditions (attic dwellings, poorly aerated dwellings or cramped conditions, lack of air conditioning), working outdoors and living in cities (Matthies F. et al, 2008 in WHO, 2011).
Some cities exhibit a heat island effect – temperatures recorded in cities are higher than those in their surrounding areas (EPA, 2014).
A higher mortality rate was recorded during heat waves that lasted longer and were more intense. Also, the mortality rate was higher during the first among successive heat waves (D'Ippoliti D. et al, 2010; Kovats S. et al, 2008; Matthies F. et al., 2008 in Anderson B., Bell M., 2011).
In Slovenia, the number of deaths increased during heat waves in 2013, which can partially be attributed to heat exposure. In 2013, the average number of deaths during heat waves was 52/day, while outside heat wave days, the average mortality rate was 48 deaths/day. Between 1 May and 30 September in the period 2008–2013, there was a positive and statistically significant temporal association between the daily number of deaths and heat waves (which means that the number of deaths during heat waves increased by 1 if a pseudo-equivalent temperature raised by 1°C).
In 2003, 81 more people died during heat waves in Slovenia than would be expected over the same period. This means an almost 13 per cent mortality rate increase during the observation period (Tomšič S., Šelb J., Omerzu M., 2008). For a more accurate assessment of the effects of heat waves on the population, humidity was also taken into account during the monitoring.
Mortality rate studies conducted in nine European countries showed a 7.6%–33.6% mortality increase during heat waves in 9 European cities (D'Ippoliti D. et al, 2010). The greatest increase (60%) was recorded in France in 2003 (Kovats S., Jendritzky G., 2008). Mortality rates were higher in people additionally exposed to ozone and/or particulates in the outdoor air (Analitis A. et al, 2014). According to projections, the mortality rate, combined with heat exposure, will continue to increase (Smith K. R., 2014).
The detrimental effects of heat waves can largely be prevented. Prevention requires cross-sectorial cooperation, warnings by the ministry of the environment, warnings and preparedness of the health care sector as well as improvement of dwelling conditions and urban planning (WHO, 2011).


