[EN24] The share of renewables in final energy consumption

Key message

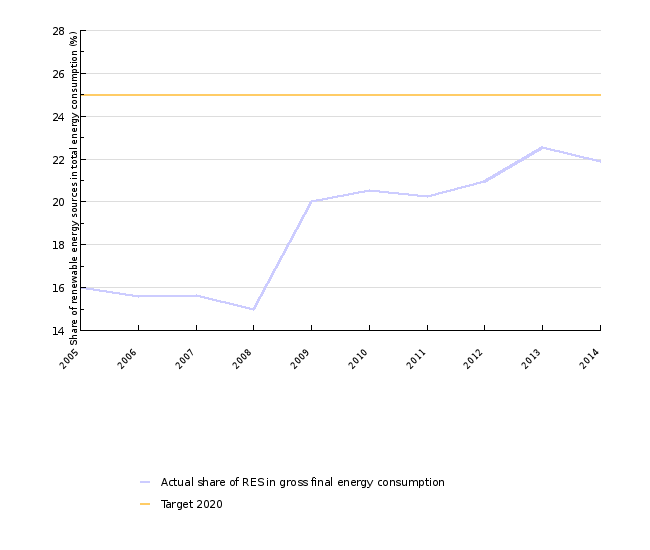
In 2013, a rapid increase in the share of renewables in final gross energy consumption occurred. An increase in the share of renewables in all three sectors – electric energy, heating and cooling and transport – contributed to the increase. In 2014, a decrease in the use of renewable sources in the heating and cooling sector occurred due to an exceptionally warm winter. The use of renewable sources was also reduced in transport in that year. As a consequence, the RES share decreased despite the reduction in final energy consumption. In 2013, the share of renewables in final gross energy consumption was 22.5%, while in 2014, it dropped to 21.9%, which is 3 percentage points below the target for 2020.
Definition
This indicator shows the use of renewable energy sources, including the use of solar energy, biomass (wood, biogas, biofuels) and waste energy, geothermal energy, hydro energy and wind energy in gross final energy consumption.
Gross final energy consumption is an energy product supplied to industry, transport, households, the service sector (including public services), agriculture, forestry and fishery for energy consumption, as well as electricity and heat used by the energy sector for electricity and heat generation and losses of electricity and heat in distribution and transmission.
Charts
Jožef Stefan Institute, 2015, Statistical Office of RS, 2015
| 2005 | 2006 | 2007 | 2008 | 2009 | 2010 | 2011 | 2012 | 2013 | 2014 | ||
|---|---|---|---|---|---|---|---|---|---|---|---|
| Actual share of RES in gross final energy consumption | [%] | 16 | 16 | 16 | 15 | 20 | 21 | 20 | 21 | 23 | 22 |
| Target 2020 | [%] | 25 | 25 | 25 | 25 | 25 | 25 | 25 | 25 | 25 | 25 |
Jožef Stefan Institute, 2015; Statistical office of the RS, 2015
| 2005 | 2006 | 2007 | 2008 | 2009 | 2010 | 2011 | 2012 | 2013 | 2014 | ||
|---|---|---|---|---|---|---|---|---|---|---|---|
| Gross final energy consumption | index [2005 = 100] | 100 | 101 | 100 | 108 | 99 | 103 | 103 | 101 | 98 | 95 |
| Consumption of energy from renewable sources | index [2005 = 100] | 100 | 99 | 98 | 101 | 124 | 133 | 130 | 132 | 139 | 129 |
Jožef Stefan Institute, 2015, Statistical office of the RS, 2015
| 2005 | 2006 | 2007 | 2008 | 2009 | 2010 | 2011 | 2012 | 2013 | 2014 | ||
|---|---|---|---|---|---|---|---|---|---|---|---|
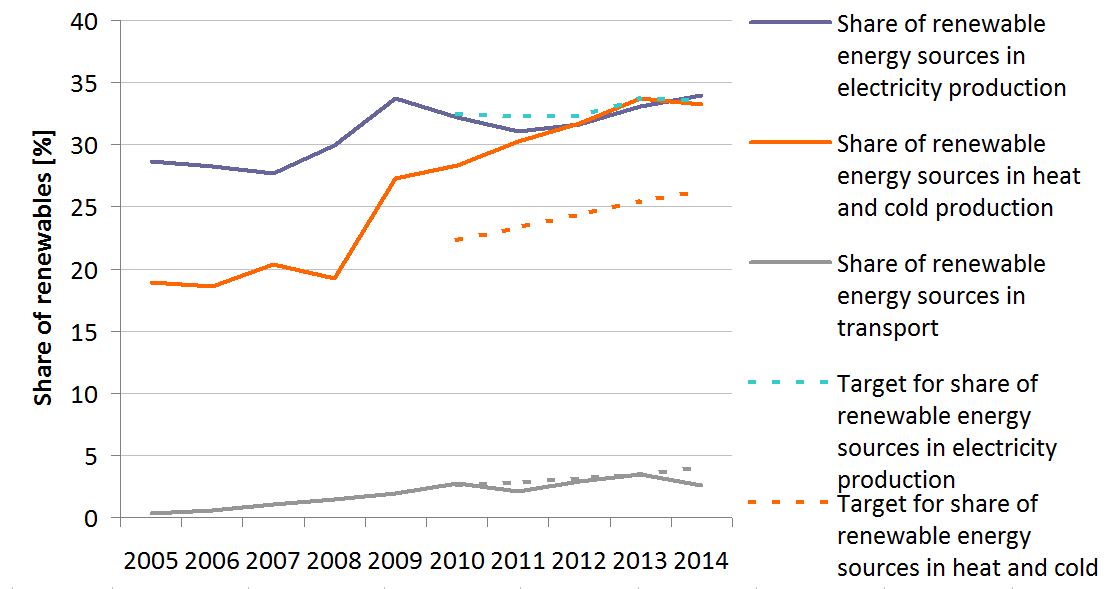
| Share of renewable energy sources in electricity production | % | 29 | 28 | 28 | 30 | 34 | 32 | 31 | 32 | 33 | 34 |
| Share of renewable energy sources in heat and cold production | % | 19 | 19 | 20 | 19 | 27 | 28 | 30 | 32 | 34 | 33 |
| Share of renewable energy sources in transport | % | 0 | 1 | 1 | 1 | 2 | 3 | 2 | 3 | 3 | 3 |
| Target for share of renewable energy sources in electricity production | % | 32 | 32 | 32 | 34 | 34 | |||||
| Target for share of renewable energy sources in heat and cold production | % | 22 | 23 | 24 | 25 | 26 | |||||
| Target for share of renewable energy sources in transport | % | 3 | 3 | 3 | 4 | 4 |
Goals
- a 25% share of renewable energy sources in gross final energy consumption by 2020;
- a 10% share of renewable energy in all modes of transport by 2020.
The above goals are legally binding pursuant to Directive 2009/28/EC. In the National Renewable Energy Action Plan for the period 2010–2020, indicative target shares of RES in gross final heat consumption (30.8%) and gross final electricity consumption (39.3%) are set for 2020.
Comment
In 2014, the share of RES in gross final energy consumption was 21.9%. Compared to the preceding year, it was 0.6 percentage points lower, while compared to 2005 it was 5.9 percentage points higher. Slovenia was 3.1 percentage points short of the goal, which means that the share would have to increase a little over 0.5 percentage points annually over the next six years in order for the goal to be achieved by 2020.
In 2009, the share of RES in gross final energy consumption increased markedly. Two factors contributed to this increase. The first is the decrease of gross final energy consumption as a consequence of economic crisis and less favourable prices of motor fuels compared to the neighbouring countries (for more information see indicator RN10 Final energy consumption by sector). The other was the increase in the use of renewable energy sources as a result of methodological improvement of statistical monitoring of the consumption of fuels in households and the increase of installed capacity of hydroelectric power plants (for more information see indicators EN18 Renewable energy sources and EN19 Electricity production from renewable energy sources). In 2010 and 2011, the share hardly changed, while in 2012 and, particularly, 2013, it increased. Trends of the indicator depend on trends in the consumption of renewable energy sources (numerator) and gross final energy consumption (denominator). After the decrease in 2009, gross final energy consumption increased in 2010, then decreased constantly in the period 2011–2014. In 2014, it amounted to 4,807 ktoe, which was 3.8% less than in the preceding year and 5.3% less than in 2005. The consumption of RES has been increasing since 2009, except in 2011 and 2014. In 2014, it was 29.4% higher compared to 2005. In 2014, the consumption of RES decreased by 6.5%.
Gross final energy consumption is composed of final consumption in the industry, transport, household and “other use” sectors, which is presented similarly under indicator EN10 Final energy consumption by sector, and proper consumption by power plants, consumption by the energy sector and losses in heat and electricity transmission. Final energy consumption contributes 96% to gross consumption.
In 2014, the largest amount of RES was used for heat and cold generation (590 ktoe or 56%) and electricity generation (421 ktoe or 40%). Transport contributed only 42 ktoe (4%). Compared to the preceding year, the use of RES decreased considerably (by 10%) in heating and cooling, due to an exceptionally warm winter, and in transport (by 27%), due to withdrawal of excise duty exemptions for biofuel blends. Electricity generation from RES increased by 2% in 2014 due to a slight increase in the normalisation factor for hydroelectric power plants (the year of 2014 was very favourable, hydrologically) and increased generation from other RES. The use of RES in electricity generation in hydroelectric power plants is normalised, by which the impact of river discharges on the annual fluctuation of electricity generation is reduced to a minimum. In normalisation, the capacity of hydroelectric power plants in an individual year is multiplied by average operating hours over the last 15-year period.
In 2014, energy consumption for heating and cooling (37%) and energy consumption in transport (37%) contributed the most to gross final energy consumption. Electricity consumption represented 26%. Compared to the preceding year, the share of heating and cooling decreased by 2 percentage points, while the share of transport and electricity increased by one percentage point each. The share of sectors in gross final energy consumption is important as the share of REC varies by sector. The share of REC in transport is much lower than the overall share, while the share in heat and cold as well as electricity generation is higher than the overall share. Consequently, the reduction in energy consumption for heating and cooling due to the implementation of energy efficiency measures, along with the increase in energy consumption in transport where sustainable transport policy is not being implemented would negatively affect the overall share of REC in final energy consumption. This was well demonstrated in 2014 when an exceptionally warm winter resulted in the reduced use of REC for heating and cooling and, consequently, a lower share of REC in overall energy consumption.
In 2014, the share of renewable energy in gross energy consumption for heating and cooling was 33.3%, which was 0.4 percentage points below the share in 2013. The decrease is largely a consequence of reduced energy consumption in households. In the years before 2014, the share was constantly increasing. The sectorial share was notably above the goal set in the National Renewable Energy Action Plan, which is a consequence of the fact that the use of wood in households was highly underestimated during the preparation of the National Renewable Energy Action Plan. Nevertheless, reaching the 2020 goal for overall share of RES is a highly demanding task. In 2014, the share of renewable energy in gross energy consumption was 33.9%, which was 0.8 percentage points below the share in 2013 and 6 percentage points below the 2020 target. The share increased due to an increase in the generation of electricity from RES and a decrease in gross electricity consumption (see indicator EN30 Production and consumption of electricity). The share of RES in transport was 2.6%, which was 0.9 percentage points less than in 2013. The reduction is a consequence of lower consumption of biofuels, which decreased more than consumption of other motor fuels. As regards the annual goals set in the National Renewable Energy Action Plan, Slovenia only lags behind other member states in the share of RES in transport. The 2020 goal for transport is set at 10%.
Under the Directive 2009/285/EC, Slovenia was obliged to draw up a Renewable Energy Action Plan in order to ensure the achievement of the set goal. The Government adopted the plan on 8 July 2010. The measures are incorporated into programmes to stimulate electricity production from RES, programmes that stimulate the use of RES in heating and cooling and support programmes to stimulate the use of RES in transport. In addition, there are also special measures to stimulate the use of wood biomass.
For 2030, the goal at the EU level was set at 27%, which is 7 percentage points above the goal set for 2020. The goals at the level of Member States will be set individually by country.


