[ZD04] Outbreaks of waterborne diseases (epidemics)

Key message

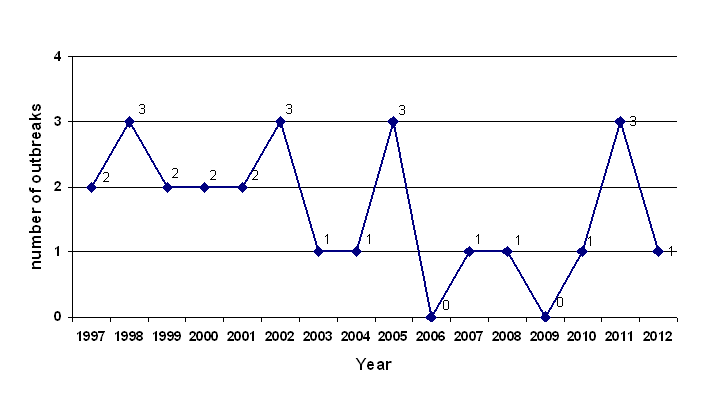
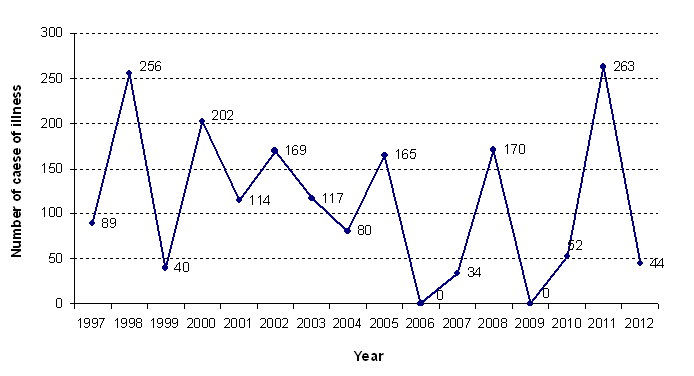
In Slovenia 0-3 waterborne outbreaks were notified annually in the period 1997-2012. There were from 34 to 263 reported cases in each outbreak. In most of the outbreaks the microbiological agent was unknown. Some outbreaks were caused by Cryptosporidium Parvum, Escherichia coli, Shigella sonnei, Lamblia intestinalis, rotavirus, adenovirus, astrovirus, kalicivirus, norovirus and hepatitis A virus.
Charts
National Institute of Public Health, 1998-2013.
| 1997 | 1998 | 1999 | 2000 | 2001 | 2002 | 2003 | 2004 | 2005 | 2006 | ||
|---|---|---|---|---|---|---|---|---|---|---|---|
| Celje | No. | 0 | 1 | 1 | 0 | 0 | 0 | 0 | 0 | 0 | 0 |
| Koper | No. | 0 | 0 | 0 | 0 | 0 | 0 | 0 | 0 | 0 | 0 |
| Kranj | No. | 0 | 1 | 0 | 1 | 1 | 1 | 0 | 0 | 0 | 0 |
| Ljubljana | No. | 0 | 0 | 0 | 1 | 1 | 0 | 1 | 0 | 0 | 0 |
| Maribor | No. | 1 | 0 | 0 | 0 | 0 | 0 | 0 | 0 | 2 | 0 |
| Murska Sobota | No. | 0 | 0 | 0 | 0 | 0 | 0 | 0 | 0 | 0 | 0 |
| Nova Gorica | No. | 0 | 0 | 0 | 0 | 0 | 0 | 0 | 0 | 0 | 0 |
| Novo mesto | No. | 1 | 1 | 1 | 0 | 0 | 1 | 0 | 0 | 1 | 0 |
| R/K | No. | 0 | 0 | 0 | 0 | 0 | 1 | 0 | 1 | 0 | 0 |
| Total | No. | 2 | 3 | 2 | 2 | 2 | 3 | 1 | 1 | 3 | 0 |
| 2007 | 2008 | 2009 | 2010 | 2011 | 2012 | ||||||
| Celje | No. | 0 | 0 | 0 | 0 | 0 | 0 | ||||
| Koper | No. | 0 | 1 | 0 | 0 | 0 | 0 | ||||
| Kranj | No. | 1 | 0 | 0 | 0 | 1 | 0 | ||||
| Ljubljana | No. | 0 | 0 | 0 | 1 | 1 | 1 | ||||
| Maribor | No. | 0 | 0 | 0 | 0 | 1 | 0 | ||||
| Murska Sobota | No. | 0 | 0 | 0 | 0 | 0 | 0 | ||||
| Nova Gorica | No. | 0 | 0 | 0 | 0 | 0 | 0 | ||||
| Novo mesto | No. | 0 | 0 | 0 | 0 | 0 | 0 | ||||
| R/K | No. | 0 | 0 | 0 | 0 | 0 | 0 | ||||
| Total | No. | 1 | 1 | 0 | 1 | 3 | 1 |
National Institute of Public Health, 1998-2013.
| 1997 | 1998 | 1999 | 2000 | 2001 | 2002 | 2003 | 2004 | 2005 | 2006 | ||
|---|---|---|---|---|---|---|---|---|---|---|---|
| Celje | No. | 0 | 110 | 10 | 0 | 0 | 0 | 0 | 0 | 0 | 0 |
| Koper | No. | 0 | 0 | 0 | 0 | 0 | 0 | 0 | 0 | 0 | 0 |
| Kranj | No. | 0 | 92 | 0 | 181 | 100 | 56 | 0 | 0 | 0 | 0 |
| Ljubljana | No. | 0 | 0 | 0 | 21 | 14 | 0 | 117 | 0 | 0 | 0 |
| Maribor | No. | 84 | 0 | 0 | 0 | 0 | 0 | 0 | 0 | 23 | 0 |
| Murska Sobota | No. | 0 | 0 | 0 | 0 | 0 | 0 | 0 | 0 | 0 | 0 |
| Nova Gorica | No. | 0 | 0 | 0 | 0 | 0 | 0 | 0 | 0 | 0 | 0 |
| Novo mesto | No. | 5 | 54 | 30 | 0 | 0 | 27 | 0 | 0 | 142 | 0 |
| Ravne na Kor. | No. | 0 | 0 | 0 | 0 | 0 | 86 | 0 | 80 | 0 | 0 |
| Total | No. | 89 | 256 | 40 | 202 | 114 | 169 | 117 | 80 | 165 | 0 |
| 2007 | 2008 | 2009 | 2010 | 2011 | 2012 | ||||||
| Celje | No. | 0 | 0 | 0 | 0 | 0 | 0 | ||||
| Koper | No. | 0 | 170 | 0 | 0 | 0 | 0 | ||||
| Kranj | No. | 34 | 0 | 0 | 0 | 91 | 0 | ||||
| Ljubljana | No. | 0 | 0 | 0 | 52 | 152 | 44 | ||||
| Maribor | No. | 0 | 0 | 0 | 0 | 20 | 0 | ||||
| Murska Sobota | No. | 0 | 0 | 0 | 0 | 0 | 0 | ||||
| Nova Gorica | No. | 0 | 0 | 0 | 0 | 0 | 0 | ||||
| Novo mesto | No. | 0 | 0 | 0 | 0 | 0 | 0 | ||||
| Ravne na Kor. | No. | 0 | 0 | 0 | 0 | 0 | 0 | ||||
| Total | No. | 34 | 170 | 0 | 52 | 263 | 44 |
National Institute of Public Health, 2007-2013.
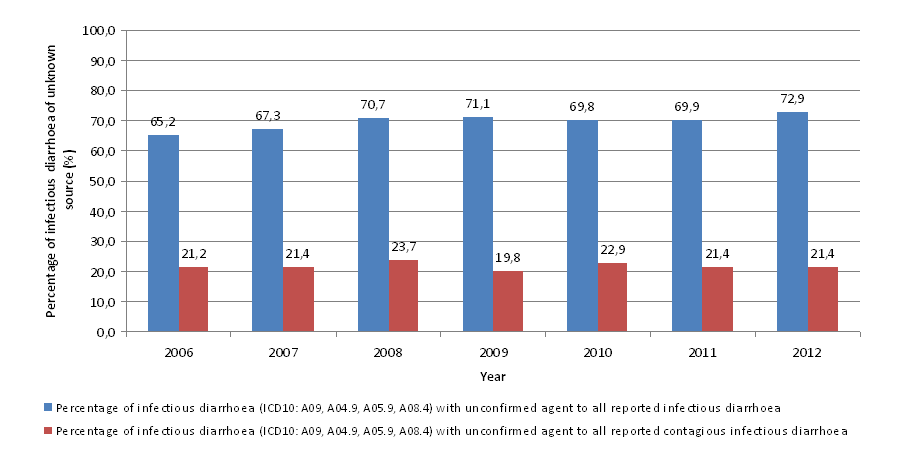
*Note to Figure ZD4-3: MKB10: A09-intestinal infection, undefined, A04.9-bowel bacterial infection, undefined, A05.9-bacterial food poisoning, undefined, A08.4-intestinal viral infection, undefined
| 2007 | 2008 | 2009 | 2010 | 2011 | 2012 | ||
|---|---|---|---|---|---|---|---|
| Percentage of infectious diarrhoea (ICD10: A09, A04.9, A05.9, A08.4) with unconfirmed agent to all reported infectious diarrhoea | % | 67.3 | 70.7 | 71.1 | 69.8 | 69.9 | 72.9 |
| Percentage of infectious diarrhoea (ICD10: A09, A04.9, A05.9, A08.4) with unconfirmed agent to all reported contagious infectious diarrhoea | % | 21.4 | 23.7 | 19.8 | 22.9 | 21.4 | 21.4 |
ENHIS, 2013.
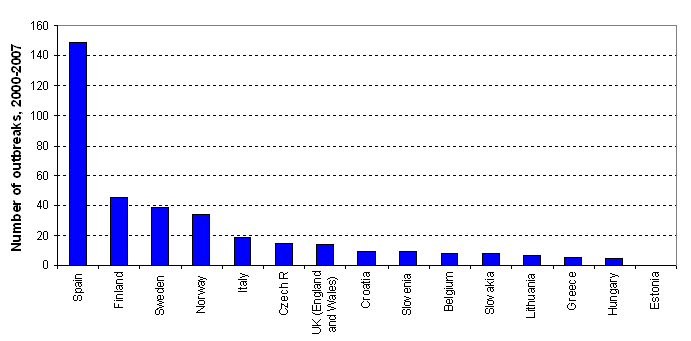
| Spain | Finland | Sweden | Norway | Italy | Czech R | UK (England and Wales) | Croatia | Slovenia | Belgium | ||
|---|---|---|---|---|---|---|---|---|---|---|---|
| 2000 | No. | 21 | 7 | 14 | 2 | 3 | 4 | 2 | 2 | 2 | 2 |
| 2001 | No. | 21 | 6 | 1 | 2 | 3 | 1 | 3 | 2 | 2 | |
| 2002 | No. | 27 | 4 | 9 | 1 | 3 | 3 | 7 | 1 | 1 | 2 |
| 2003 | No. | 10 | 10 | 3 | 2 | 3 | 2 | 1 | 2 | ||
| 2004 | No. | 25 | 5 | 5 | 3 | 2 | 1 | 2 | 1 | 0 | |
| 2005 | No. | 21 | 6 | 1 | 8 | 4 | 5 | 2 | 1 | 2 | |
| 2006 | No. | 14 | 4 | 3 | 4 | 1 | 0 | ||||
| 2007 | No. | 10 | 3 | 3 | 12 | 1 | |||||
| 2000-2007 | No. | 149 | 45 | 39 | 34 | 18 | 15 | 14 | 9 | 9 | 8 |
| Slovakia | Lithuania | Greece | Hungary | Estonia | |||||||
| 2000 | No. | 3 | 1 | ||||||||
| 2001 | No. | 3 | 1 | ||||||||
| 2002 | No. | 1 | |||||||||
| 2003 | No. | 2 | 1 | ||||||||
| 2004 | No. | 4 | 1 | ||||||||
| 2005 | No. | 1 | 1 | ||||||||
| 2006 | No. | 1 | 1 | ||||||||
| 2007 | No. | 1 | 1 | ||||||||
| 2000-2007 | No. | 8 | 6 | 5 | 4 | 0 |
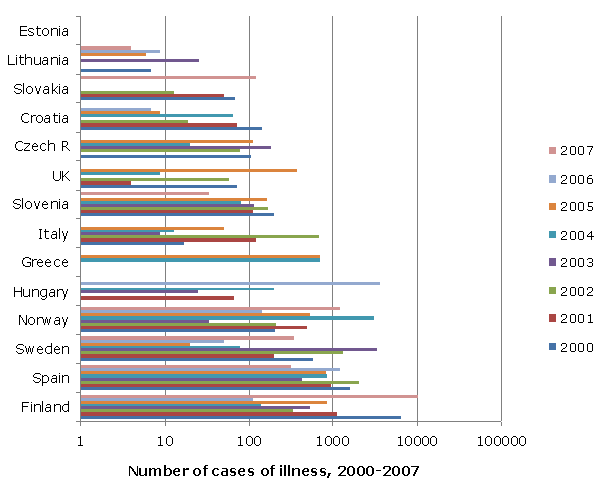
The European Environment and Health Information System (ENHIS),2013.
| Finland | Spain | Sweden | Norway | Hungary | Greece | Italy | Slovenia | UK | Czech R | ||
|---|---|---|---|---|---|---|---|---|---|---|---|
| 2000 | No. | 6428 | 1628 | 588 | 206 | 0 | 17 | 202 | 73 | 106 | |
| 2001 | No. | 1105 | 952 | 200 | 500 | 68 | 125 | 114 | 4 | 0 | |
| 2002 | No. | 340 | 2040 | 1336 | 215 | 0 | 674 | 169 | 59 | 77 | |
| 2003 | No. | 534 | 432 | 3319 | 34 | 25 | 9 | 117 | 0 | 187 | |
| 2004 | No. | 140 | 858 | 78 | 3015 | 203 | 690 | 13 | 80 | 9 | 20 |
| 2005 | No. | 863 | 835 | 20 | 535 | 0 | 702 | 51 | 165 | 372 | 115 |
| 2006 | No. | 114 | 1225 | 51 | 142 | 3668 | 0 | ||||
| 2007 | No. | 10114 | 324 | 349 | 1203 | 0 | 34 | ||||
| 2000-2007 | No. | 19638 | 8294 | 5941 | 5850 | 3964 | 1392 | 889 | 881 | 517 | 505 |
| Croatia | Slovakia | Lithuania | Estonia | ||||||||
| 2000 | No. | 144 | 70 | 7 | 0 | ||||||
| 2001 | No. | 73 | 50 | 0 | 0 | ||||||
| 2002 | No. | 19 | 13 | 0 | 0 | ||||||
| 2003 | No. | 0 | 0 | 26 | 0 | ||||||
| 2004 | No. | 65 | 0 | 0 | 0 | ||||||
| 2005 | No. | 9 | 0 | 6 | 0 | ||||||
| 2006 | No. | 7 | 0 | 9 | |||||||
| 2007 | No. | 0 | 125 | 4 | |||||||
| 2000-2007 | No. | 317 | 258 | 52 | 0 |


