Figure ZD32-1: Mesothelioma incidence, 1961-2016 Slovenia
Sources:
Institute of Oncology Ljubljana, Cancer Registry of the Republic of Slovenia, 2020
Show data
|
men and women, all stages, 0-80+ years[number] |
| 1961 |
1 |
| 1962 |
1 |
| 1963 |
0 |
| 1964 |
0 |
| 1965 |
0 |
| 1966 |
0 |
| 1967 |
2 |
| 1968 |
0 |
| 1969 |
1 |
| 1970 |
1 |
| 1971 |
0 |
| 1972 |
3 |
| 1973 |
5 |
| 1974 |
3 |
| 1975 |
1 |
| 1976 |
4 |
| 1977 |
7 |
| 1978 |
4 |
| 1979 |
3 |
| 1980 |
5 |
| 1981 |
3 |
| 1982 |
7 |
| 1983 |
8 |
| 1984 |
11 |
| 1985 |
8 |
| 1986 |
12 |
| 1987 |
9 |
| 1988 |
13 |
| 1989 |
11 |
| 1990 |
14 |
| 1991 |
10 |
| 1992 |
13 |
| 1993 |
13 |
| 1994 |
11 |
| 1995 |
16 |
| 1996 |
10 |
| 1997 |
18 |
| 1998 |
18 |
| 1999 |
27 |
| 2000 |
24 |
| 2001 |
27 |
| 2002 |
32 |
| 2003 |
32 |
| 2004 |
33 |
| 2005 |
24 |
| 2006 |
33 |
| 2007 |
28 |
| 2008 |
34 |
| 2009 |
30 |
| 2010 |
35 |
| 2011 |
39 |
| 2012 |
44 |
| 2013 |
42 |
| 2014 |
37 |
| 2015 |
40 |
| 2016 |
43 |
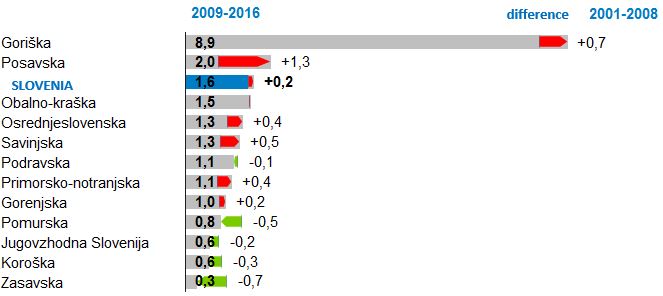
Figure ZD32-2: Age standardized incidence rate (per 100.000 inhabitants) for mesothelioma, statistical regions, 2000-2016
Show data
|
2015[number/100.000 inh.] |
2016[number/100.000 inh.] |
difference 2000-2016[number/100.000 inh.] |
| Pomurska |
0.70 |
0.60 |
-0.50 |
| Podravska |
1.70 |
1.50 |
-1.40 |
| Koroška |
0 |
1 |
1 |
| Savinjska |
1.90 |
3 |
2.20 |
| Zasavska |
0 |
0 |
0 |
| Posavska |
0.70 |
2.60 |
2.60 |
| Jugovzhodna Slovenija |
0 |
0 |
0 |
| Osrednjeslovenska |
1.20 |
1.40 |
-0.80 |
| Gorenjska |
0.40 |
0.40 |
-0.10 |
| Primorsko-notranjska |
2.10 |
0 |
0 |
| Goriška |
8 |
9.80 |
4.80 |
| Obalno-kraška |
1.40 |
0.60 |
-2.20 |
Figure ZD32-3: Mesothelioma Mortality, 1997-2016, Slovenia
Show data
|
men and women, 0-80+ years[absolute number] |
| 1997 |
8 |
| 1998 |
13 |
| 1999 |
21 |
| 2000 |
18 |
| 2001 |
12 |
| 2002 |
29 |
| 2003 |
29 |
| 2004 |
29 |
| 2005 |
15 |
| 2006 |
34 |
| 2007 |
33 |
| 2008 |
30 |
| 2009 |
28 |
| 2010 |
23 |
| 2011 |
37 |
| 2012 |
31 |
| 2013 |
36 |
| 2014 |
40 |
| 2015 |
28 |
| 2016 |
40 |
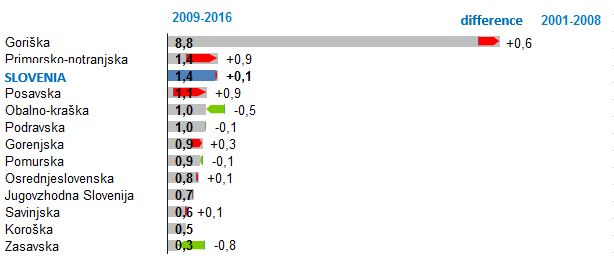
Figure ZD32-4: Age standardized mortality rate (number of deaths per 100.000 inhabitants) for Mesothelioma, statistical regions, 2000-2016, Slovenia
Sources:
Institute of Oncology Ljubljana, Cancer Registry of the Republic of Slovenia, 2020
Show data
|
2015[number/100.000 inhabitants] |
2016[number/100.000 inhabitants] |
razlika 2000-2016[number/100.000 inhabitants] |
| Pomurska |
0 |
0 |
-0.90 |
| Podravska |
0.70 |
1.50 |
0 |
| Koroška |
0 |
2.10 |
2.10 |
| Savinjska |
0.60 |
0.60 |
0.10 |
| Zasavska |
0 |
0 |
0 |
| Posavska |
0 |
2.50 |
-0.40 |
| Jugovzhodna Slovenija |
0 |
0.60 |
-0.10 |
| Osrednjeslovenska |
0.60 |
0.60 |
0.20 |
| Gorenjska |
0.90 |
0.80 |
0.30 |
| Primorsko-notranjska |
0 |
2.20 |
2.20 |
| Goriška |
10.10 |
11.30 |
7.80 |
| Obalno-kraška |
1.40 |
0.70 |
-0.40 |
Figure ZD32-5: Age standardized mortality rate (number of deaths per 100.000 inhabitants) for Mesothelioma, in EU, for the last available year in the country, from 2012 onwards
Show data
|
Age standardized Mortality rate[number/100.000 inh.] |
| Bulgaria |
0.05 |
| Lithuania |
0.20 |
| Hungary |
0.21 |
| Estonia |
0.22 |
| Romania |
0.24 |
| Slovakia |
0.31 |
| Latvia |
0.34 |
| Czech Republic |
0.34 |
| Portugal |
0.37 |
| Cyprus |
0.44 |
| Spain |
0.56 |
| Poland |
0.61 |
| Austria |
0.68 |
| Norway |
0.76 |
| Ireland |
0.81 |
| Finland |
0.87 |
| France |
0.91 |
| Germany |
0.93 |
| Sweden |
0.96 |
| Denmark |
1.21 |
| Croatia |
1.29 |
| Luxembourg |
1.36 |
| Belgium |
1.41 |
| Italy |
1.42 |
| Slovenia |
1.60 |
| Malta |
1.82 |
| Netherlands |
1.91 |
| United Kingdom |
2.49 |


