[VD12] Chemical and ecological status of surface water bodies

Key message

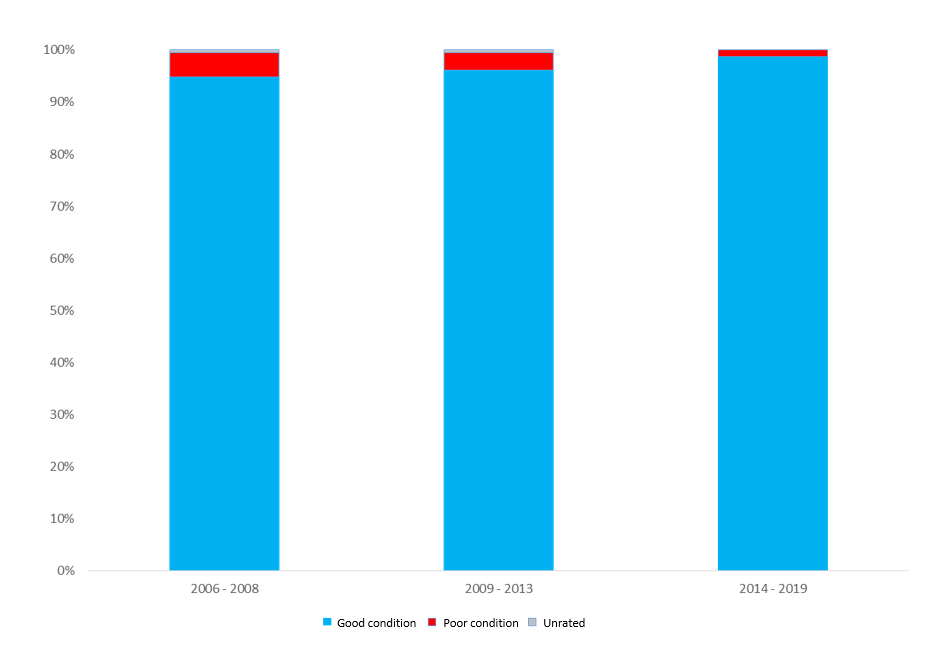
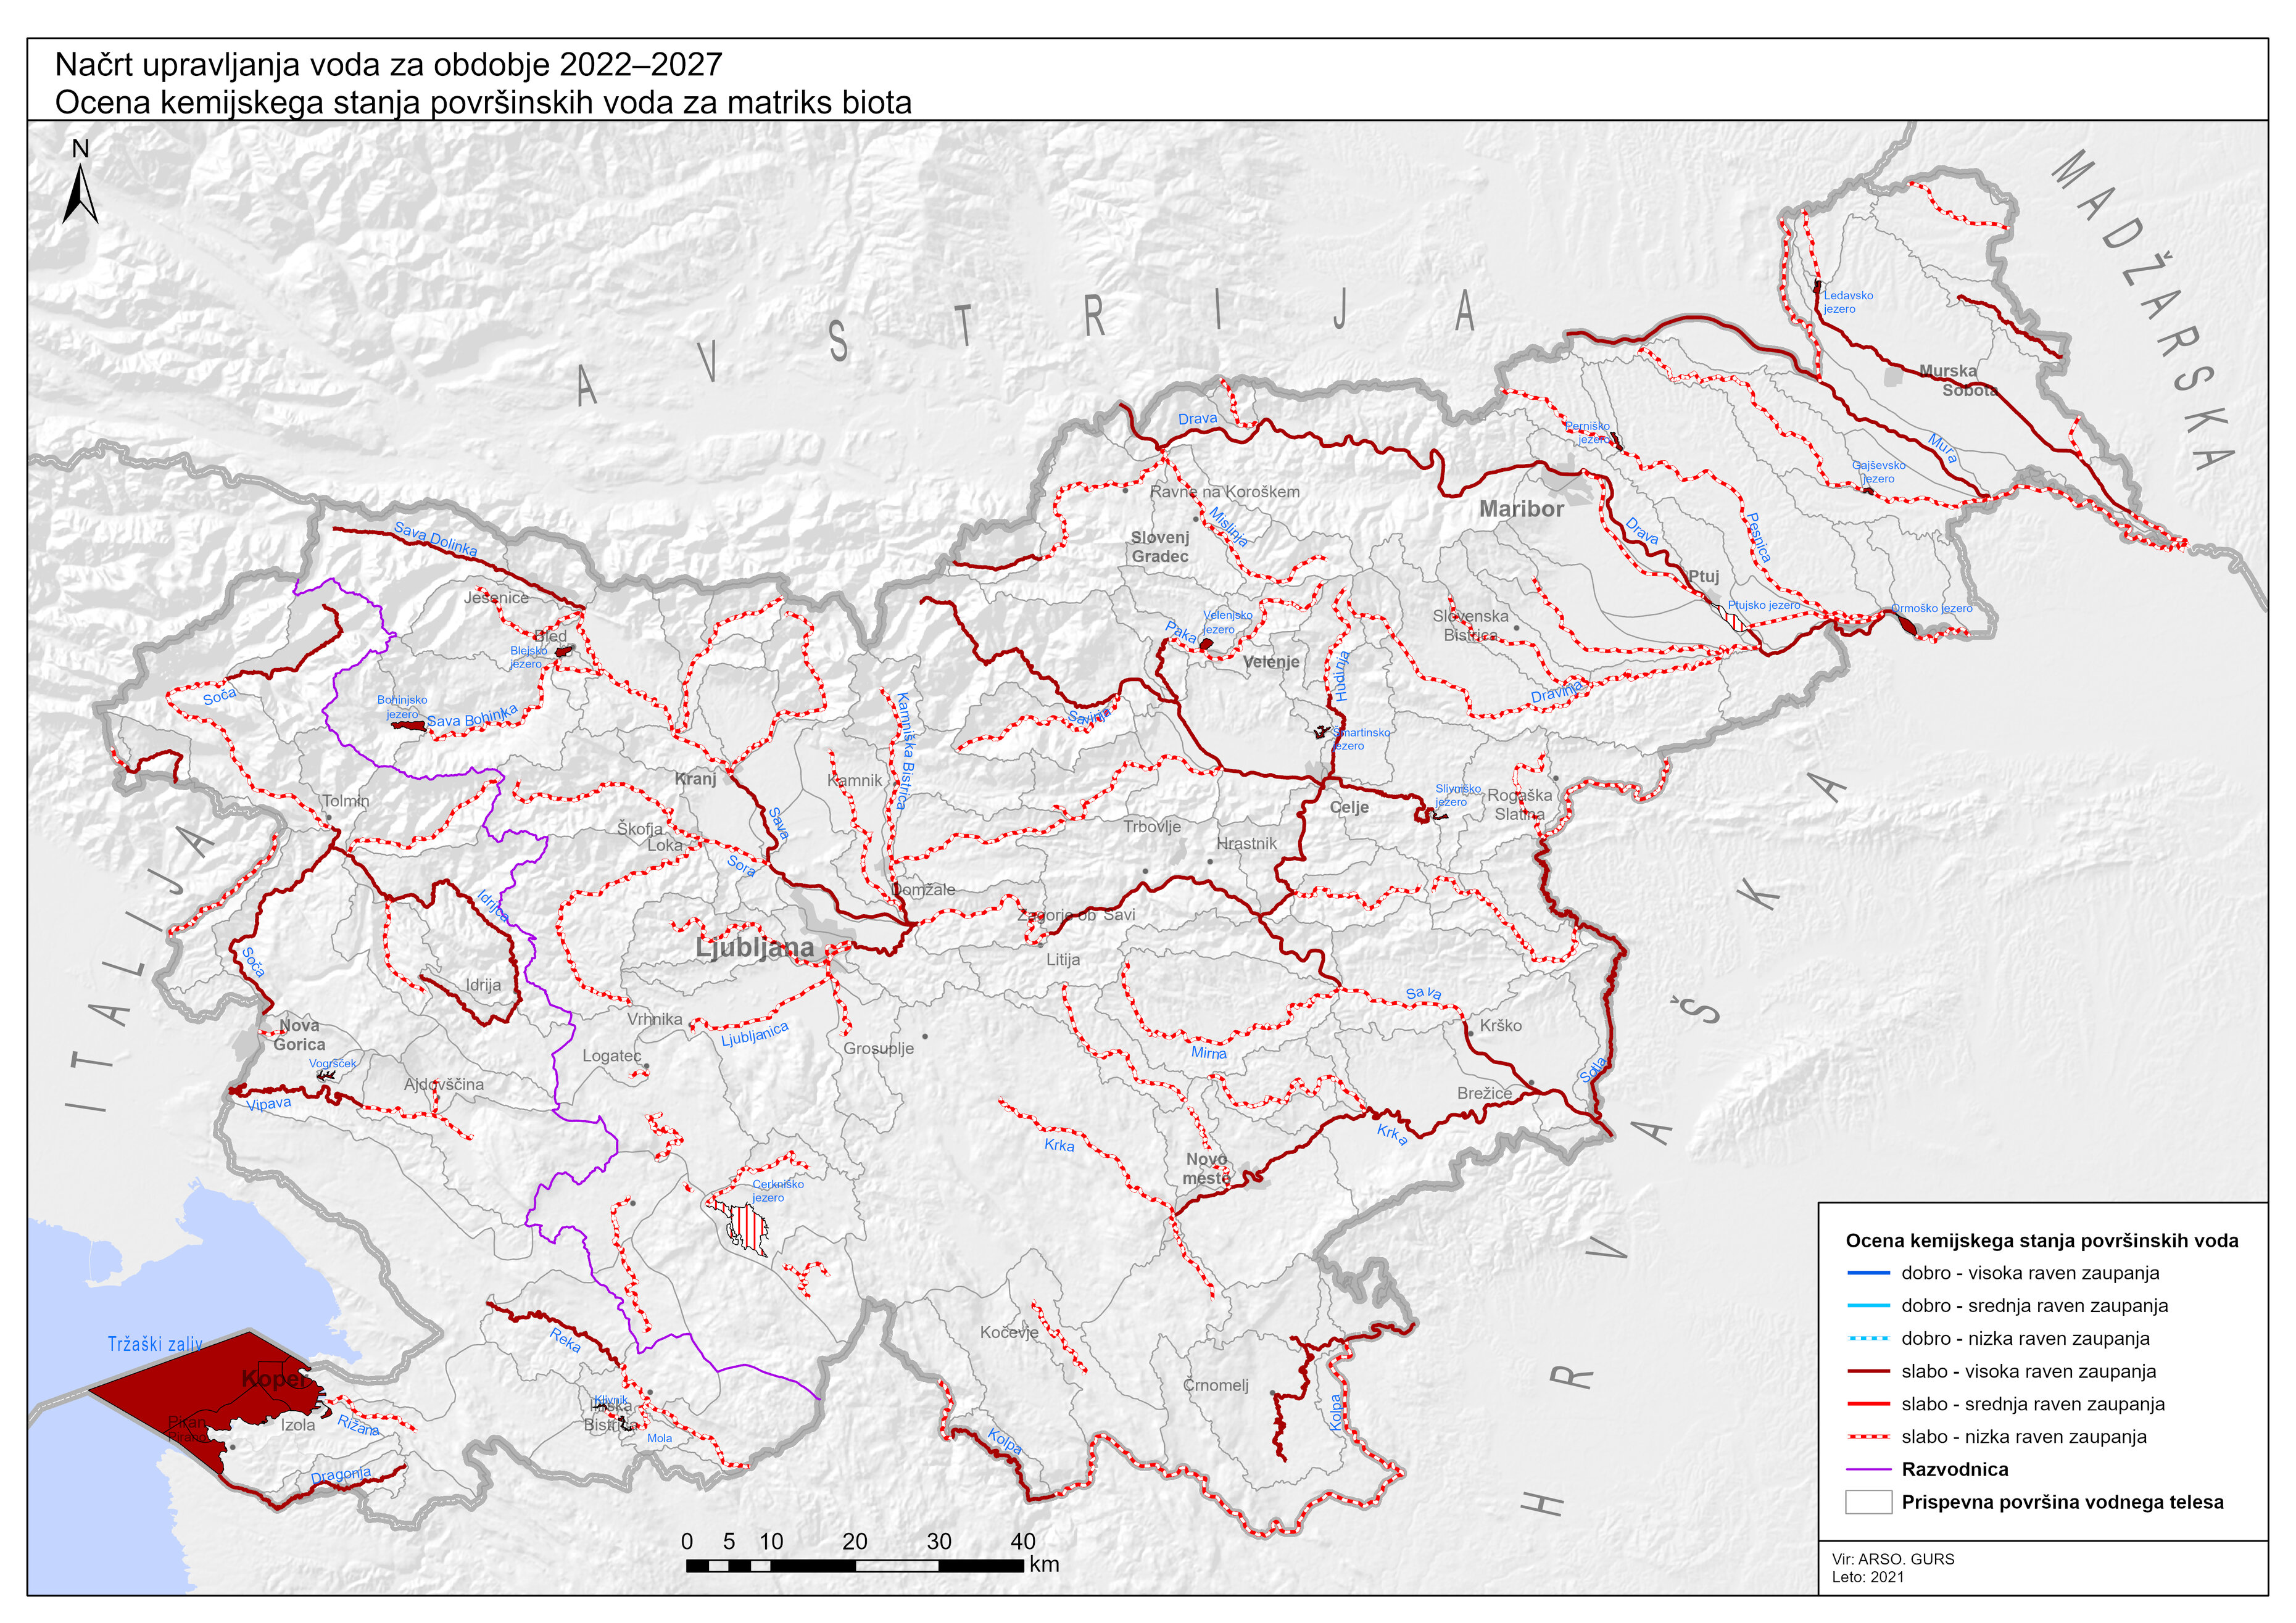
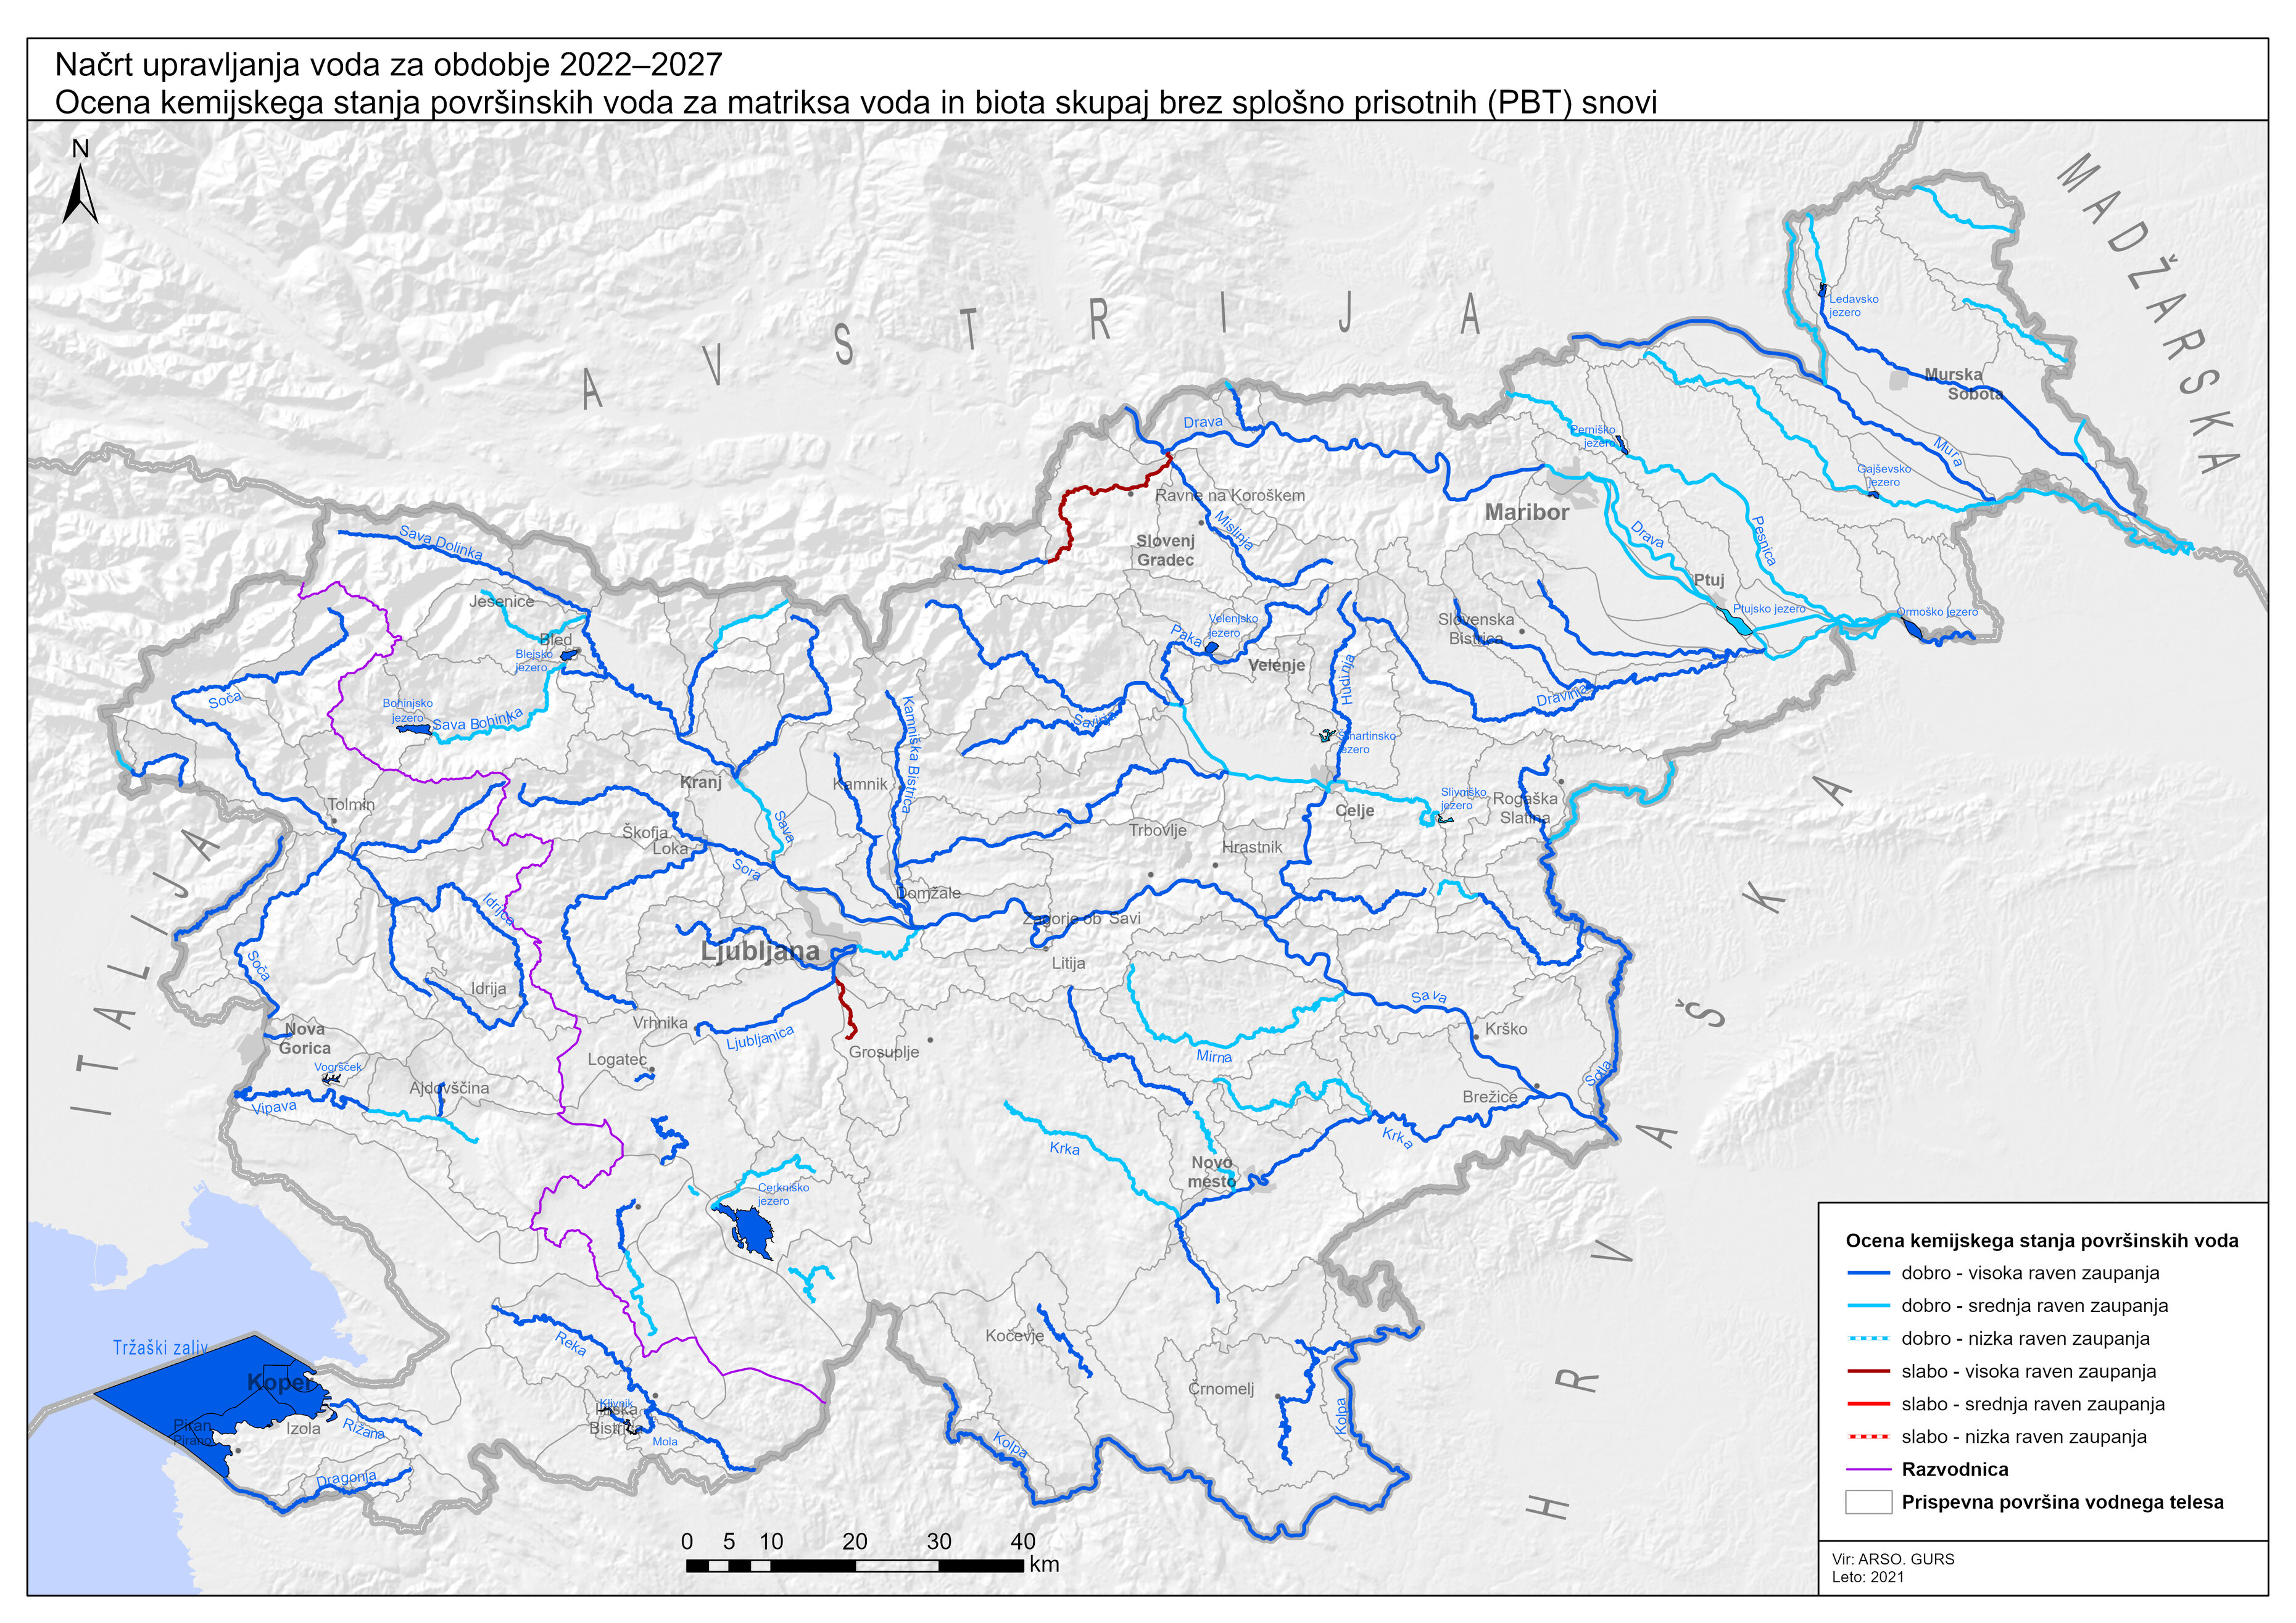
In Slovenia, 98.7% of surface water bodies are in good chemical condition. The two water bodies are in poor chemical condition due to the excess of metals. In general, Slovenian surface waters are not loaded with priority substances in the water, but they are loaded with too high concentrations of mercury and brominated diphenylethers in fish. These are ubiquitous pollutants that are excessively present in biota both in Slovenia and in Europe.
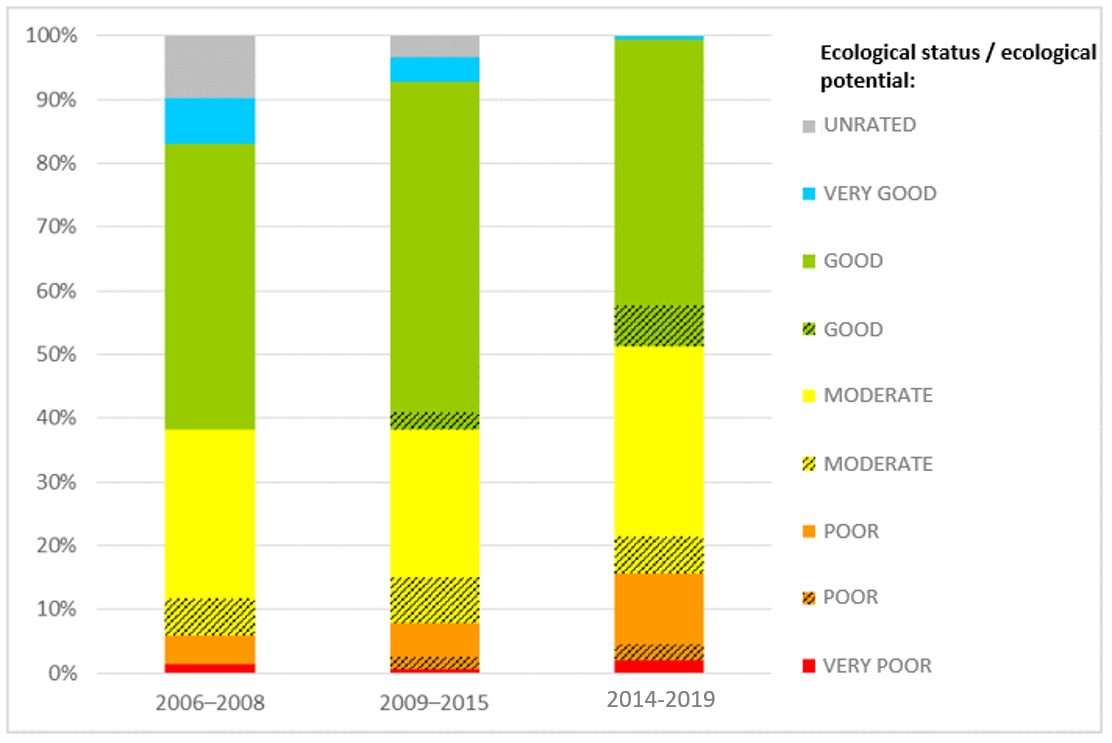
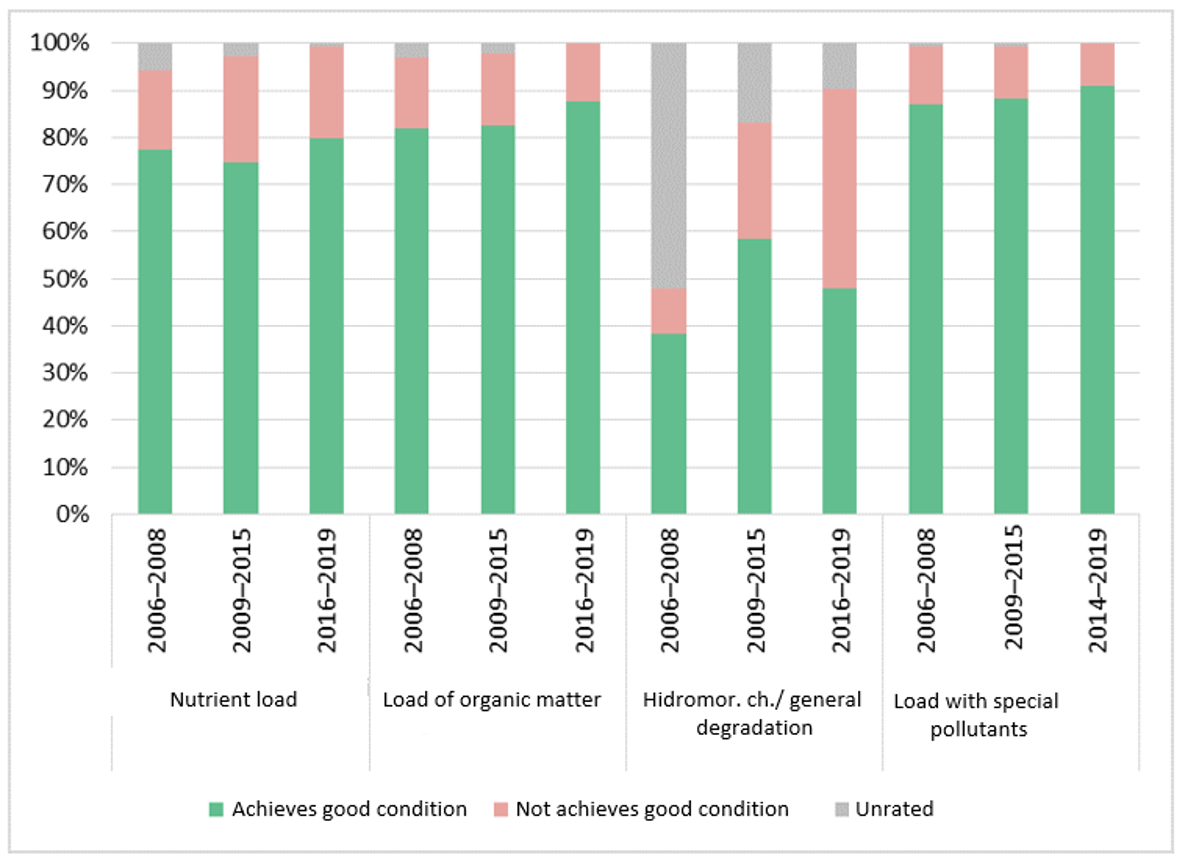
Good or better ecological status is estimated for 49% of surface water bodies. The main reasons for the moderate or poorer ecological status of surface waters are hydromorphological change and general degradation, which are evaluated on the basis of the status of benthic invertebrate and fish communities. Compared to the previous assessment period, good ecological status is achieved by 9% fewer water bodies.
Charts
National water quality monitoring database, Slovenian Environment Agency, 2021 (marec, 2021)
| no assessment[% of water bodies] | bad status[% of water bodies] | good status[% of water bodies] | |
|---|---|---|---|
| 2009-2013 | 0.60 | 4.50 | 94.80 |
| 0.60 | 3.20 | 96.10 | |
| 0 | 1.30 | 98.70 |
National water quality monitoring database, Slovenian Environment Agency, 2021 (marec, 2021)
National water quality monitoring database, Slovenian Environment Agency, 2021 (marec, 2021)
National water quality monitoring database, Slovenian Environment Agency, 2021 (March, 2021)
| 2006–2008 | 2009–2015 | 2016–2019 | |
| Ecological status / ecological potenical | |||
| VERY GOOD | 11 | 6 | 1 |
| GOOD | 69 | 80 | 64 |
| MODERATE | 41 | 36 | 46 |
| POOR | 7 | 8 | 17 |
| VERY POOR | 2 | 1 | 3 |
| GOOD | 4 | 10 | |
| MODERATE | 9 | 11 | 9 |
| POOR | 3 | 4 | |
| UNRATED | 15 | 5 | 0 |
National water quality monitoring database, Slovenian Environment Agency, 2021 (marec, 2021)
| nutrient overload | organic matter overload | hydromorphological changes/general degradation | special pollutants overload | |||||||||
| 2006–2008 | 2009–2015 | 2014–2019 | 2006–2008 | 2009–2015 | 2014–2019 | 2006–2008 | 2009–2015 | 2014–2019 | 2006–2008 | 2009–2015 | 2014–2019 | |
| achieving good status | 119 | 115 | 124 | 113 | 114 | 120 | 59 | 90 | 75 | 134 | 136 | 140 |
| not achieving good status | 26 | 35 | 29 | 21 | 21 | 18 | 15 | 38 | 64 | 19 | 17 | 14 |
| no assessment | 9 | 4 | 1 | 4 | 3 | 0 | 80 | 26 | 15 | 1 | 1 | 0 |
National water quality monitoring database, Slovenian Environment Agency, 2021 (marec, 2021)


