[PR12] Average age and proportion of vehicle fleet meeting certain emission standards

Key message

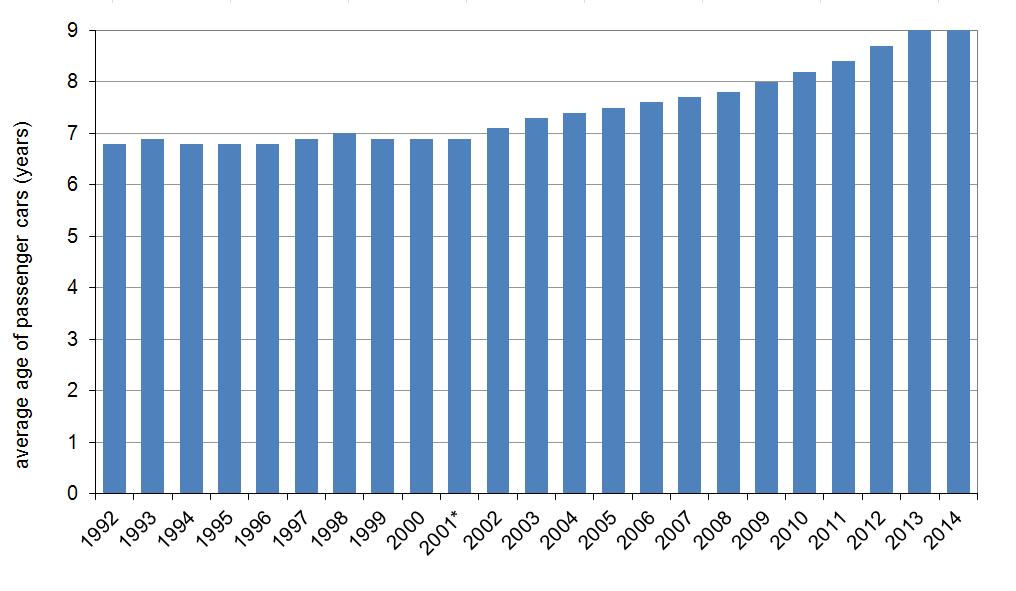
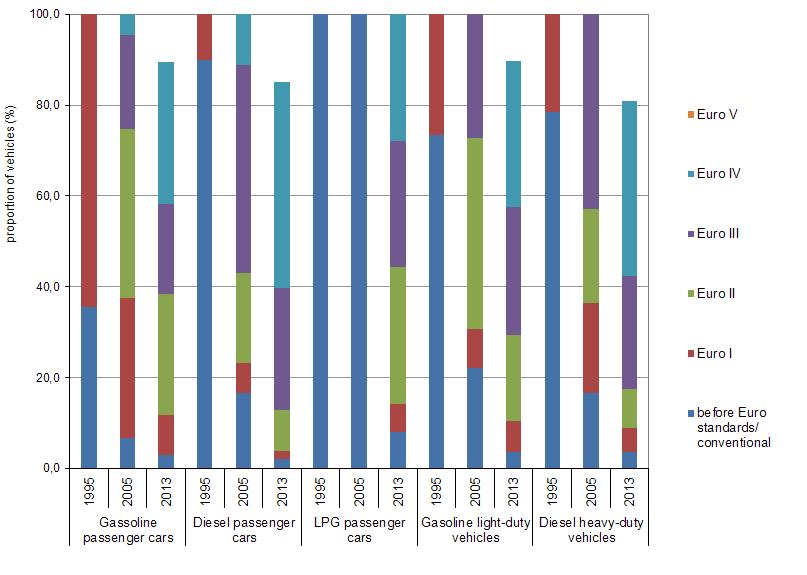
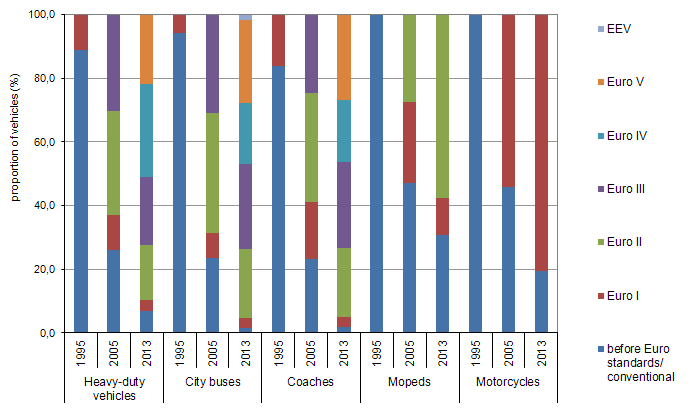
The average age of passengers cars in Slovenia increased from 6.8 years in 1992 to 9.4 years in 2014. During this period, the average age of passenger cars in European countries declined. This means that new technologies are introduced gradually and that the vehicle fleet is mostly less environmentally-friendly.The period of time needed for a new technology to penetrate the vehicle fleet in the EEA is quicker for diesel than for petrol cars. Penetration of new technology is highest for city buses in Slovenia.
Definition
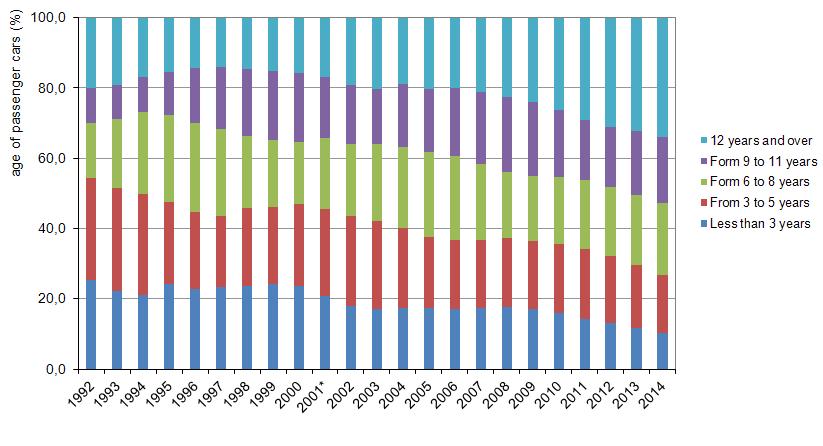
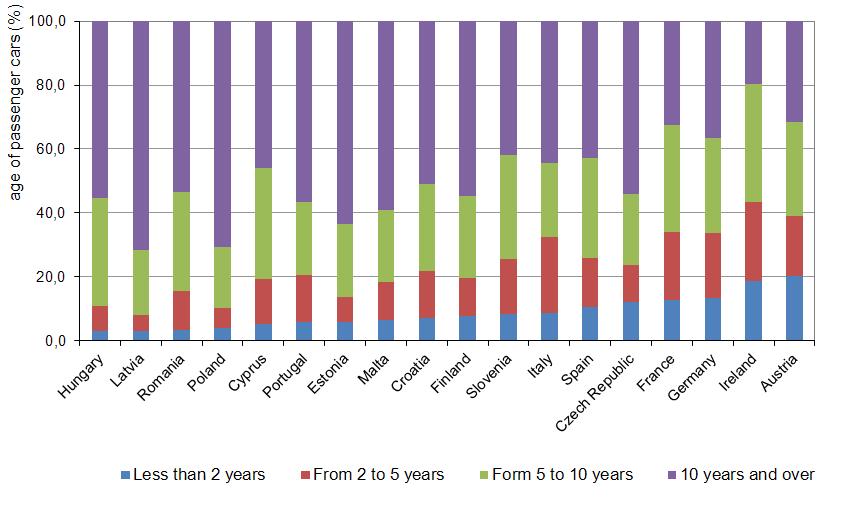
The indicator shows the average age of passenger cars for the period 1992-2014 and proportion of passenger cars by age for the period 1992-2014 in Slovenia. The proportion of passenger cars by age for selected European countries is shown for 2012.
The environmental and safety standards of vehicles are constantly improving; therefore, the new vehicles are on average less polluting, generate less noise, consume less fuel and better protect the users against accidents. The indicator of average age of passenger cars indirectly expresses their environmental efficiency.
Charts
Ministry of the Interior, Records of vehicle registered in Slovenia - database, 2006; Statistical Office of the Republic of Slovenia, SI-STAT Data Portal, 2014
*Note to Figure PR12-1: There is a data gap in time series, for details see methodology
| 1992 | 1993 | 1994 | 1995 | 1996 | 1997 | 1998 | 1999 | 2000 | 2001 | ||
|---|---|---|---|---|---|---|---|---|---|---|---|
| Slovenia | age of vehicle fleet (years) | 7 | 7 | 7 | 7 | 7 | 7 | 7 | 7 | 7 | 7 |
| 2002 | 2003 | 2004 | 2005 | 2006 | 2007 | 2008 | 2009 | 2010 | 2011 | ||
| Slovenia | age of vehicle fleet (years) | 7 | 7 | 7 | 8 | 8 | 8 | 8 | 8 | 8 | 8 |
| 2012 | 2012 | 2014 | |||||||||
| Slovenia | age of vehicle fleet (years) | 9 | 9 | 9 |
Statistical Office of the Republic of Slovenia, Road vehicles at the end of the year (31.12.) by type of vehicle and age, 2015
*Note to Figure PR12-2: There is a data gap in time series, for details see methodology
| 1992 | 1993 | 1994 | 1995 | 1996 | 1997 | 1998 | 1999 | 2000 | 2001 | ||
|---|---|---|---|---|---|---|---|---|---|---|---|
| Less than 3 years | število | 152952 | 144131 | 140442 | 171364 | 168315 | 182396 | 191248 | 205704 | 204877 | 184173 |
| From 3 to 5 years | število | 176621 | 190104 | 192098 | 166630 | 163136 | 156201 | 181414 | 184646 | 200834 | 216509 |
| Form 9 to 11 years | število | 95518 | 128399 | 155804 | 175234 | 188655 | 191096 | 165681 | 160722 | 154481 | 179521 |
| Form 6 to 8 years | število | 59262 | 63677 | 67297 | 87251 | 115284 | 137527 | 154695 | 166858 | 170026 | 151292 |
| 12 years and over | število | 121892 | 124033 | 112666 | 110885 | 107667 | 109578 | 118633 | 128179 | 135878 | 149992 |
| Less than 3 years | % | 25 | 22 | 21 | 24 | 23 | 23 | 24 | 24 | 24 | 21 |
| From 3 to 5 years | % | 29 | 29 | 29 | 23 | 22 | 20 | 22 | 22 | 23 | 25 |
| Form 9 to 11 years | % | 16 | 20 | 23 | 25 | 25 | 25 | 20 | 19 | 18 | 20 |
| Form 6 to 8 years | % | 10 | 10 | 10 | 12 | 16 | 18 | 19 | 20 | 20 | 17 |
| 12 years and over | % | 20 | 19 | 17 | 16 | 14 | 14 | 15 | 15 | 16 | 17 |
| 2002 | 2003 | 2004 | 2005 | 2006 | 2007 | 2008 | 2009 | 2010 | 2011 | ||
| Less than 3 years | število | 160455 | 154397 | 161542 | 166807 | 167425 | 176029 | 183653 | 181405 | 170197 | 152685 |
| From 3 to 5 years | število | 228502 | 229298 | 213805 | 194320 | 192092 | 196975 | 205269 | 204485 | 206881 | 210543 |
| Form 9 to 11 years | število | 183438 | 197995 | 214360 | 230655 | 234473 | 219864 | 197342 | 196198 | 202619 | 210808 |
| Form 6 to 8 years | število | 150356 | 143643 | 166433 | 172335 | 188952 | 206120 | 221254 | 222729 | 204125 | 182310 |
| 12 years and over | število | 171770 | 185096 | 177801 | 196096 | 197319 | 215134 | 237665 | 254041 | 277824 | 310149 |
| Less than 3 years | % | 18 | 17 | 17 | 17 | 17 | 17 | 18 | 17 | 16 | 14 |
| From 3 to 5 years | % | 26 | 25 | 23 | 20 | 20 | 19 | 20 | 19 | 19 | 20 |
| Form 9 to 11 years | % | 21 | 22 | 23 | 24 | 24 | 22 | 19 | 19 | 19 | 20 |
| Form 6 to 8 years | % | 17 | 16 | 18 | 18 | 19 | 20 | 21 | 21 | 19 | 17 |
| 12 years and over | % | 19 | 20 | 19 | 20 | 20 | 21 | 23 | 24 | 26 | 29 |
| 2012 | 2013 | 2014 | |||||||||
| Less than 3 years | število | 140761 | 125719 | 110676 | |||||||
| From 3 to 5 years | število | 203027 | 190429 | 174700 | |||||||
| Form 9 to 11 years | število | 208437 | 211122 | 217975 | |||||||
| Form 6 to 8 years | število | 182339 | 191959 | 201852 | |||||||
| 12 years and over | število | 331464 | 344566 | 363159 | |||||||
| Less than 3 years | % | 13 | 12 | 10 | |||||||
| From 3 to 5 years | % | 19 | 18 | 16 | |||||||
| Form 9 to 11 years | % | 20 | 20 | 20 | |||||||
| Form 6 to 8 years | % | 17 | 18 | 19 | |||||||
| 12 years and over | % | 31 | 32 | 34 |
Database of registered vehicles, Slovenian Ministy of internal affairs, 2015
| 1995- Gassoline passenger cars | 2005-Gassoline passenger cars | 2013-Gassoline passenger cars | 1995-Diesel passenger cars | 2005-Diesel passenger cars | 2013-Diesel passenger cars | 1995-LPG passenger cars | 2005-LPG passenger cars | 2013-LPG passenger cars | 1995-Gasoline light-duty vehicles | ||
|---|---|---|---|---|---|---|---|---|---|---|---|
| before Euro standards/ conventional | število | 89316 | 45808 | 20021 | 51119 | 31973 | 9449 | 1245 | 31 | 68 | 8773 |
| Euro I | število | 162132 | 209319 | 57708 | 5743 | 12380 | 7980 | 0 | 0 | 54 | 3160 |
| Euro II | število | 0 | 252971 | 173489 | 0 | 38149 | 39792 | 0 | 0 | 256 | 0 |
| Euro III | število | 0 | 141531 | 129670 | 0 | 87699 | 119241 | 0 | 0 | 238 | 0 |
| Euro IV | število | 0 | 30781 | 204838 | 0 | 21509 | 201936 | 0 | 0 | 238 | 0 |
| Euro V | število | 0 | 0 | 68949 | 0 | 0 | 66485 | 0 | 0 | 0 | 0 |
| Total | število | 251448 | 680410 | 654675 | 56862 | 191710 | 444883 | 1245 | 31 | 854 | 11933 |
| before Euro standards/ conventional | % | 36 | 7 | 3 | 90 | 17 | 2 | 100 | 100 | 8 | 74 |
| Euro I | % | 64 | 31 | 9 | 10 | 6 | 2 | 0 | 0 | 6 | 26 |
| Euro II | % | 0 | 37 | 27 | 0 | 20 | 9 | 0 | 0 | 30 | 0 |
| Euro III | % | 0 | 21 | 20 | 0 | 46 | 27 | 0 | 0 | 28 | 0 |
| Euro IV | % | 0 | 5 | 31 | 0 | 11 | 45 | 0 | 0 | 28 | 0 |
| Euro V | % | 0 | 0 | 11 | 0 | 0 | 15 | 0 | 0 | 0 | 0 |
| 2005-Gasoline light-duty vehicles | 2013-Gasoline light-duty vehicles | 1995-Diesel heavy-duty vehicles | 2005-Diesel heavy-duty vehicles | 2013-Diesel heavy-duty vehicles | |||||||
| before Euro standards/ conventional | število | 1470 | 182 | 17108 | 9107 | 2292 | |||||
| Euro I | število | 3788 | 350 | 4672 | 10870 | 3241 | |||||
| Euro II | število | 7220 | 958 | 0 | 11436 | 5258 | |||||
| Euro III | število | 4686 | 1424 | 0 | 23544 | 15181 | |||||
| Euro IV | število | 0 | 1631 | 0 | 0 | 23512 | |||||
| Euro V | število | 0 | 516 | 0 | 0 | 11760 | |||||
| Total | število | 17164 | 5061 | 21780 | 54957 | 61244 | |||||
| before Euro standards/ conventional | % | 22 | 4 | 79 | 17 | 4 | |||||
| Euro I | % | 9 | 7 | 21 | 20 | 5 | |||||
| Euro II | % | 42 | 19 | 0 | 21 | 9 | |||||
| Euro III | % | 27 | 28 | 0 | 43 | 25 | |||||
| Euro IV | % | 0 | 32 | 0 | 0 | 38 | |||||
| Euro V | % | 0 | 10 | 0 | 0 | 19 |
Database of registered vehicles, Slovenian Ministy of internal affairs, 2015
| 1995 | 2005 | 2013 | 1995-City buses | 2005-City buses | 2013-City buses | 1995-Coaches | 2005-Coaches | 2013-Coaches | 1995-Mopeds | ||
|---|---|---|---|---|---|---|---|---|---|---|---|
| before Euro standards/ conventional | število | 20125 | 5401 | 1870 | 1221 | 236 | 22 | 991 | 293 | 22 | 1595 |
| Euro I | število | 2484 | 2299 | 967 | 76 | 78 | 40 | 190 | 221 | 40 | 0 |
| Euro II | število | 0 | 6798 | 4649 | 0 | 380 | 272 | 0 | 432 | 272 | 0 |
| Euro III | število | 0 | 6288 | 5746 | 0 | 309 | 336 | 0 | 307 | 336 | 0 |
| Euro IV | število | 0 | 0 | 7950 | 0 | 0 | 243 | 0 | 0 | 243 | |
| Euro V | število | 0 | 0 | 5880 | 0 | 0 | 332 | 0 | 0 | 332 | |
| EEV | število | 0 | 0 | 20 | |||||||
| Total | število | 22609 | 20786 | 27062 | 1297 | 1003 | 1263 | 1181 | 1253 | 1243 | 1595 |
| before Euro standards/ conventional | % | 89 | 26 | 7 | 94 | 24 | 2 | 84 | 23 | 2 | 100 |
| Euro I | % | 11 | 11 | 4 | 6 | 8 | 3 | 16 | 18 | 3 | 0 |
| Euro II | % | 0 | 33 | 17 | 0 | 38 | 22 | 0 | 34 | 22 | 0 |
| Euro III | % | 0 | 30 | 21 | 0 | 31 | 27 | 0 | 25 | 27 | 0 |
| Euro IV | % | 0 | 0 | 29 | 0 | 0 | 19 | 0 | 0 | 20 | |
| Euro V | % | 0 | 0 | 22 | 0 | 0 | 26 | 0 | 0 | 27 | |
| EEV | % | 0 | 0 | 2 | |||||||
| 2005-Mopeds | 2013-Mopeds | 1995-Motorcycles | 2005-Motorcycles | 2013-Motorcycles | |||||||
| before Euro standards/ conventional | število | 16345 | 12915 | 7005 | 6431 | 9047 | |||||
| Euro I | število | 8745 | 4838 | 0 | 7634 | 37373 | |||||
| Euro II | število | 9551 | 24073 | 0 | 0 | 0 | |||||
| Euro III | število | 0 | 0 | 0 | 0 | 0 | |||||
| Euro IV | število | ||||||||||
| Euro V | število | ||||||||||
| EEV | število | ||||||||||
| Total | število | 34641 | 41826 | 7005 | 14065 | 46420 | |||||
| before Euro standards/ conventional | % | 47 | 31 | 100 | 46 | 19 | |||||
| Euro I | % | 25 | 12 | 0 | 54 | 81 | |||||
| Euro II | % | 28 | 58 | 0 | 0 | 0 | |||||
| Euro III | % | 0 | 0 | 0 | 0 | 0 | |||||
| Euro IV | % | ||||||||||
| Euro V | % | ||||||||||
| EEV | % |
EUROSTAT, Passenger cars (by age), 2013
| Hungary | Latvia | Romania | Poland | Cyprus | Portugal | Estonia | Malta | Croatia | Finland | ||
|---|---|---|---|---|---|---|---|---|---|---|---|
| Less than 2 years | število | 86 | 18 | 149 | 738 | 25 | 244 | 35 | 16 | 103 | 238 |
| From 2 to 5 years | število | 236 | 31 | 544 | 1189 | 66 | 630 | 47 | 30 | 211 | 361 |
| Form 5 to 10 years | število | 1015 | 126 | 1399 | 3572 | 166 | 971 | 138 | 56 | 393 | 776 |
| 10 years and over | število | 1649 | 443 | 2395 | 13245 | 218 | 2414 | 383 | 148 | 738 | 1661 |
| Total | število | 2986 | 618 | 4487 | 18744 | 475 | 4259 | 602 | 250 | 1445 | 3037 |
| Less than 2 years | % | 3 | 3 | 3 | 4 | 5 | 6 | 6 | 6 | 7 | 8 |
| From 2 to 5 years | % | 8 | 5 | 12 | 6 | 14 | 15 | 8 | 12 | 15 | 12 |
| Form 5 to 10 years | % | 34 | 20 | 31 | 19 | 35 | 23 | 23 | 23 | 27 | 26 |
| 10 years and over | % | 55 | 72 | 53 | 71 | 46 | 57 | 64 | 59 | 51 | 55 |
| Total | % | 100 | 100 | 100 | 100 | 100 | 100 | 100 | 100 | 100 | 100 |
| Slovenia | Italy | Spain | Czech Republic | France | Germany | Ireland | Austria | ||||
| Less than 2 years | število | 88 | 3189 | 2338 | 571 | 4146 | 5751 | 365 | 922 | ||
| From 2 to 5 years | število | 182 | 8780 | 3419 | 542 | 6903 | 8829 | 482 | 869 | ||
| Form 5 to 10 years | število | 350 | 8651 | 6959 | 1045 | 10924 | 12874 | 721 | 1347 | ||
| 10 years and over | število | 446 | 16458 | 9532 | 2549 | 10582 | 15758 | 383 | 1446 | ||
| Total | število | 1066 | 37078 | 22248 | 4706 | 32555 | 43212 | 1951 | 4584 | ||
| Less than 2 years | % | 8 | 9 | 11 | 12 | 13 | 13 | 19 | 20 | ||
| From 2 to 5 years | % | 17 | 24 | 15 | 12 | 21 | 20 | 25 | 19 | ||
| Form 5 to 10 years | % | 33 | 23 | 31 | 22 | 34 | 30 | 37 | 29 | ||
| 10 years and over | % | 42 | 44 | 43 | 54 | 33 | 36 | 20 | 32 | ||
| Total | % | 100 | 100 | 100 | 100 | 100 | 100 | 100 | 100 |


