[EN01] Energy-related greenhouse gas emissions

Key message

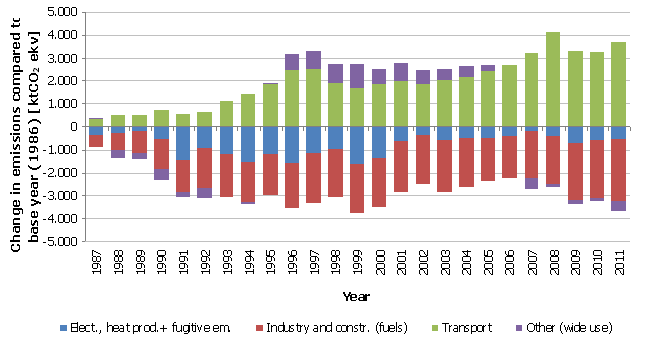
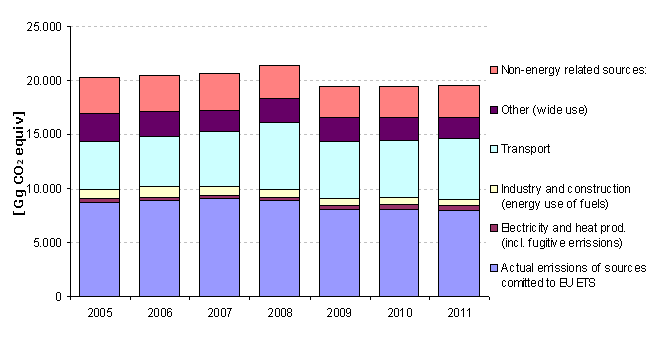
Energy use in 2011 contributed more than 80% of total greenhouse gas emissions in Slovenia. The largest source of emissions is the production of electricity and heat (34%), followed by transport (28%). With the introduction of trading in greenhouse gas emissions in the EU (EU-ETS) to achieve Kyoto targets and other objectives of the country to reduce greenhouse gas emissions only important sources in the EU ETS are not included. The total emissions of these resources in the first four years of the 2008-2012 Kyoto period decreased by 215 kt CO2 eq. The maximum contribution from the use of fuels (75%), within which is the biggest source of traffic.
Definition
The indicator shows past energy-related greenhouse gas emissions (of carbon dioxide (CO2), methane (CH4), nitrous oxide (N2O) and F-gases), Kyoto Protocol targets in the 2008–2012 period and analyses of their trends.
Charts
Slovenian Environment Agency, 2013;
| Non-energy related sources | Electricity and heat production (incl. fugitive emissions) | Industry and construction (energy use of fuels) | Transport | Other (wide use) | ||
|---|---|---|---|---|---|---|
| 2011 | Gg CO2 equiv | 3435.3 | 6714 | 1704.2 | 5698.7 | 1957.1 |
| 2011 | % | 17.6 | 34.4 | 8.7 | 29.2 | 10 |
Slovenian Environment Agency, 2013.
| 1986 | 1987 | 1988 | 1989 | 1990 | 1991 | 1992 | 1993 | 1994 | 1995 | ||
|---|---|---|---|---|---|---|---|---|---|---|---|
| Energy sector: | Gg CO2 equiv | 16103 | 15525.6 | 15150.1 | 15122.7 | 14415.8 | 13548.2 | 13558.6 | 14062.9 | 14074 | 14949.3 |
| Elect., heat prod.+ fugitive em. | Gg CO2 equiv | 7265 | 6890 | 6971.1 | 7089.5 | 6724.6 | 5777.8 | 6354.4 | 6092.4 | 5682.5 | 6069.3 |
| Industry and constr. (fuels) | Gg CO2 equiv | 4404 | 3901.5 | 3673.6 | 3445.8 | 3118.8 | 3057.4 | 2662.7 | 2503.2 | 2665.4 | 2615.2 |
| Transport | Gg CO2 equiv | 2025 | 2315 | 2494.1 | 2525.1 | 2729.8 | 2576.8 | 2651.5 | 3095.8 | 3447.6 | 3824.3 |
| Other (wide use) | Gg CO2 equiv | 2409 | 2419.2 | 2011.3 | 2062.3 | 1842.6 | 2136.1 | 1890 | 2371.5 | 2278.5 | 2440.5 |
| Energy sector: | Gg CO2 equiv | -518.3 | -893.8 | -921.2 | -1628.1 | -2495.7 | -2485.3 | -1981 | -1969.9 | -1094.7 | |
| Elect., heat prod.+ fugitive em. | Gg CO2 equiv | -374.8 | -293.7 | -175.3 | -540.2 | -1486.9 | -910.4 | -1172.3 | -1582.3 | -1195.5 | |
| Industry and constr. (fuels) | Gg CO2 equiv | -504.2 | -732.1 | -959.8 | -1286.9 | -1348.3 | -1743 | -1902.5 | -1740.3 | -1790.5 | |
| Transport | Gg CO2 equiv | 307.4 | 486.5 | 517.5 | 722.2 | 569.2 | 643.9 | 1088.2 | 1440 | 1816.7 | |
| Other (wide use) | Gg CO2 equiv | 53.3 | -354.5 | -303.5 | -523.3 | -229.7 | -475.9 | 5.6 | -87.4 | 74.6 | |
| 1996 | 1997 | 1998 | 1999 | 2000 | 2001 | 2002 | 2003 | 2004 | 2005 | ||
| Energy sector: | Gg CO2 equiv | 15666.8 | 15984 | 15677.8 | 15001.6 | 15095.1 | 15932.7 | 15988.3 | 15715.8 | 16048.3 | 16278.9 |
| Elect., heat prod.+ fugitive em. | Gg CO2 equiv | 5662.8 | 6099.9 | 6321.4 | 5611.6 | 5908.9 | 6609.4 | 6895.3 | 6648.6 | 6777 | 6777.3 |
| Industry and constr. (fuels) | Gg CO2 equiv | 2478.5 | 2219.6 | 2285.8 | 2296.7 | 2268.7 | 2210.5 | 2243.8 | 2157.9 | 2276.4 | 2485.5 |
| Transport | Gg CO2 equiv | 4462.5 | 4530.3 | 3904.6 | 3712.3 | 3861.7 | 3984.1 | 3864.2 | 4003.5 | 4153.5 | 4427.6 |
| Other (wide use) | Gg CO2 equiv | 3063 | 3134.1 | 3166.1 | 3381 | 3055.9 | 3128.7 | 2984.9 | 2905.8 | 2841.4 | 2588.5 |
| Energy sector: | Gg CO2 equiv | -377.1 | -60 | -366.1 | -1042.4 | -948.9 | -111.3 | -55.7 | -328.2 | 4.3 | 235 |
| Elect., heat prod.+ fugitive em. | Gg CO2 equiv | -1602 | -1164.9 | -943.4 | -1653.2 | -1355.9 | -655.4 | -369.4 | -616.2 | -487.8 | -487.5 |
| Industry and constr. (fuels) | Gg CO2 equiv | -1927.2 | -2186 | -2119.9 | -2109 | -2137 | -2195.2 | -2161.9 | -2247.8 | -2129.2 | -1920.2 |
| Transport | Gg CO2 equiv | 2454.9 | 2522.8 | 1897 | 1704.7 | 1854.1 | 1976.5 | 1856.6 | 1995.9 | 2145.9 | 2420 |
| Other (wide use) | Gg CO2 equiv | 697.2 | 768.2 | 800.2 | 1015.1 | 690 | 762.8 | 619 | 540 | 475.5 | 222.6 |
| 2006 | 2007 | 2008 | 2009 | 2010 | 2011 | ||||||
| Energy sector: | Gg CO2 equiv | 16448.4 | 16559.7 | 17585.7 | 15968.8 | 16057.6 | 16074 | ||||
| Elect., heat prod.+ fugitive em. | Gg CO2 equiv | 6843.9 | 7066.8 | 6842.5 | 6536.9 | 6664.1 | 6714 | ||||
| Industry and constr. (fuels) | Gg CO2 equiv | 2593.5 | 2346 | 2304.6 | 1917.8 | 1899.6 | 1704.2 | ||||
| Transport | Gg CO2 equiv | 4647.4 | 5228.8 | 6157.7 | 5325.4 | 5265.1 | 5698.7 | ||||
| Other (wide use) | Gg CO2 equiv | 2363.6 | 1918 | 2280.9 | 2188.9 | 2228.8 | 1957.1 | ||||
| Energy sector: | Gg CO2 equiv | 404.4 | 515.7 | 1541.8 | -75.1 | 13.7 | 30 | ||||
| Elect., heat prod.+ fugitive em. | Gg CO2 equiv | -420.9 | -198 | -422.3 | -727.9 | -600.7 | -550.8 | ||||
| Industry and constr. (fuels) | Gg CO2 equiv | -1812.2 | -2059.7 | -2101.1 | -2487.9 | -2506.1 | -2701.5 | ||||
| Transport | Gg CO2 equiv | 2639.8 | 3221.2 | 4150.1 | 3317.8 | 3257.5 | 3691.1 | ||||
| Other (wide use) | Gg CO2 equiv | -2.3 | -447.8 | -84.9 | -177 | -137.1 | -408.8 |
Slovenian Environment Agency, 2013.
| 2005 | 2006 | 2007 | 2008 | 2009 | 2010 | 2011 | ||
|---|---|---|---|---|---|---|---|---|
| Actual emissions of sources comitted to EU ETS | Gg CO2 equiv | 8720.6 | 8842.2 | 9048.6 | 8860.1 | 8067 | 8129.9 | 7994.6 |
| Granted quotas in the national allocation plan for the period 2005-2007 | Gg CO2 equiv | 9192.5 | 8757.3 | 8311.2 | 8214.4 | 8216.1 | 8209 | 8209 |
| The difference between actual emissions and quotas | Gg CO2 equiv | -472 | 84.9 | 737.4 | 645.7 | -149 | -79.1 | -214.4 |
| Emissions due to energy use | Gg CO2 equiv | 8240.7 | 8321.8 | 8250 | 9504.3 | 8511.5 | 8516.5 | 8598.9 |
| Electricity and heat prod. (incl. fugitive emissions) | Gg CO2 equiv | 365.1 | 366.6 | 342.5 | 305.3 | 304.2 | 323.8 | 377.1 |
| Industry and construction (energy use of fuels) | Gg CO2 equiv | 859.5 | 944.2 | 760.6 | 760.4 | 693 | 698.8 | 566.1 |
| Transport | Gg CO2 equiv | 4427.6 | 4647.4 | 5228.8 | 6157.7 | 5325.4 | 5265.1 | 5698.7 |
| Other (wide use) | Gg CO2 equiv | 2588.5 | 2363.6 | 1918 | 2280.9 | 2188.9 | 2228.8 | 1957.1 |
| Non-energy related sources: | Gg CO2 equiv | 3347.3 | 3390.3 | 3391.1 | 3041.8 | 2848.1 | 2835.5 | 2915.8 |
| TOTAL non-EU ETS | Gg CO2 equiv | 11588 | 11712.1 | 11641 | 12546.1 | 11359.6 | 11352 | 11514.8 |
| Target for non-EU ETS sector 2008-2012 | Gg CO2 equiv | 11746.8 | 11746.8 | 11746.8 | 11746.8 | 11746.8 | 11746.8 | 11746.8 |
| Distance to target for non-EU ETS | Gg CO2 equiv | -158.8 | -34.7 | -105.8 | 799.4 | -387.2 | -394.8 | -232 |
| Cumulative distance to target in the period 2008-2012 | Gg CO2 equiv | 799.4 | 412.2 | 17.4 | -214.6 |


