[PP10] Extreme precipitation 

Key message

Precipitation is highly variable in space and time, even more than temperature (storms and hail). In the last two decades, Slovenia is observing catastrophic droughts and abundant precipitation resulting in floods, sometimes drought and floods occur even within the same year. The maximum snow cover depth and the depth of fresh snow decreased in the period 1961-2022.
Charts
ARSO Meteorological Data Archive, Slovenian Environment Agency, 2023
| Kredarica[cm] | Rateče[cm] | Murska Sobota[cm] | Novo mesto[cm] | Ljubljana[cm] | Portorož[cm] | |
|---|---|---|---|---|---|---|
| 1961 | 318 | 82 | 10 | 22 | 41 | 9 |
| 1962 | 335 | 95 | 43 | 42 | 21 | 0 |
| 1963 | 304 | 125 | 53 | 59 | 54 | 0 |
| 1964 | 282 | 96 | 22 | 52 | 42 | 0 |
| 1965 | 391 | 178 | 23 | 30 | 39 | 0 |
| 1966 | 270 | 68 | 23 | 37 | 37 | 0 |
| 1967 | 348 | 110 | 23 | 57 | 40 | 0 |
| 1968 | 362 | 101 | 14 | 20 | 49 | 0 |
| 1969 | 392 | 181 | 50 | 103 | 95 | 3 |
| 1970 | 450 | 166 | 30 | 34 | 45 | 0 |
| 1971 | 299 | 107 | 28 | 51 | 53 | 0 |
| 1972 | 411 | 100 | 24 | 35 | 49 | 0 |
| 1973 | 405 | 118 | 17 | 37 | 12 | 0 |
| 1974 | 360 | 85 | 3 | 20 | 11 | 0 |
| 1975 | 560 | 135 | 3 | 7 | 14 | 0 |
| 1976 | 300 | 112 | 31 | 52 | 69 | 0 |
| 1977 | 690 | 104 | 18 | 21 | 28 | 3 |
| 1978 | 587 | 190 | 23 | 28 | 35 | 0 |
| 1979 | 630 | 102 | 17 | 27 | 20 | 7 |
| 1980 | 420 | 106 | 31 | 40 | 30 | 0 |
| 1981 | 280 | 118 | 38 | 37 | 31 | 0 |
| 1982 | 350 | 92 | 11 | 19 | 14 | 0 |
| 1983 | 390 | 82 | 42 | 50 | 67 | 1 |
| 1984 | 500 | 173 | 25 | 54 | 47 | 8 |
| 1985 | 495 | 90 | 24 | 45 | 55 | 0 |
| 1986 | 490 | 113 | 61 | 50 | 46 | 11 |
| 1987 | 405 | 114 | 44 | 43 | 89 | 8 |
| 1988 | 425 | 75 | 12 | 20 | 15 | 0 |
| 1989 | 220 | 17 | 0 | 4 | 1 | 0 |
| 1990 | 310 | 71 | 10 | 9 | 7 | 0 |
| 1991 | 440 | 110 | 20 | 22 | 21 | 0 |
| 1992 | 380 | 42 | 4 | 32 | 20 | 0 |
| 1993 | 205 | 73 | 35 | 40 | 18 | 0 |
| 1994 | 370 | 75 | 30 | 62 | 32 | 0 |
| 1995 | 380 | 71 | 30 | 44 | 30 | 0 |
| 1996 | 325 | 98 | 33 | 52 | 35 | 0 |
| 1997 | 250 | 58 | 27 | 25 | 39 | 0 |
| 1998 | 315 | 26 | 16 | 25 | 21 | 0 |
| 1999 | 385 | 119 | 31 | 65 | 56 | 0 |
| 2000 | 325 | 40 | 7 | 17 | 11 | 0 |
| 2001 | 700 | 38 | 21 | 16 | 14 | 0 |
| 2002 | 195 | 14 | 8 | 19 | 21 | 0 |
| 2003 | 240 | 45 | 27 | 52 | 26 | 3 |
| 2004 | 465 | 125 | 18 | 42 | 41 | 0 |
| 2005 | 245 | 107 | 46 | 37 | 40 | 7 |
| 2006 | 495 | 124 | 37 | 24 | 32 | 0 |
| 2007 | 300 | 82 | 9 | 28 | 19 | 0 |
| 2008 | 435 | 128 | 5 | 11 | 17 | 0 |
| 2009 | 560 | 163 | 11 | 24 | 23 | 1 |
| 2010 | 450 | 79 | 27 | 50 | 48 | 8 |
| 2011 | 395 | 27 | 3 | 6 | 3 | 0 |
| 2012 | 240 | 28 | 14 | 44 | 27 | 11 |
| 2013 | 475 | 115 | 40 | 65 | 53 | 8 |
| 2014 | 560 | 120 | 14 | 30 | 26 | 0 |
| 2015 | 245 | 40 | 8 | 49 | 28 | 0 |
| 2016 | 435 | 68 | 9 | 27 | 17 | 0 |
| 2017 | 340 | 37 | 7 | 20 | 15 | 0 |
| 2018 | 560 | 85 | 17 | 51 | 27 | 0 |
| 2019 | 385 | 46 | 2 | 10 | 9 | 0 |
| 2020 | 350 | 95 | 2 | 14 | 17 | 0 |
| 2021 | 520 | 135 | 10 | 13 | 20 | 0 |
| 2022 | 245 | 75 | 1 | 10 | 6 | 0 |
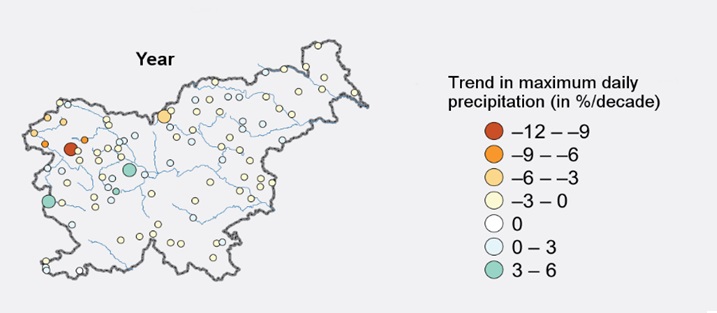
Podnebna spremenljivost Slovenije v obdobju 1961–2011: Značilnosti podnebja v Sloveniji, 2017
Podnebna spremenljivost Slovenije v obdobju 1961–2011: Značilnosti podnebja v Sloveniji, 2017
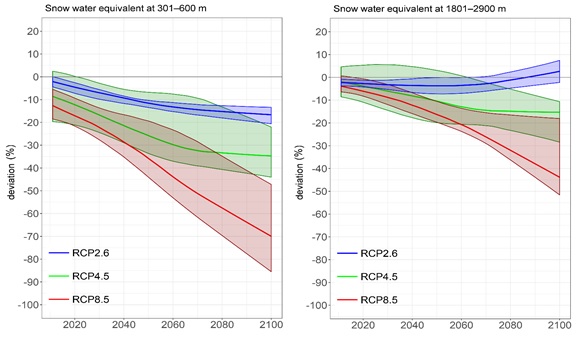
Kazalniki snežnih razmer (interno poročilo ARSO), 2019
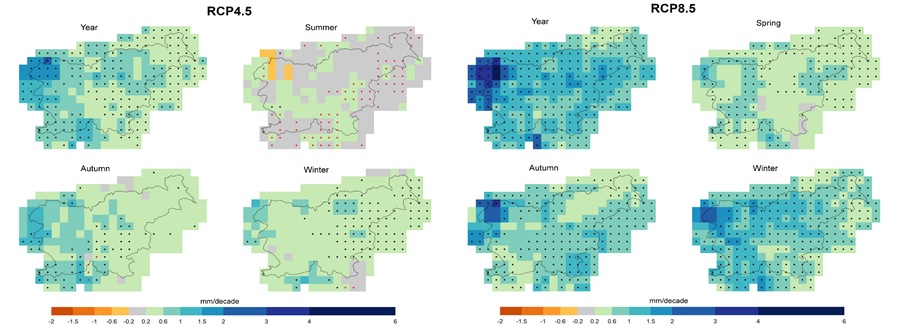
Assessment of climate changes in Slovenia by the end of the 21st century, 2018
Black dots indicate cells with a reliable trend, red dots cells with an unreliable trend. The trend is not significant in other cells (detected changes are smaller than the natural variability).
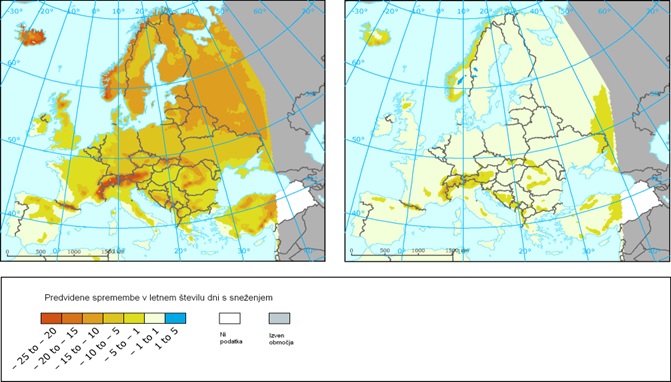
European Environment Agency, Indicators, 2016
The figure shows projected changes in the number of days with snow between the periods 1971-2000 and 2041-2070. Left figure shows snowfall over 1cm, the right snowfall over 10 cm. In Slovenia, it is expected to reduce the number of days with snow at least 1 cm from 1 to 5 days and sometimes up to 10 days. For heavier snowfall over 10 cm per day, for the most part of the country is not expected to change significantly.
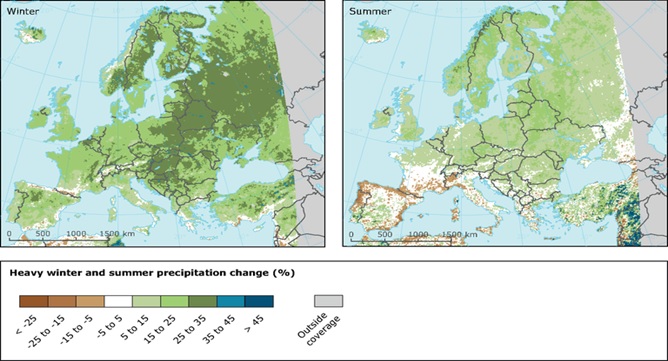
European Environment Agency, Indicators, 2016
The figure show change in heavy rainfall (in percent) between the periods 1971-2000 and 2071-2100 in the adverse scenario of rising greenhouse gases. On the left are the changes in the winter period and on the right changes in the summer period. In summer, figure shows a small increase in the northeast of Slovenia and in winter significant increase throughout the country.
Methodology
- Agencija RS za okolje, Naše okolje, mesečni bilten ARSO.
- Agencija RS za okolje, Izredni dogodki (19.6.2023).
- Evropska agencija za okolje, Indikatorji, Snow cover (CLIM 008)(10. 3. 2016).
- Evropska agencija za okolje, Indikatorji, Precipitation extremes (CLIM 004).
- Svetovna meteorološka organizacija, 2021. WMO Statement on the State of the Global Climate in 2020.
- Zakon o državni meteorološki, hidrološki, oceanografski in seizmološki službi (ZDMHS) (Uradni list RS, št. 60/17)
- Agencija RS za okolje, 2018. Ocena podnebnih sprememb v Sloveniji do konca 21. stoletja. Ljubljana, november 2018.
- Uprava za zaščito in reševanje, SPIN (19.6.2023).


