[KM12] Specialisation and diversification of agriculture

Key message

Slovenia belongs to the EU Member States with a lower level of specialization in agriculture. This is reflected in the number of specialized farms and the surface area of agricultural land treated by these holdings. Specialized farms in Slovenia generate a smaller share of standard output than the average in the European Union, which indicates that the processes of concentration and specialization of agricultural production in Slovenia is slower than in European Union. It should be emphasized here that specialization can lead to a lower diversity of plants and animals and, consequently, to a lower resilience of agriculture and poorer land quality for future generations.
Definition
The specialization of agriculture is directing the agricultural production in a particular agricultural sector. In the production–economic sense, it can be defined as the predominance of an individual type of production or service in the value of the income of agricultural holdings. The main drivers of agricultural specialization are economic efficiency and market and price conditions. Specialization enables greater production efficiency, which is mainly reflected in the increase in the level of production per production unit–intensity. The level of specialization of agriculture in Slovenia is analyzed for the period 2010–2020 and is shown by:
- the share of agricultural holdings by individual types of farming,
- the share of the area of agricultural land in use by individual types of agricultural holdings,
- share and movement of the value of economic size on agricultural holdings by individual types of farming.
Charts
SORS, 2023; calculations by AIS
| 2007[%] | 2010[%] | 2020[%] | |
|---|---|---|---|
| Specialist field crops | 12.54 | 17.12 | 25.14 |
| Specialist horticulture | 0.68 | 0.70 | 0.63 |
| Specialist permanent crops | 9.01 | 11.64 | 16.09 |
| Specialist grazing livestock | 44.15 | 40.04 | 32.06 |
| Specialist granivores | 1.81 | 1.22 | 0.75 |
| Mixed cropping | 8.14 | 7.39 | 8.76 |
| Mixed livestock holdings | 7.42 | 6.60 | 3.24 |
| Mixed crops - livestock | 16.25 | 15.29 | 13.32 |
SORS, 2023; calculations by AIS
| 2007[%] | 2010[%] | 2020[%] | |
|---|---|---|---|
| Specialist field crops | 10.59 | 13.32 | 21.55 |
| Specialist horticulture | 0.55 | 0.46 | 0.35 |
| Specialist permanent crops | 4.20 | 4.70 | 6.47 |
| Specialist grazing livestock | 59.60 | 55.64 | 48.30 |
| Specialist granivores | 2.37 | 2.63 | 1.27 |
| Mixed cropping | 3.87 | 3.75 | 5.45 |
| Mixed livestock holdings | 6.08 | 5.59 | 3.12 |
| Mixed crops - livestock | 12.75 | 13.92 | 13.49 |
SORS, 2023; calculations by AIS
| 2007[%] | 2010[%] | 2020[%] | |
|---|---|---|---|
| Specialist field crops | 4.29 | 6.86 | 11.07 |
| Specialist horticulture | 8.52 | 2.98 | 2.03 |
| Specialist permanent crops | 6.16 | 8.34 | 16.72 |
| Specialist grazing livestock | 49.38 | 50.14 | 40.89 |
| Specialist granivores | 12.31 | 10.12 | 9.46 |
| Mixed cropping | 3.19 | 3.45 | 5.51 |
| Mixed livestock holdings | 5.74 | 5.23 | 2.76 |
| Mixed crops - livestock | 10.40 | 12.86 | 11.56 |
EUROSTAT, 2023; SORS, 2023; calculations by AIS
| Plant production[%] | Livestock breeding[%] | Mixed livestock breeding[%] | Mixed plant production[%] | Mixed livestock breeding – plant production[%] | Non-classified farms[%] | |
|---|---|---|---|---|---|---|
| 2010 | 29.46 | 41.26 | 6.60 | 7.39 | 15.29 | 0 |
| 2020 | 41.87 | 32.81 | 3.24 | 8.76 | 13.32 | 0 |
| 2010 | ||||||
| 2020 | 47.14 | 26.93 | 6.61 | 4.41 | 12.98 | 1.93 |
| 58.18 | 21.66 | 2.31 | 5.14 | 11.88 | 0.83 |
EUROSTAT, 2023; SORS, 2023; calculations by AIS
| Plant production[%] | Livestock breeding[%] | Mixed livestock breeding[%] | Mixed plant production[%] | Mixed livestock breeding – plant production[%] | Non-classified farms[%] | |
|---|---|---|---|---|---|---|
| 2010 | 18.47 | 58.27 | 5.59 | 3.75 | 13.92 | 0 |
| 2020 | 28.36 | 49.58 | 3.12 | 5.45 | 13.49 | 0 |
| 2010 | ||||||
| 2020 | 47.81 | 32.68 | 3.58 | 3.12 | 12.16 | 0.65 |
| 50.97 | 33.42 | 2.09 | 3.32 | 10.05 | 0.16 |
EUROSTAT, 2023; SORS, 2023; calculations by AIS
| Plant production[%] | Livestock breeding[%] | Mixed livestock breeding[%] | Mixed plant production[%] | Mixed livestock breeding – plant production[%] | Non-classified farms[%] | |
|---|---|---|---|---|---|---|
| 2010 | 18.19 | 60.26 | 5.23 | 3.45 | 12.86 | 0 |
| 2020 | 29.82 | 50.35 | 2.76 | 5.51 | 11.56 | 0 |
| 2010 | ||||||
| 2020 | 41.19 | 43.60 | 3.90 | 2.88 | 8.43 | 0 |
| 43.45 | 44.21 | 2.30 | 3.31 | 6.73 | 0 |
Goals
- Slovenia needs a structure of agricultural holdings that will be economically efficient, environmentally sustainable and which will preserve natural resources and vital countryside.
- The main objectives of agricultural policy are to improve the size structure of agricultural holdings, to ensure food security and to improve labour productivity on agricultural holdings.
Comment
Specialization as a development factor does not occupy a significant place in the strategic and program documents of European agricultural policy. Moreover, in most documents, in connection with the intensification, it is mentioned as one of the agricultural factors that most negatively affect the quality of the environment. These impacts are most pronounced in land use change, which can lead to lower plant and animal diversity.
Due to the increased concentration of production within a small and limited number of agricultural products, management systems and the intensity of land use can change significantly. Although specialization in some cases (e.g. focus on extensive cattle and small ruminant farming in mountainous and other areas with limited factors) can improve the environmental conditions for the conservation of high natural value agricultural land, most environmental as well as agricultural strategic documents point to the impending the danger of over-specialization in agriculture.
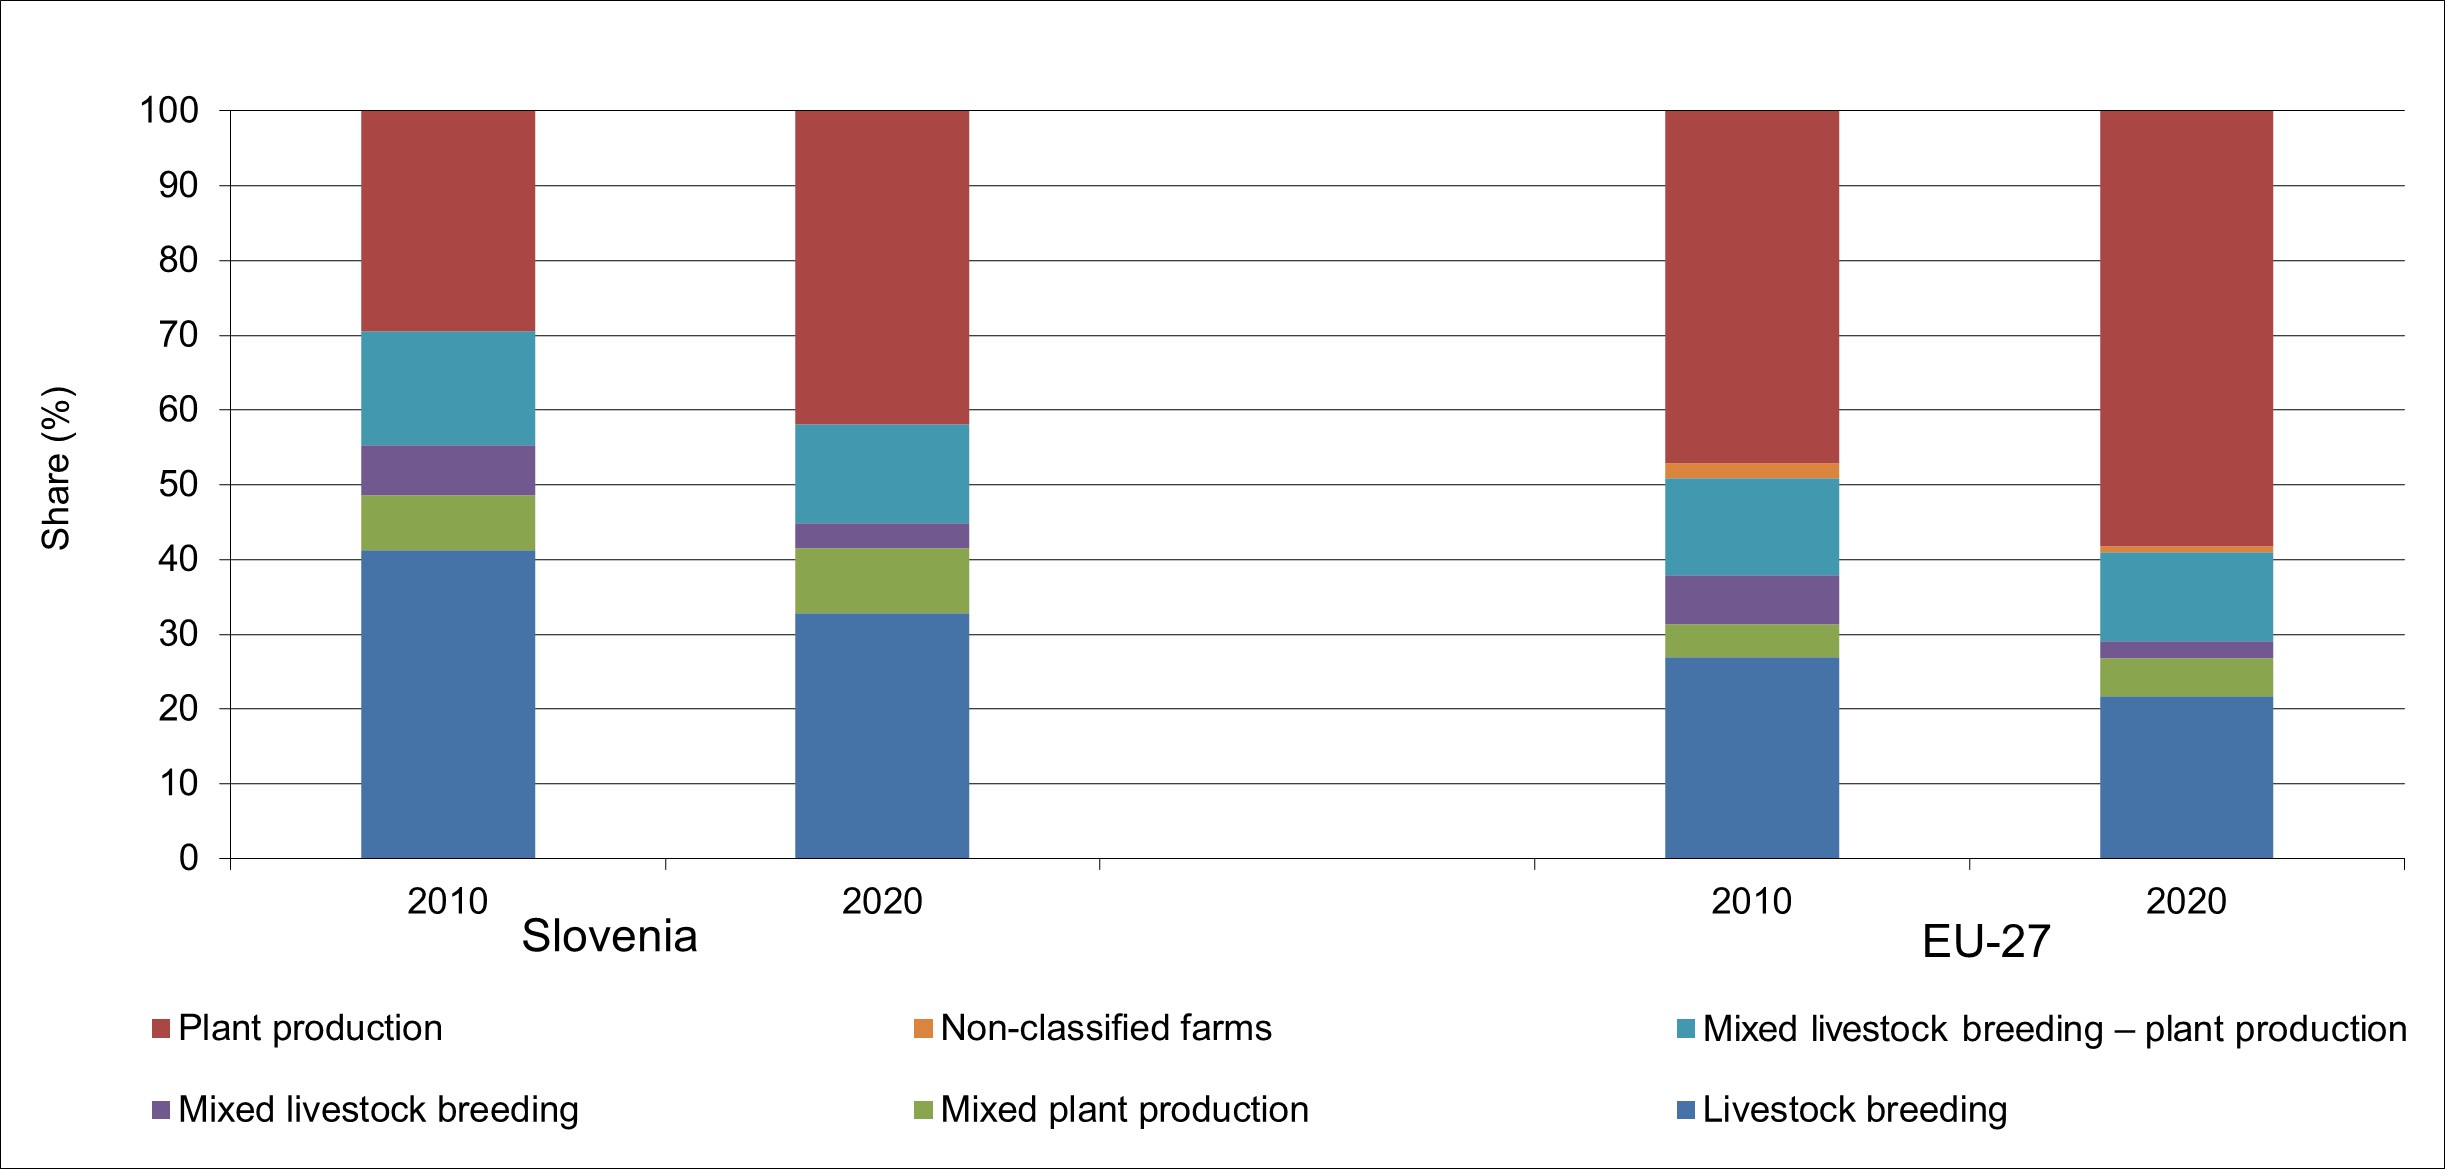
In EU-27 Slovenia belongs among countries with a relatively low degree of specialization in agriculture. In 2020, 75 % of agricultural holdings were directed on a specific type of plant or livestock production, which is 4 percentage points more than in 2010.
There were slightly more than 29 thousand owners specializing in a certain type of crop production, which is 30 % more than in 2010. The number of farms engaged in the production of grain, oilseeds and protein plants increased by 34 % and holdings which are aimed at growing permanent plantations increased by 27 %. At the level of the European Union, the number of specialized agricultural holdings, which are oriented towards plant production, decreased by 7 %. The biggest decrease was in Bulgaria, where there were 43 % fewer of agricultural holdings than in 2010. On the other hand, in the Czech Republic, the number of agricultural holdings focused on crop production increased sharply (+56) in the period 2010-2020.
In 2020, slightly more than 22 thousand agricultural holdings were involved in a certain type of livestock production, which was 27% less than in 2010. A similar trend of concentration of livestock production is characteristic of most EU member states. At the level of the entire European Union, the number of specialized livestock farms decreased by 40 % in the period between 2010 and 2020. The largest decline in the number of livestock farms was experienced by Hungary (-79%), Croatia (-67%) and Bulgaria (-64%).
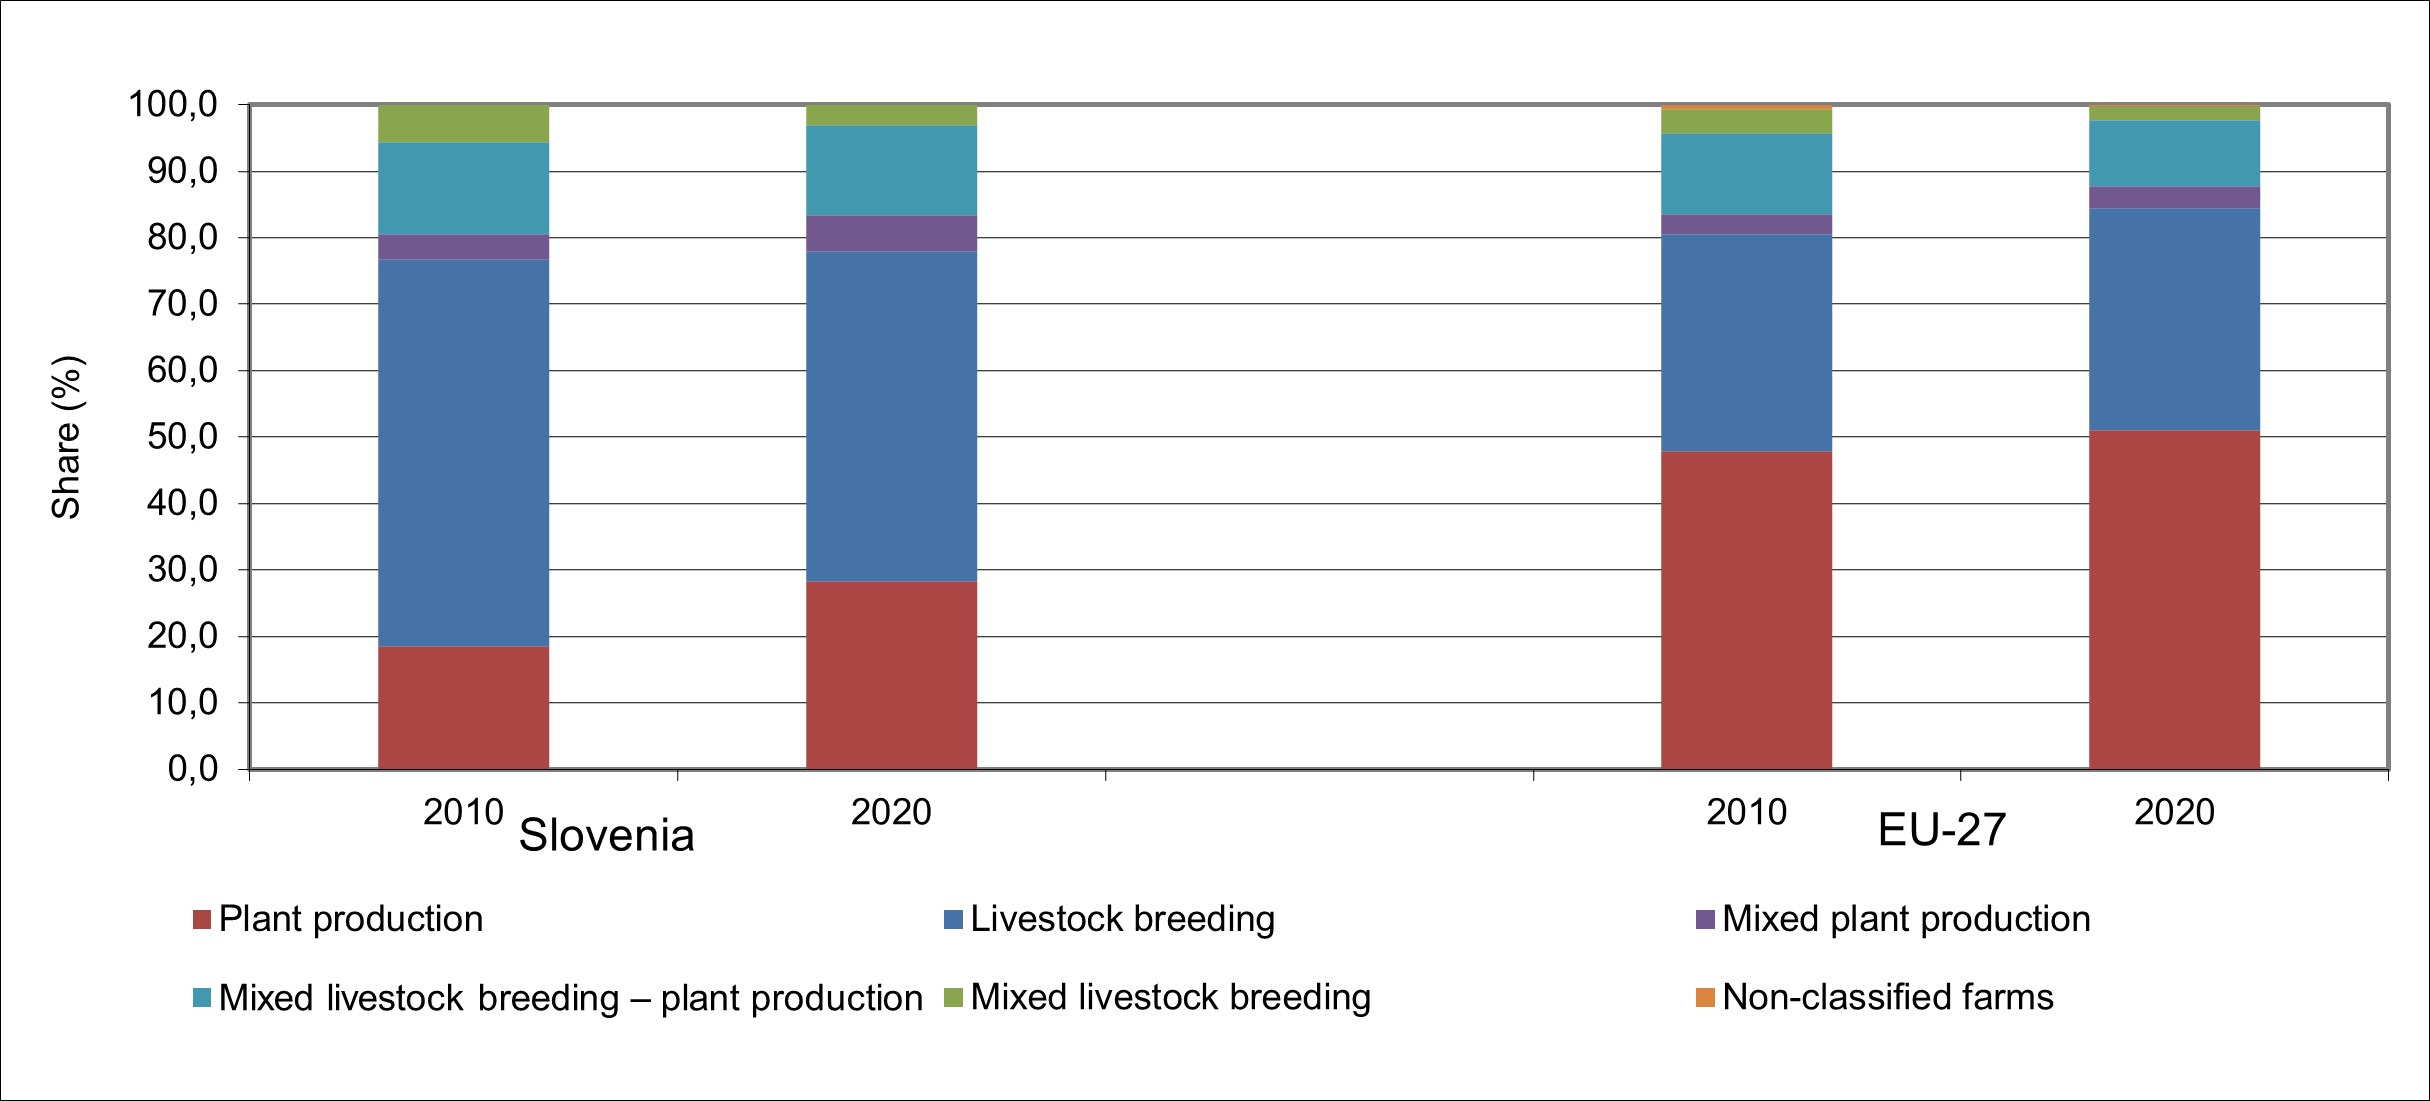
In 2020, specialized agricultural holdings managed more than three quarters (78 %) of the utilized agricultural area in Slovenia, which is one percentage points more than in 2010. Within the framework of the entire specialized crop production, more than a quarter (28%) of all agricultural land was in use in 2020, which is 10 percentage points more than in 2010. The area of agricultural land in use, cultivated by these agricultural holdings, increased by more than half (+54%) in the period 2010-2020.
The area of agricultural land cultivated by specialized livestock farms decreased from 276 thousand hectares to 235 thousand ha, and its share in the entire KZU from 58% in 2010 to 50% in 2020. Almost half (48%) of all UAA is used by agricultural holdings that are aimed at grazing livestock.
In 2020, in the EU-27 countries, specialized agricultural holdings cultivated 84% of all UAA which is four percentage points more than in 2010. The biggest share has Ireland (97%), Finland (94%) and Bulgaria with 93%, while in the Czech Republic specialized farms cultivated 63% of all UAA. In the period 2010-2020, the area cultivated by the holdings specialized in crop production increased by 4%. The increase was greatest in Luxembourg (+87%), while in Greece decreased by 53%. In 2020, the area of UAA cultivated by specialized livestock farms in the EU-27 amounted to almost 52 million hectares and practically did not change between 2010 and 2020. During the considered period, the area increased the most in Bulgaria (+190%), while the decrease was most pronounced in Croatia (-32%).
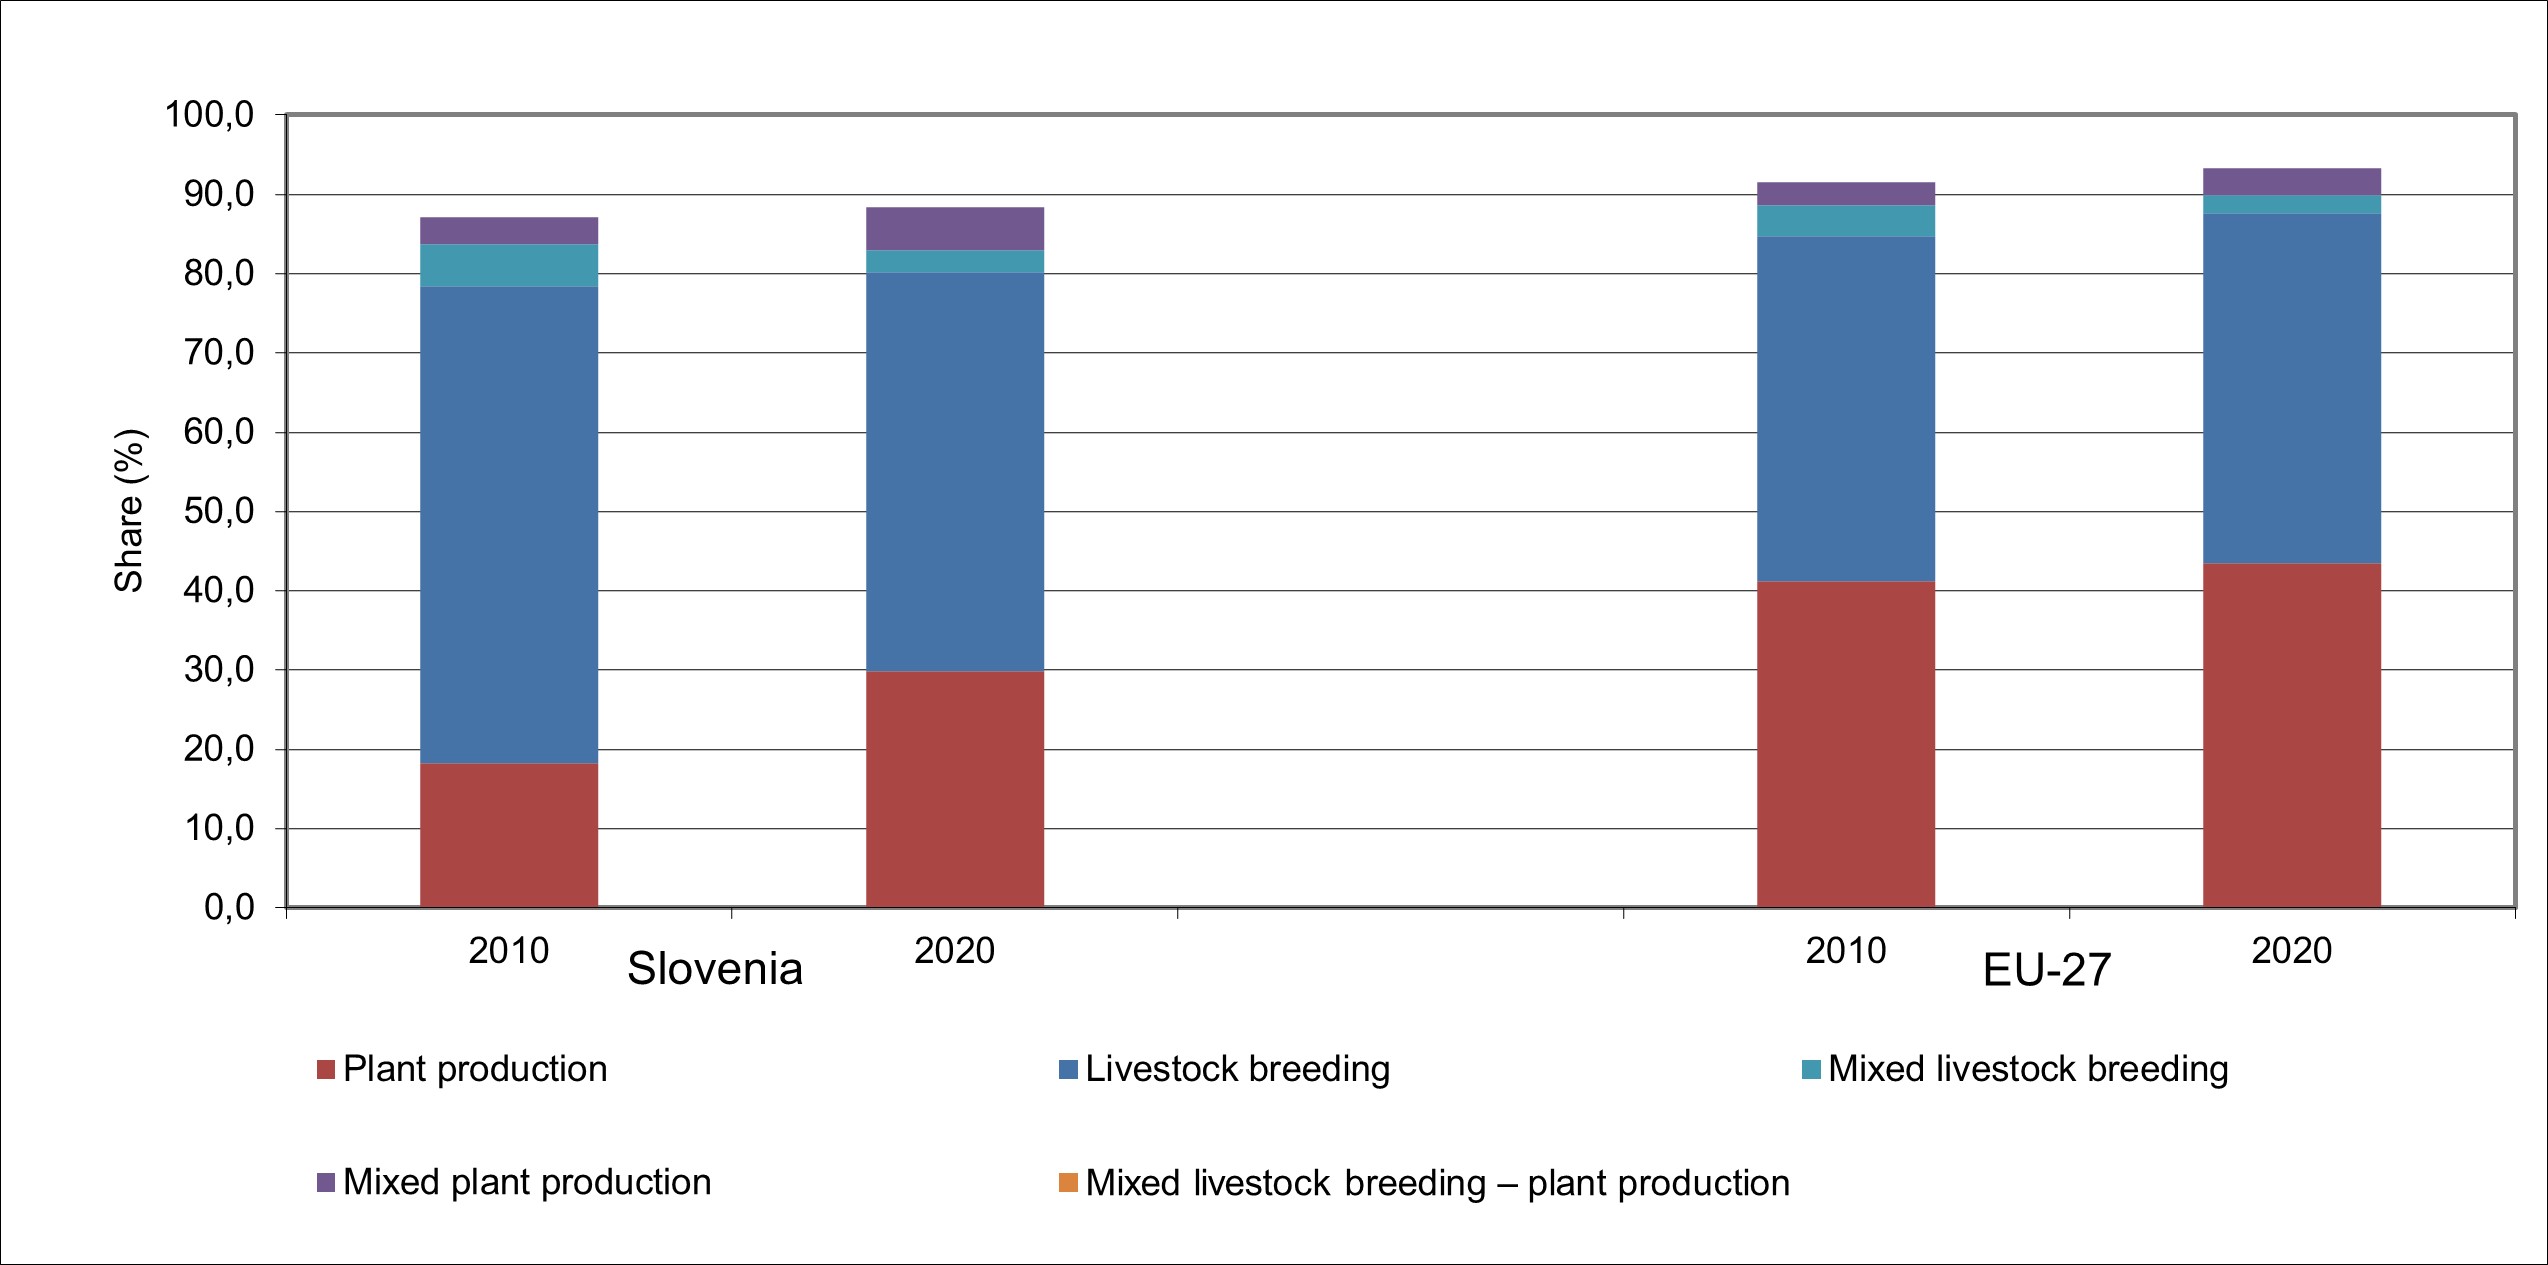
Agricultural holdings in Slovenia achieved a total standard output of EUR 1.15 billion in 2020, which is a quarter more than in 2010, when they achieved slightly more than EUR 913 million. Standard income is the gross production of agricultural holdings expressed in terms of value, which does not include subsidies. As much as 80 % of all standard income was contributed by specialized agricultural holdings, of which the largest number of holdings were focused on raising grazing livestock (26%). Compared to the year 2010, the share of the standard income of specialized agricultural holdings increased by two percentage points.
Agricultural holdings in the EU-27 generated a total of EUR 360 billion in standard income in 2020, which is a quarter more than in 2010, when they generated just under EUR 288 billion. In 2020, as much as 88% of the income was achieved by specialized agricultural holdings, which is three percentage points more than in 2010. The largest share of income is generated by specialized agricultural holdings in Ireland (97%) and Denmark (94%), and the least in the Czech Republic, where specialized agricultural holdings only 64% of all income.


