[OP09] Public attitude towards battery-powered electric vehicles and plug-in hybrids

Key message

Although a quarter of the newly registered personal cars in Slovenia are electric or hybrid, their share among all personal vehicles is only around 3%. This is due to the fact that households rarely decide to purchase new cars, resulting in a high average age of cars over 10 years, and it will take a long time for our vehicle fleet to become less energy-intensive. Slovenia ranks in the bottom quarter of European countries by the share of first registrations of new personal electric vehicles.
Charts
Survey on Energy Efficiency in Slovenia, Informa Echo d.o.o., 2022 (20. 06. 2022)
| 0[%] | 1[%] | 2[%] | 3 or more[%] | |
|---|---|---|---|---|
| 2010 | 14 | 45 | 30 | 11 |
| 2011 | 15 | 45 | 29 | 11 |
| 2012 | 20 | 43 | 25 | 12 |
| 2015 | 8 | 51 | 33 | 8 |
| 2017 | 4 | 48 | 37 | 10 |
| 2019 | 9 | 49 | 32 | 9 |
| 2022 | 7.72 | 49.44 | 31.96 | 9.74 |
Survey on Energy Efficiency in Slovenia, Informa Echo d.o.o., 2022 (20. 06. 2022)
| up to 690 EUR[%] | 691 EUR-1,380 EUR[%] | 1,381 EUR - 2,070 EUR[%] | 2,071 EUR - 2,760 EUR[%] | above 2,761 EUR[%] | I don't know, no answer[%] | |
|---|---|---|---|---|---|---|
| 2010 | 43 | 11 | 3 | 0 | 0 | 0 |
| 2011 | 51 | 21 | 3 | 0 | 0 | 0 |
| 2012 | 50 | 15 | 4 | 2 | 0 | 0 |
| 2015 | 39 | 11 | 1 | 0 | 0 | 0 |
| 2017 | 14 | 8 | 1 | 0 | 0 | 0 |
| 2019 | 22 | 13 | 2 | 5 | 3 | 0 |
| 2022 | 23.49 | 10.22 | 4.06 | 1.93 | 2.60 | 13 |
Survey on Energy Efficiency in Slovenia, Informa Echo d.o.o., 2022 (20. 06. 2022)
| up to 2 years[%] | 2-4 years[%] | 5-9 years[%] | 10-14 years[%] | 15+ years[%] | I don't know[%] | |
|---|---|---|---|---|---|---|
| 2010 | 12 | 30 | 48 | 28 | 13 | 0 |
| 2011 | 9 | 31 | 47 | 41 | 15 | 1 |
| 2012 | 7 | 28 | 49 | 44 | 15 | 1 |
| 2015 | 11 | 23 | 46 | 41 | 19 | 1 |
| 2017 | 11 | 21 | 45 | 41 | 24 | 1 |
| 2019 | 13.61 | 24.57 | 46.23 | 45.07 | 30.67 | 0 |
| 2022 | 11.16 | 28.89 | 44.08 | 40.94 | 32.89 | 8.33 |
Survey on Energy Efficiency in Slovenia, Informa Echo d.o.o., 2022 (20. 06. 2022)
| Unlikely, Very unlikely, Completely unlikely[%] | Likely, Very likely, Definitely[%] | |
|---|---|---|
| 2010 | 92 | 9 |
| 2011 | 90 | 10 |
| 2012 | 93 | 6 |
| 2015 | 88 | 10 |
| 2017 | 79 | 19 |
| 2019 | 78 | 16 |
| 2022 | 78 | 17 |
Survey on Energy Efficiency in Slovenia, Informa Echo d.o.o., 2022 (20. 06. 2022)
| Unlikely, Very unlikely, Completely unlikely[%] | Likely, Very likely, Definitely[%] | |
|---|---|---|
| 2010 | 88 | 12 |
| 2011 | 95 | 5 |
| 2012 | 95 | 6 |
| 2015 | 89 | 9 |
| 2017 | 82 | 15 |
| 2019 | 84 | 10 |
| 2022 | 88 | 7 |
EUROSTAT (2021)
| 2021[%] | |
|---|---|
| Norway | 63.74 |
| Iceland | 26.90 |
| Netherlands | 19.75 |
| Switzerland | 19.18 |
| Sweden | 18.95 |
| Liechtenstein | 17.95 |
| Austria | 13.91 |
| Germany | 13.58 |
| Denmark | 13.33 |
| Finland | 10.31 |
| France | 9.84 |
| Portugal | 9.24 |
| Ireland | 8.47 |
| Malta | 7.92 |
| Belgium | 5.80 |
| Romania | 5.23 |
| Lithuania | 4.53 |
| Hungary | 3.53 |
| Latvia | 3.28 |
| Slovenia | 3.26 |
| Croatia | 3.18 |
| Spain | 2.81 |
| Estonia | 2.15 |
| Cyprus | 0.74 |
| Poland | 0.51 |
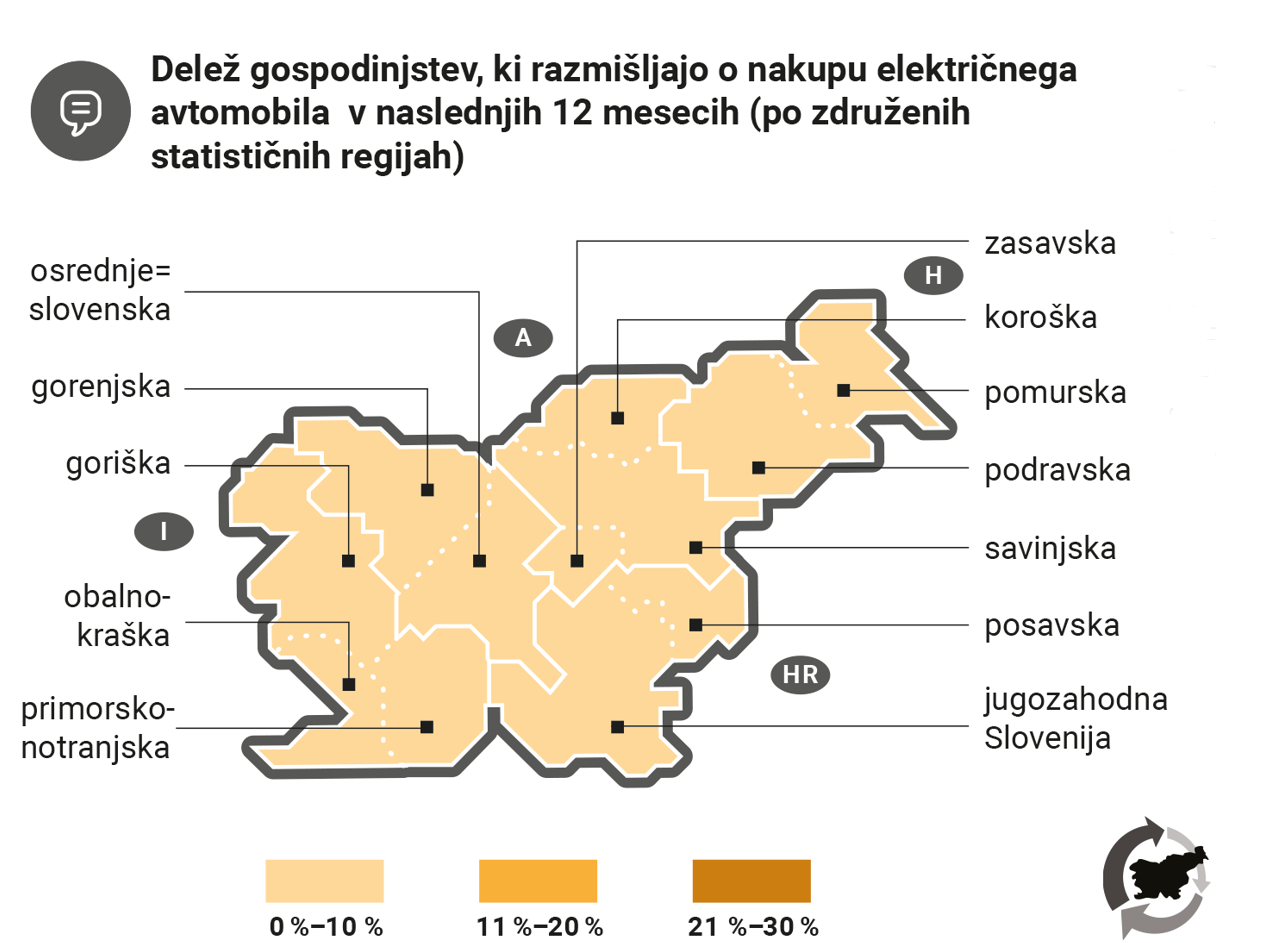
Survey on Energy Efficiency in Slovenia, Informa Echo d.o.o., 2022 (20. 06. 2022)
| 2019 | 2022 | |
| 2019 | 2022 | |
| pomurska, podravska | 15 (N=213) | 7 (N=209) |
| koroška, savinjska, zasavska | 9 (N=187) | 10 (N=181) |
| posavska, jugovzhodna Slovenija | 5 (N=99) | 8 (N=102) |
| osrednjeslovenska, gorenjska | 11 (N=351) | 6 (N=359) |
| primorsko-notranjska, obalno-kraška, goriška | 7 (N=137) | 8 (N=135) |


