[KM34] The Concentration of Agricultural Production

Key message

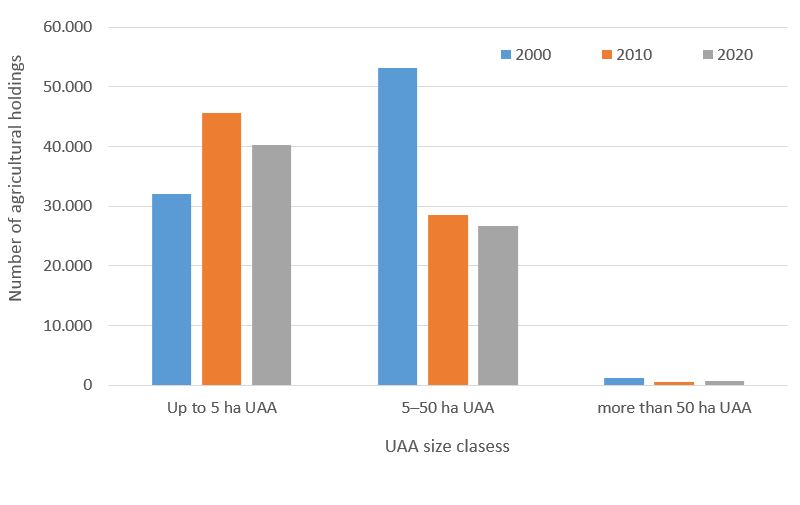
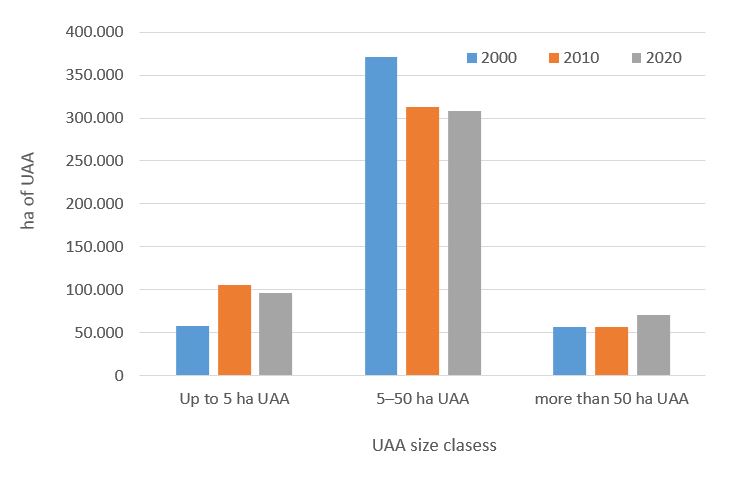
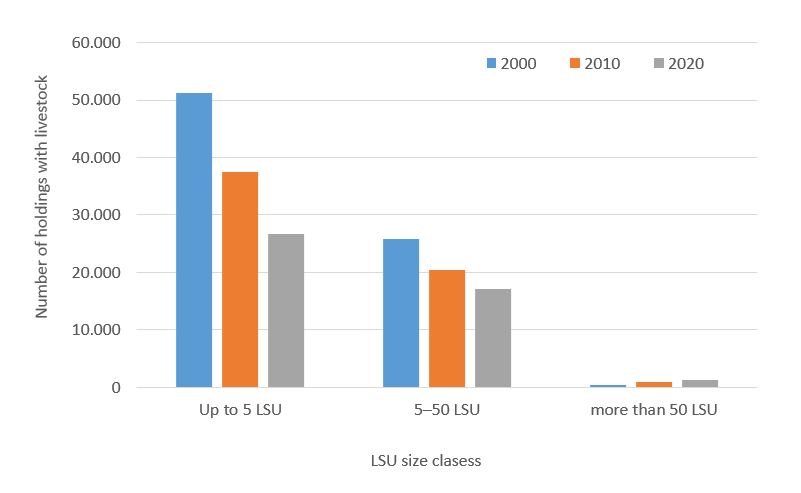
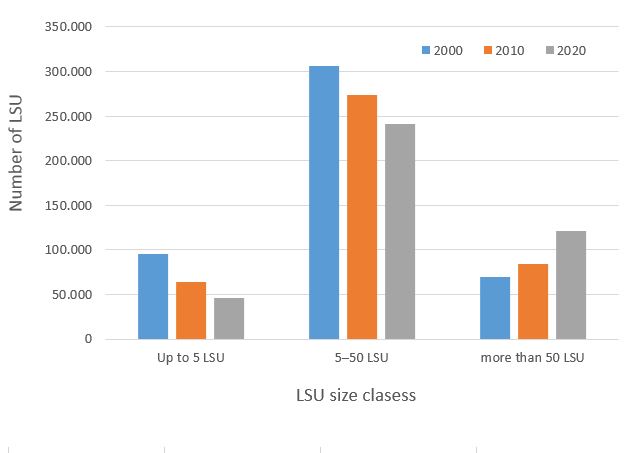
Changes in the size structure show that concentration processes are continuing regarding the extent of the agricultural land, while in the area of the livestock production these processes have slowed down. Nevertheless, due to its small size on average, the competitiveness of Slovenian farms is low compared to the EU–27 countries. Despite the structural changes, Slovenia lags behind the EU–27 average by about twice in terms of the size of agricultural holdings and in terms of the productivity and thus is ranked in the group of EU member states with the most unfavourable agricultural structure. The gap with countries with more developed agriculture is not narrowing. As many as 60% of agricultural holdings still manage less than five hectares of agricultural land, and more than a fifth of all agricultural land is in use in this size class. However, it should be pointed out, that fostering competitiveness and increasing the concentration of agricultural production may result in a reduction in biodiversity and an increase pressure on the environment.
Definition
The indicator shows changes in the size structure of agricultural holdings according to their physical or economic size. The concentration of agricultural production is mainly affected by changes in the number of agricultural holdings, land use changes, changes in the number of livestock on livestock holdings, the volume of labour input and changes in the economic size of agricultural holdings. The average size of agricultural holdings in Slovenia and the EU–27 countries that cultivate Utilised Agricultural Area and the average number of livestock units (LSU) on agricultural holdings with livestock are shown. Changes in labour and economic size on agricultural holdings are also shown.
Charts
SORS, 2023; calculations by AIS
| 2000 [number] | 2010 [number] | 2020 [number] | |
|---|---|---|---|
| Average size UAA/agricultural holding | 5.60 | 6.40 | 7 |
| Up to 5 ha UAA | 32093 | 45537 | 40272 |
| 5–50 ha UAA | 53109 | 28466 | 26648 |
| more than 50 ha UAA | 1221 | 452 | 656 |
| Total | 86423 | 74455 | 67576 |
SORS, 2023; calculations by AIS
| 2000 [ha] | 2010 [ha] | 2020 [ha] | |
|---|---|---|---|
| Up to 5 ha UAA | 58367 | 105162 | 96482 |
| 5–50 ha UAA | 370613 | 312521 | 307846 |
| more than 50 ha UAA | 56900 | 56750 | 70305 |
| Total | 485880 | 474433 | 474633 |
SORS, 2023; calculations by AIS
| 2000 [number] | 2010 [number] | 2020 [number] | |
|---|---|---|---|
| Average size LSU/agricultural holding | 6.10 | 7.20 | 9.10 |
| Up to 5 LSU | 51268 | 37459 | 26633 |
| 5–50 LSU | 25733 | 20336 | 17133 |
| more than 50 LSU | 451 | 853 | 1210 |
| Total | 77452 | 58648 | 44976 |
SORS, 2023; calculations by AIS
| 2000 [number] | 2010 [number] | 2020 [number] | |
|---|---|---|---|
| Up to 5 LSU | 95286 | 63680 | 46331 |
| 5–50 LSU | 305847 | 273645 | 241030 |
| more than 50 LSU | 69365 | 84227 | 121323 |
| Total | 470498 | 421552 | 408684 |
SORS, 2023; calculations by AIS
| 2007 [number] | 2010 [number] | 2020 [number] | |
|---|---|---|---|
| Average size SO/holding | 11747 | 12234 | 16791 |
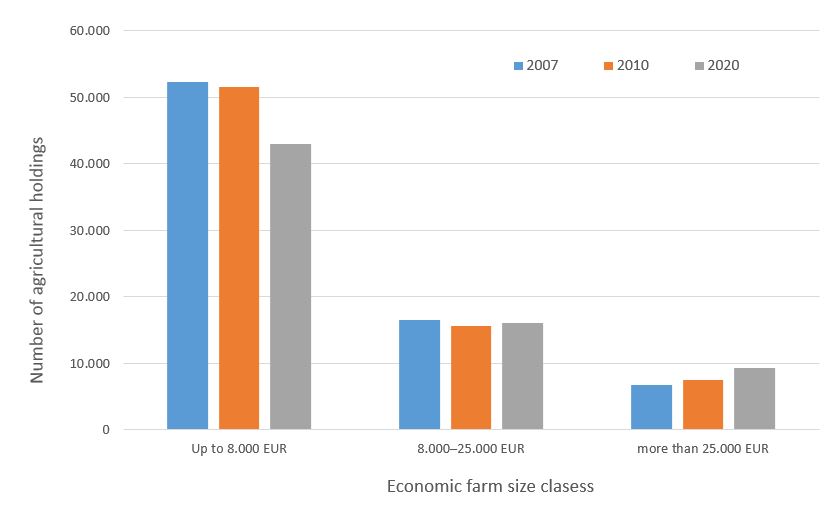
| Up to 8.000 EUR | 52267 | 51461 | 43026 |
| 8.000–25.000 EUR | 16417 | 15644 | 16039 |
| more than 25.000 EUR | 6654 | 7541 | 9266 |
| Total | 75338 | 74646 | 68331 |
SORS, 2023; calculations by AIS
| 2007 [number] | 2010 [number] | 2020 [number] | |
|---|---|---|---|
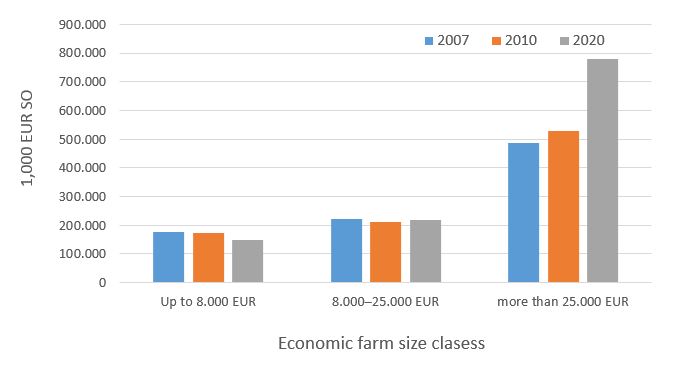
| Up to 8.000 EUR | 174903 | 173782 | 149535 |
| 8.000–25.000 EUR | 222471 | 210709 | 219550 |
| more than 25.000 EUR | 487621 | 528703 | 778259 |
| Total | 884995 | 913194 | 1147345 |
SORS, 2023; Eurostat, 2023; calculations by AIS
| 2000 [%] | 2010 [%] | 2020 [%] | |
|---|---|---|---|
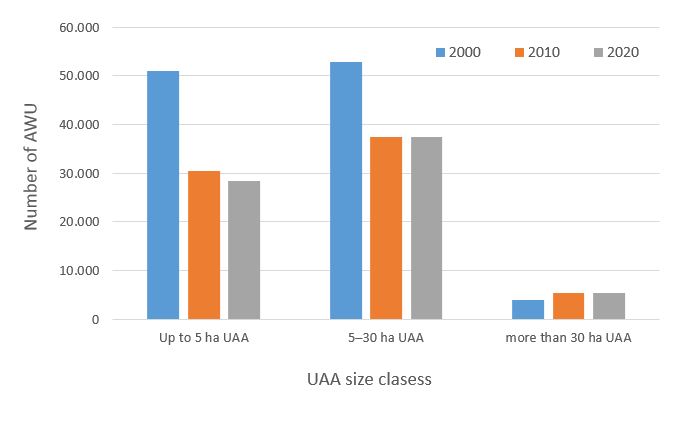
| Up to 5 ha UAA | 51049 | 30360 | 28400 |
| 5–30 ha UAA | 52812 | 37510 | 37380 |
| more than 30 ha UAA | 3949 | 5440 | 5280 |
| Total | 107809 | 73310 | 71060 |
Eurostat, 2023; calculations by AIS
| Number of agricultural holdings[number] | Utilised agricultural area (ha)[number] | Number of holdings with livestock[number] | Number of LSU[number] | Economic size (000 EUR)[number] | Annual work units[number] | |
|---|---|---|---|---|---|---|
| Austria | 110780 | 2602670 | 78510 | 2236900 | 6626081190 | 120680 |
| Belgium | 36000 | 1368120 | 21840 | 3665020 | 8406651210 | 52210 |
| Bulgaria | 132740 | 4564150 | 62010 | 1047600 | 4091460260 | 181590 |
| Cyprus | 34050 | 134140 | 8140 | 231720 | 876760130 | 20250 |
| Czechia | 28910 | 3492570 | 16260 | 1624620 | 5535907980 | 94200 |
| Denmark | 37090 | 2629930 | 17130 | 4178590 | 10100137170 | 85630 |
| Estonia | 11370 | 975320 | 4160 | 293740 | 842915910 | 16630 |
| Finland | 45630 | 2281710 | 11850 | 950680 | 3256136830 | 55560 |
| France | 393030 | 27364630 | 192810 | 20647850 | 64325069630 | 670850 |
| Greece | 530680 | 2822890 | 124200 | 1962840 | 7743698730 | 570480 |
| Croatia | 143920 | 1231500 | 81790 | 756340 | 2015756160 | 160390 |
| Ireland | 130190 | 4498990 | 118800 | 6331890 | 6850754710 | 155010 |
| Italy | 1130530 | 12041230 | 191390 | 9809120 | 56615307350 | 849140 |
| Latvia | 68980 | 1968960 | 25900 | 478680 | 1356197120 | 66760 |
| Lithuania | 132080 | 2914550 | 71290 | 721590 | 2299322480 | 112910 |
| Luxembourg | 1880 | 132140 | 1360 | 163260 | 323951150 | 3590 |
| Hungary | 232060 | 4921740 | 110220 | 2097960 | 7069213250 | 242490 |
| Malta | 7650 | 9800 | 1750 | 32060 | 85994190 | 4690 |
| Germany | 262560 | 16300940 | 154130 | 16300940 | 46611719680 | 469910 |
| Netherlands | 52640 | 1817900 | 31490 | 6280230 | 24873826630 | 151210 |
| Poland | 1301490 | 14749240 | 552110 | 10210120 | 26842209120 | 1392420 |
| Portugal | 290230 | 3963940 | 143830 | 2504110 | 7001031590 | 303860 |
| Romania | 2887070 | 12762830 | 1803910 | 4419960 | 12093620810 | 1143700 |
| Slovakia | 19630 | 1862650 | 10700 | 608600 | 1992286810 | 41840 |
| Slovenia | 68331 | 483440 | 44030 | 488370 | 1154367140 | 71060 |
| Spain | 914870 | 23913680 | 169400 | 16819280 | 45132239380 | 827470 |
| Sweden | 58790 | 3005810 | 22450 | 1652290 | 5644707460 | 53180 |
Eurostat, 2023; calculations by AIS
| Average size of agricultural holdings[ha] | Average number LSU/holding[number] | AWU/ha UAA[number] | AWU/ agricultural holding[number] | Average size of economic size[EUR] | |
|---|---|---|---|---|---|
| Austria | 23.49 | 28.49 | 0.05 | 1.09 | 59812.97 |
| Belgium | 38 | 167.81 | 0.04 | 1.45 | 233518.09 |
| Bulgaria | 34.38 | 16.89 | 0.04 | 1.37 | 30823.11 |
| Cyprus | 3.94 | 28.47 | 0.15 | 0.59 | 25749.20 |
| Czechia | 120.81 | 99.92 | 0.03 | 3.26 | 191487.65 |
| Denmark | 70.91 | 243.93 | 0.03 | 2.31 | 272314.29 |
| Estonia | 85.78 | 70.61 | 0.02 | 1.46 | 74135.08 |
| Finland | 50 | 80.23 | 0.02 | 1.22 | 71359.56 |
| France | 69.62 | 107.09 | 0.02 | 1.71 | 163664.53 |
| Greece | 5.32 | 15.80 | 0.20 | 1.07 | 14592.03 |
| Croatia | 8.56 | 9.25 | 0.13 | 1.11 | 14006.09 |
| Ireland | 34.56 | 53.30 | 0.03 | 1.19 | 52621.21 |
| Italy | 10.65 | 51.25 | 0.07 | 0.75 | 50078.55 |
| Latvia | 28.54 | 18.48 | 0.03 | 0.97 | 19660.73 |
| Lithuania | 22.07 | 10.12 | 0.04 | 0.85 | 17408.56 |
| Luxembourg | 70.29 | 120.04 | 0.03 | 1.91 | 172314.44 |
| Hungary | 21.21 | 19.03 | 0.05 | 1.04 | 30462.87 |
| Malta | 1.28 | 18.32 | 0.48 | 0.61 | 11241.07 |
| Germany | 62.08 | 105.76 | 0.03 | 1.79 | 177527.88 |
| Netherlands | 34.53 | 199.44 | 0.08 | 2.87 | 472527.10 |
| Poland | 11.33 | 18.49 | 0.09 | 1.07 | 20624.21 |
| Portugal | 13.66 | 17.41 | 0.08 | 1.05 | 24122.36 |
| Romania | 4.42 | 2.45 | 0.09 | 0.40 | 4188.89 |
| Slovakia | 94.89 | 56.88 | 0.02 | 2.13 | 101491.94 |
| Slovenia | 7.07 | 11.09 | 0.15 | 1.04 | 16893.75 |
| Spain | 26.14 | 99.29 | 0.03 | 0.90 | 49331.86 |
| Sweden | 51.13 | 73.60 | 0.02 | 0.90 | 96014.76 |
Goals
- Slovenia needs a structure of agricultural holdings that will be economically efficient, environmentally sustainable and which will preserve natural resources and vital countryside.
- The main objectives of agricultural policy are to improve the size structure of agricultural holdings, to ensure food security and to improve labour productivity on agricultural holdings.
Comment
According to the data from the latest survey of the structure of agricultural holdings, in 2020 slightly more than 68 thousand agricultural holdings were engaged in agricultural activity in Slovenia. Compared to the year 2010, their number decreased by about a fifth or slightly more than 18 thousand agricultural holdings. In 2020, agricultural holdings used slightly less than 475 thousand hectares of Utilized Agricultural Area (UAA), which is around two percent less than in the year 2000. The average size of agricultural holdings in Slovenia in 2020 was 7.0 hectares of UAA per holding, which is a quarter more than in the year 2000, when it was 5.6 hectares of UAA / holding.
The process of concentration of agricultural land is also indicated by the changes in the size structure of agricultural holdings. The number of holdings with up to 5 hectares of UAA is decreasing. In this size class there are 40.272 agricultural holdings or. 60% of all agricultural holdings in Slovenia. These holdings cultivate 96.482 hectares of UAA, which represents 20.5% of all UAA. On the contrary, in the period 2010-2020 the number of holdings in the size class above 50 ha of UAA and the agricultural land cultivated by these holdings increased significantly. In 2020, there were 656 agricultural holdings, which cultivated more than 70 thousand hectares of UAA, which is a quarter more than in 2010.
In 2020, slightly less than 45,000 agricultural holdings in Slovenia were engaged in livestock production, which is 13,672 holdings or almost a quarter (23%) less than in the year 2010. These holdings together reared slightly more than 408,000 head of livestock units (LSU), which is 3% less than in the year 2000. Livestock holdings reared on average 9.1 LSU, which is 26% more than in the year 2010, when they reared 7.2 LSU per holding. n the period 2010–2020, the number of holdings in the size class over 50 LSU increased from 852 to 1,210, or by 42%. In the year 2020 these holdings reared 121 thousand LSU, which is almost a quarter of all LSU. In 2020, 30% of all LSU were reared on farms in this size class, which is almost 10 percentage points more than in the year 2010.
In the year 2020, the input of work in the Slovenian agriculture, including seasonal and occasional employment and machine services, expressed in Annual Work Units (AWU), amounted to 71,060 AWU. This is three percent less than at the Agricultural census 2010. Farm Structure Survey. The average number of AWU per agricultural holding in 2020 was 1.04 PDM/holding, while in 2010 it was 0.98 AWU/holding. In the year 2000, the input of labour per unit of utilized agricultural area was 15 AWU/100 hectares of UAA which is 0.5 AWU less than in 2010. Due to a change in methodology, data on the workforce are not directly comparable.
In the year 2020, Slovenian agricultural holdings achieved a total standard income of EUR 1.15 billion. Almost two thirds (63%) of agricultural holdings were in the size classes up to EUR 8,000, which is six percentage points less than in 2010. These agricultural holdings together generated 13% of standard income. In 2010, agricultural holdings in this size classes generated almost 20% of standard income. In 2020, just under a quarter (23%) of households and 19% of standard income were in economic size classes between EUR 8,000 and EUR 25,000. In 2010, farms in this size class generated almost a quarter (23%) of standard income. In 2007, agricultural holdings in this size classes generated almost 25% of standard income. In the year 2020, only around tenth of agricultural holdings (14%) reached an economic size of over EUR 25,000, and two thirds of standard income witch is ten percentage points more than in 2010.
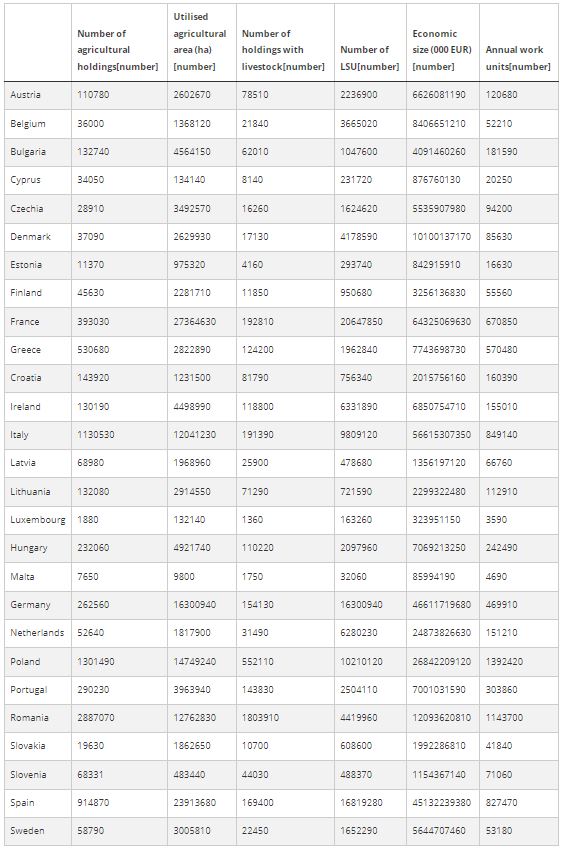
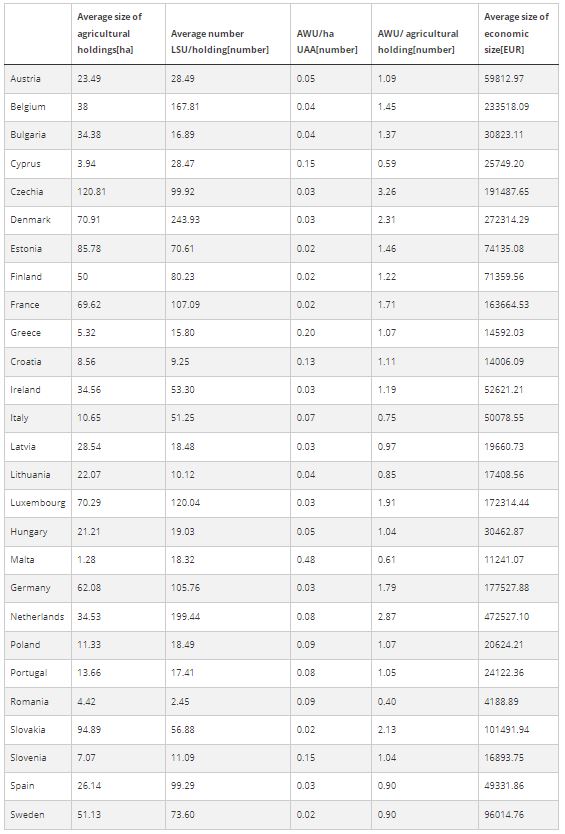
In the year 2020, the average agricultural holding in the EU–27 cultivated 17,1 hectares of UAA. The largest agricultural holdings are in the Czech Republic, where they cultivate an average of 121 hectares per agricultural holding, followed by the Slovakia (with 95 ha of UAA) and Estonia, where they cultivate an average of 86 hectares of UAA per agricultural holding. The smallest agricultural holdings are in Malta, where they cultivate on average only slightly more than one hectare of UAA per holding, and in Cyprus and Romania, where they cultivate just around four hectares of UAA.
In the year 2020, 4.1 million agricultural holdings were engaged in livestock farming in the EU-27, which is 45% of all those engaged in agricultural production. Together, they reared just over 117 million heads of livestock. In 2020, livestock farms in the EU–27 reared an average of 28.6 LSU, which is almost three times more than in Slovenia. In terms of concentration, traditional livestock countries, such as Denmark, the Netherlands, Belgium and Luxembourg, are in the forefront, with an average of more than 120 LSU per agricultural holding.
In the EU–27, slightly less than 8 million AWU worked on agricultural holdings in 2020. The average agricultural holding in the EU–27 employs 0.87 AWU. The Czech Republic has the highest number of AWUs per agricultural holding (3.3 AWUs), followed by the Netherlands (2.9 AWUs) and Slovakia (2.1 AWUs). Compared to the EU–27, Slovenia also has above-average employment on agricultural holdings (1.04 AWUs). The lowest employment is in Romania, where on average 0.4 AWU are employed per agricultural holding.
In 2020, the average economic size, measured by standard income per agricultural holding, in the EU–27 was EUR 39,695. Among EU–27 countries, the Netherlands leads with almost EUR 473 thousand per agricultural holding, while in Romania the average economic size is just over over EUR 4,000 per holding. With just under EUR 17,000 per agricultural holding, Slovenia is one of the EU member states that lag far behind the EU–27 average.
A comparison of the data the Census of agricultural holdings from 2010 and 2020 shows that processes of concentration of agricultural production are taking place in Slovenia. Even though the average size, labour productivity and economic size of agricultural holdings improved significantly, we still lag far behind the EU-27 average. Given that structural changes are taking place slowly, the continuation of these trends will not significantly increase the burden on the environment.


