[EN01] Energy-related greenhouse gas emissions

Key message

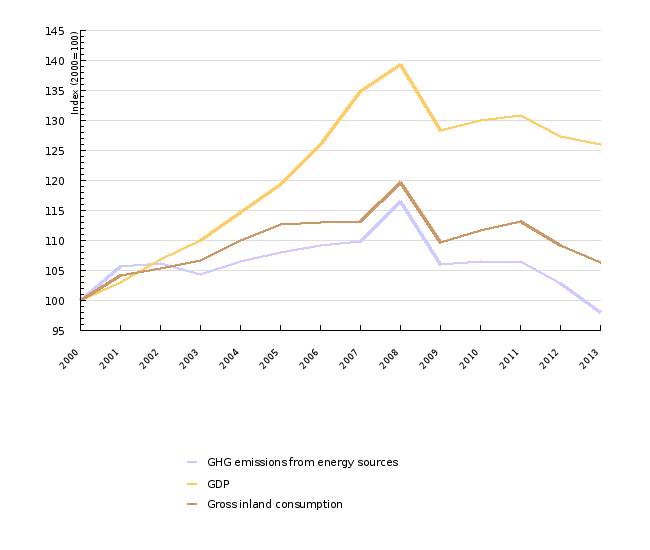
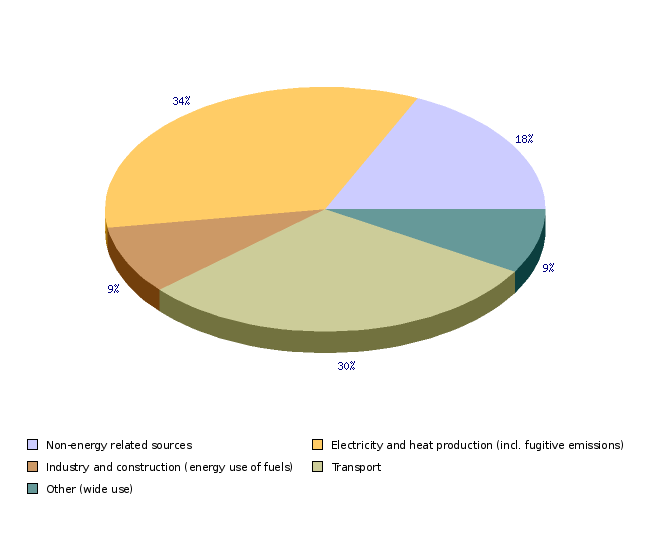
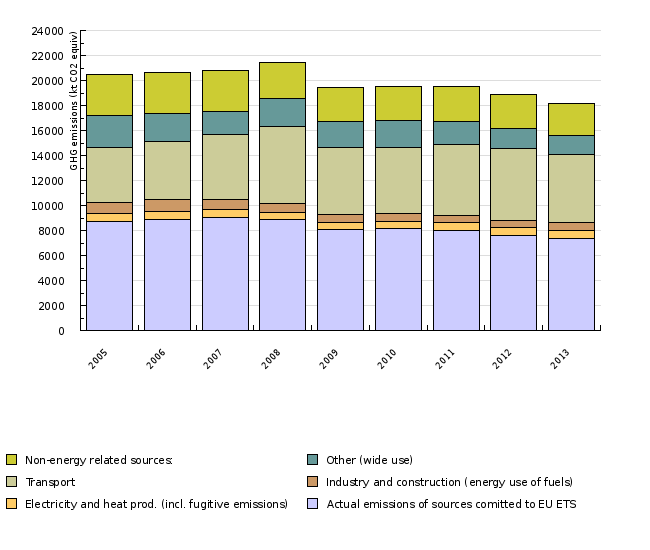
Energy use accounts for 82% of total greenhouse gas emissions in Slovenia. The largest source of emissions is electricity and heat production, followed by transport. After the EU Emission Trading Scheme (EU-ETS) was introduced, only emissions from sources not included in the EU-ETS system have been relevant for achieving the country's goals concerning the reduction of greenhouse gas emissions by 2020. By far the largest source is transport, which accounts for 51%, while all energy-related sources combined account for 76%. In 2013, emissions were 12.5% below the target value for that year.
Definition
The indicator shows past energy-related greenhouse gas emissions (of carbon dioxide (CO2), methane (CH4), nitrous oxide (N2O) and F-gases), Kyoto Protocol targets in the 2008–2012 period and analyses of their trends.
Charts
Slovenian Environment Agency, 2015, Statistical office of RS, 2014, Jožef Stefan Institute-CEU, 2015
| 2000 | 2001 | 2002 | 2003 | 2004 | 2005 | 2006 | 2007 | 2008 | 2009 | ||
|---|---|---|---|---|---|---|---|---|---|---|---|
| GHG emissions from energy sources | kt CO2 equiv | 15183.8 | 16043.9 | 16110.5 | 15838.4 | 16174.2 | 16396.8 | 16575.7 | 16685 | 17697.7 | 16092.2 |
| GDP | mio EUR 2000 | 18902 | 19459.5 | 20206 | 20780.3 | 21684.6 | 22552.6 | 23828.2 | 25482.2 | 26323.2 | 24270.7 |
| Gross inland consumption | ktoe | 6394 | 6665.3 | 6729.7 | 6822.9 | 7029.6 | 7206.8 | 7220.3 | 7233.2 | 7649.7 | 7011.9 |
| GHG emissions from energy sources | 2000=100 | 100 | 105.7 | 106.1 | 104.3 | 106.5 | 108 | 109.2 | 109.9 | 116.6 | 106 |
| GDP | 2000=100 | 100 | 102.9 | 106.9 | 109.9 | 114.7 | 119.3 | 126.1 | 134.8 | 139.3 | 128.4 |
| Gross inland consumption | 2000=100 | 100 | 104.2 | 105.3 | 106.7 | 109.9 | 112.7 | 112.9 | 113.1 | 119.6 | 109.7 |
| 2010 | 2011 | 2012 | 2013 | ||||||||
| GHG emissions from energy sources | kt CO2 equiv | 16166 | 16175.3 | 15622.2 | 14878.2 | ||||||
| GDP | mio EUR 2000 | 24567.2 | 24717.8 | 24065.3 | 23825.1 | ||||||
| Gross inland consumption | ktoe | 7136.3 | 7231.5 | 6980.9 | 6797.2 | ||||||
| GHG emissions from energy sources | 2000=100 | 106.5 | 106.5 | 102.9 | 98 | ||||||
| GDP | 2000=100 | 130 | 130.8 | 127.3 | 126 | ||||||
| Gross inland consumption | 2000=100 | 111.6 | 113.1 | 109.2 | 106.3 |
Slovenian Environment Agency, 2015
| Non-energy related sources | Electricity and heat production + fugitive emissions | Industry and construction (energy-related fuel use) | Transport | Other sectors | ||
|---|---|---|---|---|---|---|
| 2013 | kt CO2 equiv | 3287.6 | 6230.9 | 1641.5 | 5459.1 | 1546.7 |
| 2013 | % | 18.1 | 34.3 | 9 | 30.1 | 8.5 |
Slovenian Environment Agency, 2015.
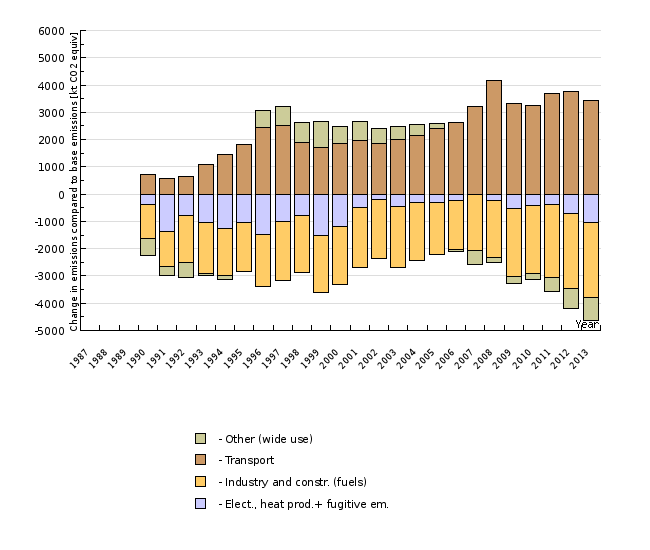
| Year | 1987 | 1988 | 1989 | 1990 | 1991 | 1992 | 1993 | 1994 | 1995 | 1996 | |
|---|---|---|---|---|---|---|---|---|---|---|---|
| Energy sector: | kt CO2 equiv | 14515.8 | 13623.1 | 13632.5 | 14134.9 | 14336.7 | 15024.5 | 15740.9 | |||
| - Elect., heat prod.+ fugitive em. | kt CO2 equiv | 6884.3 | 5905.6 | 6485.5 | 6232 | 5995.6 | 6210.4 | 5794.9 | |||
| - Industry and constr. (fuels) | kt CO2 equiv | 3148.6 | 3096.4 | 2694.3 | 2516.9 | 2688.3 | 2632.4 | 2497.7 | |||
| - Transport | kt CO2 equiv | 2733.2 | 2580.1 | 2655.2 | 3098.3 | 3448.6 | 3823.2 | 4459.1 | |||
| - Other (wide use) | kt CO2 equiv | 1749.6 | 2041 | 1797.5 | 2287.8 | 2204.3 | 2358.4 | 2989.2 | |||
| 0 | 0 | 0 | 0 | 0 | 0 | 0 | |||||
| Energy sector: | kt CO2 equiv | -1528.2 | -2420.9 | -2411.4 | -1909 | -1707.3 | -1019.5 | -303.1 | |||
| - Elect., heat prod.+ fugitive em. | kt CO2 equiv | -380.5 | -1359.2 | -779.3 | -1032.8 | -1269.2 | -1054.3 | -1469.9 | |||
| - Industry and constr. (fuels) | kt CO2 equiv | -1257.1 | -1309.3 | -1711.4 | -1888.8 | -1717.4 | -1773.3 | -1908 | |||
| - Transport | kt CO2 equiv | 725.6 | 572.5 | 647.6 | 1090.7 | 1441 | 1815.6 | 2451.5 | |||
| - Other (wide use) | kt CO2 equiv | -616.3 | -324.9 | -568.4 | -78.1 | -161.6 | -7.5 | 623.3 | |||
| Year | 1997 | 1998 | 1999 | 2000 | 2001 | 2002 | 2003 | 2004 | 2005 | 2006 | |
| Energy sector: | kt CO2 equiv | 16075.4 | 15777.8 | 15091.4 | 15183.8 | 16043.9 | 16110.5 | 15838.4 | 16174.2 | 16396.8 | 16575.7 |
| - Elect., heat prod.+ fugitive em. | kt CO2 equiv | 6249.6 | 6485.4 | 5765.1 | 6064.9 | 6776.7 | 7072.4 | 6825.8 | 6958.5 | 6972.6 | 7040.4 |
| - Industry and constr. (fuels) | kt CO2 equiv | 2236 | 2295 | 2305.1 | 2275.1 | 2216.4 | 2248.4 | 2165.1 | 2285.6 | 2475.3 | 2591 |
| - Transport | kt CO2 equiv | 4526.3 | 3900.9 | 3708.4 | 3857.4 | 3979.8 | 3864.7 | 4003.7 | 4153.5 | 4427.4 | 4647.1 |
| - Other (wide use) | kt CO2 equiv | 3063.5 | 3096.4 | 3312.8 | 2986.4 | 3071.1 | 2925 | 2843.7 | 2776.6 | 2521.4 | 2297.3 |
| 0 | 0 | 0 | 0 | 0 | 0 | 0 | 0 | 0 | 0 | ||
| Energy sector: | kt CO2 equiv | 31.4 | -266.2 | -952.6 | -860.1 | -0 | 66.6 | -205.6 | 130.2 | 352.8 | 531.8 |
| - Elect., heat prod.+ fugitive em. | kt CO2 equiv | -1015.2 | -779.3 | -1499.7 | -1199.9 | -488.1 | -192.3 | -439 | -306.3 | -292.2 | -224.4 |
| - Industry and constr. (fuels) | kt CO2 equiv | -2169.7 | -2110.7 | -2100.6 | -2130.6 | -2189.3 | -2157.3 | -2240.6 | -2120.1 | -1930.3 | -1814.7 |
| - Transport | kt CO2 equiv | 2518.7 | 1893.3 | 1700.9 | 1849.8 | 1972.2 | 1857.1 | 1996.2 | 2145.9 | 2419.8 | 2639.5 |
| - Other (wide use) | kt CO2 equiv | 697.6 | 730.6 | 946.9 | 620.6 | 705.2 | 559.1 | 477.9 | 410.7 | 155.5 | -68.6 |
| Year | 2007 | 2008 | 2009 | 2010 | 2011 | 2012 | 2013 | ||||
| Energy sector: | kt CO2 equiv | 16685 | 17697.7 | 16092.2 | 16166 | 16175.3 | 15622.2 | 14878.2 | |||
| - Elect., heat prod.+ fugitive em. | kt CO2 equiv | 7268.8 | 7023.9 | 6728.1 | 6859.6 | 6888.9 | 6568.6 | 6230.9 | |||
| - Industry and constr. (fuels) | kt CO2 equiv | 2340.6 | 2306.5 | 1936.9 | 1909.8 | 1712.5 | 1645.6 | 1641.5 | |||
| - Transport | kt CO2 equiv | 5228.2 | 6156.9 | 5325.2 | 5264.8 | 5698.2 | 5772.4 | 5459.1 | |||
| - Other (wide use) | kt CO2 equiv | 1847.3 | 2210.4 | 2102 | 2131.8 | 1875.8 | 1635.6 | 1546.7 | |||
| 0 | 0 | 0 | 0 | 0 | 0 | 0 | |||||
| Energy sector: | kt CO2 equiv | 641 | 1653.7 | 48.3 | 122 | 131.4 | -421.8 | -1165.7 | |||
| - Elect., heat prod.+ fugitive em. | kt CO2 equiv | 4 | -240.9 | -536.7 | -405.2 | -375.9 | -696.2 | -1033.9 | |||
| - Industry and constr. (fuels) | kt CO2 equiv | -2065 | -2099.2 | -2468.8 | -2495.9 | -2693.2 | -2760.1 | -2764.2 | |||
| - Transport | kt CO2 equiv | 3220.6 | 4149.3 | 3317.6 | 3257.2 | 3690.6 | 3764.8 | 3451.5 | |||
| - Other (wide use) | kt CO2 equiv | -518.5 | -155.5 | -263.9 | -234.1 | -490.1 | -730.3 | -819.2 |
Slovenian Environment Agency, 2015.
| 2005 | 2006 | 2007 | 2008 | 2009 | 2010 | 2011 | 2012 | 2013 | ||
|---|---|---|---|---|---|---|---|---|---|---|
| Actual emissions of sources comitted to EU ETS | kt CO2 equiv | 8720.6 | 8842.2 | 9048.6 | 8860.1 | 8067 | 8129.9 | 7994.6 | 7610.6 | 7386.3 |
| Granted quotas in the national allocation plan for the period 2005-2007 | kt CO2 equiv | 9192.5 | 8757.3 | 8311.2 | 8214.4 | 8216.1 | 8226.5 | 8224.7 | 8226.2 | 0 |
| The difference between actual emissions and quotas | kt CO2 equiv | -472 | 84.9 | 737.4 | 645.7 | -149 | -96.6 | -230.2 | -615.6 | 0 |
| Emissions due to energy use | kt CO2 equiv | 8440.9 | 8546.3 | 8478.4 | 9704.3 | 8663 | 8643.6 | 8753.4 | 8570.8 | 8222.2 |
| Electricity and heat prod. (incl. fugitive emissions) | kt CO2 equiv | 642.8 | 660.2 | 647.5 | 574.7 | 586.7 | 610.7 | 639.6 | 632.5 | 613.8 |
| Industry and construction (energy use of fuels) | kt CO2 equiv | 849.3 | 941.7 | 755.3 | 762.3 | 649.2 | 636.3 | 539.9 | 530.3 | 602.6 |
| Transport | kt CO2 equiv | 4427.4 | 4647.1 | 5228.2 | 6156.9 | 5325.2 | 5264.8 | 5698.2 | 5772.4 | 5459.1 |
| Other (wide use) | kt CO2 equiv | 2521.4 | 2297.3 | 1847.3 | 2210.4 | 2102 | 2131.8 | 1875.8 | 1635.6 | 1546.7 |
| Non-energy related sources: | kt CO2 equiv | 3294.4 | 3252.5 | 3238.4 | 2869.6 | 2728.9 | 2720.4 | 2751.8 | 2716.9 | 2559 |
| TOTAL non-EU ETS | kt CO2 equiv | 11735.3 | 11798.7 | 11716.7 | 12573.9 | 11391.9 | 11364.1 | 11505.3 | 11287.7 | 10781.2 |
| Target for non-EU ETS sector 2008-2012 | kt CO2 equiv | 11824.2 | 11824.2 | 11824.2 | 11824.2 | 11824.2 | 11824.2 | 11824.2 | 11824.2 | 12323.9 |
| Distance to target for non-EU ETS | kt CO2 equiv | -88.9 | -25.4 | -107.4 | 749.7 | -432.2 | -460.1 | -318.9 | -536.4 | -1542.8 |
| Cumulative distance to target in the period 2008-2012 | kt CO2 equiv | 749.7 | 317.5 | -142.6 | -461.5 | -997.9 | -1542.8 |


