[KM34] The Concentration of Agricultural Production

Key message

Changes in the size structure show that concentration processes are continuing regarding the extent of the agricultural land, while in the area of the livestock production these processes have slowed down. Nevertheless, due to its small size on average, the competitiveness of Slovenian farms is low compared to the EU–28 countries. Despite the structural changes, Slovenia lags behind the EU–28 average by about twice in terms of the size of agricultural holdings and in terms of the productivity (0.17 PDM/ha) and thus is ranked in the group of EU member states with the most unfavourable agricultural structure. The gap with countries with more developed agriculture is not narrowing. As many as 60% of agricultural holdings still manage less than 5 hectares of agricultural land, and more than a fifth of all agricultural land is in use in this size class. However, it should be pointed out, that fostering competitiveness and increasing the concentration of agricultural production may result in a reduction in biodiversity and an increase pressure on the environment.
Definition
The indicator shows changes in the size structure of agricultural holdings according to their physical or economic size. The concentration of agricultural production is mainly affected by changes in the number of agricultural holdings, land use changes, changes in the number of livestock on livestock holdings, the volume of labour input and changes in the economic size of agricultural holdings. The average size of agricultural holdings in Slovenia and the EU–28 countries that cultivate Utilised Agricultural Area and the average number of livestock units (LU) on agricultural holdings with livestock are shown. Changes in labour and economic size on agricultural holdings are also shown.
Charts
SORS,AIS calculations
Data: 10. 10. 2020
| 2000 [number] | 2010 [number] | 2016 [number] | |
|---|---|---|---|
| Average size UAA/agricultural holding | 5.62 | 6.36 | 6.86 |
| Up to 5 ha UAA | 53428 | 45728 | 41919 |
| 5-50 ha UAA | 32864 | 28466 | 27391 |
| more than 50 ha UAA | 175 | 452 | 593 |
| Total | 86467 | 74646 | 69903 |
SORS,AIS calculations
Data: 10. 10. 2020
| 2000 [number] | 2010 [number] | 2016 [number] | |
|---|---|---|---|
| Up to 5 ha UAA | 127511 | 105162 | 98318 |
| 5-50 ha UAA | 320073 | 312522 | 316202 |
| more than 50 ha UAA | 38294 | 56750 | 65069 |
| Total | 485878 | 474434 | 479589 |
SORS,AIS calculations
Data: 10. 10. 2020
| 2000 [number] | 2010 [number] | 2016 [number] | |
|---|---|---|---|
| Average size LSU/agricultural holding | 6.07 | 7.19 | 7.51 |
| Up to 5 LSU | 51268 | 37459 | 35932 |
| 5-50 LSU | 25733 | 20336 | 18789 |
| more than 50 LSU | 451 | 853 | 1061 |
| Total | 77452 | 58648 | 55782 |
SORS,AIS calculations
Data: 10. 10. 2020
| 2000 [number] | 2010 [number] | 2016 [number] | |
|---|---|---|---|
| Up to 5 LSU | 95286 | 63680 | 55717 |
| 5-50 LSU | 305847 | 273645 | 260896 |
| more than 50 LSU | 69365 | 84227 | 102072 |
| Total | 470498 | 421553 | 418684 |
SORS,AIS calculations
Data: 10. 10. 2020
| 2007 [number] | 2010 [number] | 2016 [number] | |
|---|---|---|---|
| Average size SO/holding | 11746.99 | 12233.66 | 16576.87 |
| Up to 8.000 EUR | 52267 | 51461 | 41107 |
| 8.000-25.000 EUR | 16417 | 15644 | 19175 |
| more than 25.000 EUR | 6654 | 7541 | 9621 |
| Total | 75338 | 74646 | 69903 |
SORS,AIS calculations
Data: 10. 10. 2020
| 2007 [number] | 2010 [number] | 2016 [number] | |
|---|---|---|---|
| Up to 8.000 EUR | 174903 | 173782 | 154750 |
| 5-50 ha UAA | 222471 | 210709 | 257778 |
| more than 25.000 EUR | 487621 | 528703 | 746245 |
| Total | 884995 | 913194 | 1158773 |
SORS,AIS calculations
Data: 10. 10. 2020
| 2000 [%] | 2010 [%] | 2016 [%] | |
|---|---|---|---|
| Up to 5 ha UAA | 51049 | 33398 | 35231 |
| 5-30 ha UAA | 52812 | 38291 | 38649 |
| more than 30 ha UAA | 3949 | 5324 | 6087 |
| Total | 107809 | 77012 | 79967 |
EUROSTAT, AIS calculations
Data: 11. 10. 2020
| Number of agricultural holdings [Number] | Utilised agricultural area [Number] | Number of holdings with livestock [Number] | Number of livestock [Number] | Economic size of farms [1000 EUR] | Annual work units [Number] | |
|---|---|---|---|---|---|---|
| Austria | 132500 | 2669750 | 93920 | 2432030 | 6141561460 | 101740 |
| Belgium | 36890 | 1354250 | 25440 | 3772750 | 8037986420 | 55350 |
| Bulgaria | 202720 | 4468500 | 134970 | 1094240 | 3842891030 | 255520 |
| Cyprus | 34940 | 111930 | 9980 | 172080 | 616692170 | 18740 |
| Czechia | 26530 | 3455410 | 18680 | 1756520 | 5081940920 | 103270 |
| Denmark | 35050 | 2614600 | 20670 | 4128470 | 10062442040 | 49480 |
| Estonia | 16700 | 995100 | 6960 | 279330 | 801547060 | 19880 |
| Finland | 49710 | 2233080 | 16610 | 1102310 | 3514583720 | 81630 |
| France | 456520 | 27814160 | 247570 | 22081990 | 61343138670 | 708170 |
| Greece | 684950 | 4553830 | 238520 | 2102870 | 7574803910 | 457150 |
| Croatia | 134460 | 1562980 | 91470 | 754710 | 2034939130 | 160460 |
| Ireland | 137560 | 4883650 | 126590 | 6199890 | 6324900700 | 160740 |
| Italy | 1145710 | 12598160 | 154680 | 9467720 | 51689024310 | 897090 |
| Latvia | 69930 | 1930880 | 44970 | 498640 | 1221341010 | 76860 |
| Lithuania | 150320 | 2924600 | 95300 | 849990 | 2226207560 | 148350 |
| Luxembourg | 1970 | 130650 | 1540 | 173600 | 365008400 | 3500 |
| Hungary | 430000 | 4670560 | 261540 | 2444890 | 6532474660 | 394410 |
| Malta | 9210 | 11120 | 2740 | 32470 | 98016860 | 5340 |
| Germany | 276120 | 16715320 | 184690 | 18182310 | 49249020560 | 502610 |
| Netherlands | 55680 | 1796260 | 36960 | 6819960 | 23087034100 | 147200 |
| Poland | 1410700 | 14405650 | 718240 | 9443240 | 25005635420 | 1649400 |
| Portugal | 258980 | 3641690 | 172350 | 2223720 | 5144206850 | 313830 |
| Romania | 3422030 | 12502540 | 2567430 | 4828780 | 12105491800 | 1640120 |
| Slovakia | 25660 | 1889820 | 16120 | 621590 | 1931433530 | 47190 |
| Slovenia | 69900 | 488400 | 56580 | 512120 | 1158773470 | 82390 |
| Spain | 945020 | 23229750 | 216700 | 14442530 | 38365605150 | 822370 |
| Sweden | 62940 | 3012640 | 34290 | 1699990 | 5158678850 | 55940 |
| United Kingdom | 185060 | 16673270 | 138050 | 13340200 | 25403447340 | 284940 |
EUROSTAT, AIS calculations
Data: 11. 10. 2020
| Average size of agricultural holdings [ha] | Average number LSU/holding [Number] | AWU/ha UAA [Number] | Average size of economic size [EUR] | |
|---|---|---|---|---|
| Austria | 20.15 | 25.89 | 0 | 46351.41 |
| Belgium | 36.71 | 148.30 | 0.04 | 217890.66 |
| Bulgaria | 22.04 | 8.11 | 0.06 | 18956.64 |
| Cyprus | 3.20 | 17.24 | 0.17 | 17650.03 |
| Czechia | 130.25 | 94.03 | 0.03 | 191554.50 |
| Denmark | 74.60 | 199.73 | 0.02 | 287088.22 |
| Estonia | 59.59 | 40.13 | 0.02 | 47996.83 |
| Finland | 44.92 | 66.36 | 0.04 | 70701.74 |
| France | 60.93 | 89.19 | 0.03 | 134371.20 |
| Greece | 6.65 | 8.82 | 0.10 | 11058.92 |
| Croatia | 11.62 | 8.25 | 0.10 | 15134.16 |
| Ireland | 35.50 | 48.98 | 0.03 | 45979.21 |
| Italy | 11.00 | 61.21 | 0.07 | 45115.28 |
| Latvia | 27.61 | 11.09 | 0.04 | 17465.19 |
| Lithuania | 19.46 | 8.92 | 0.05 | 14809.79 |
| Luxembourg | 66.32 | 112.73 | 0.03 | 185283.45 |
| Hungary | 10.86 | 9.35 | 0.08 | 15191.80 |
| Malta | 1.21 | 11.85 | 0.48 | 10642.44 |
| Germany | 60.54 | 98.45 | 0.03 | 178360.93 |
| Netherlands | 32.26 | 184.52 | 0.08 | 414637.83 |
| Poland | 10.21 | 13.15 | 0.11 | 17725.69 |
| Portugal | 14.06 | 12.90 | 0.09 | 19863.34 |
| Romania | 3.65 | 1.88 | 0.13 | 3537.52 |
| Slovakia | 73.65 | 38.56 | 0.02 | 75270.21 |
| Slovenia | 6.99 | 9.05 | 0.17 | 16577.59 |
| Spain | 24.58 | 66.65 | 0.04 | 40597.66 |
| Sweden | 47.87 | 49.58 | 0.02 | 81961.85 |
| United Kingdom | 90.10 | 96.63 | 0.02 | 137271.41 |
Goals
Slovenia needs a structure of agricultural holdings that will be economically efficient, environmentally sustainable and which will preserve natural resources and vital countryside. The main objectives of agricultural policy are to improve the size structure of agricultural holdings, to ensure food security and to improve labour productivity on agricultural holdings.
Comment
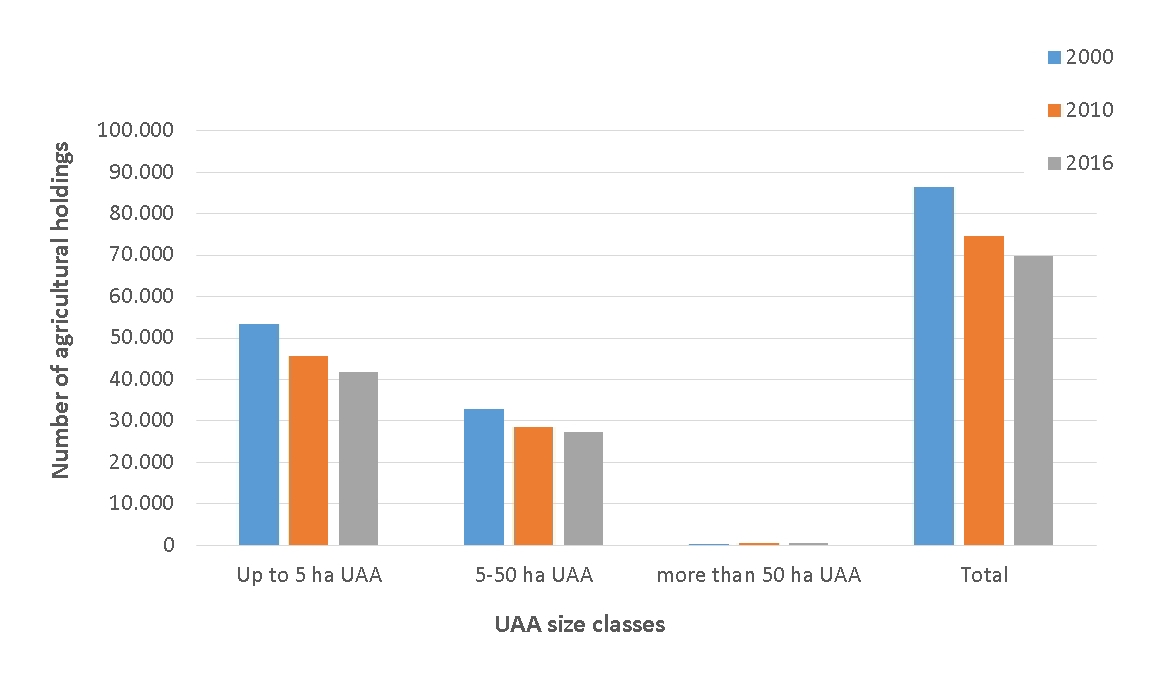
According to the data from the latest sample survey of the structure of agricultural holdings, in 2016 slightly less than 70,000 agricultural holdings were engaged in agricultural activity in Slovenia. Compared to the year 2000, their number decreased by about a fifth or for almost 17 thousand agricultural holdings. In 2016, agricultural holdings used slightly less than 480 thousand hectares of Utilized Agricultural Area (UAA), which is around one percent less than in the year 2000. The average size of agricultural holdings in Slovenia in 2016 was 6.9 hectares of UAA per holding, which is almost a quarter (22%) more than in the year 2000, when it was 5.6 hectares of UAA / holding.
The process of concentration of agricultural land is also indicated by the changes in the size structure of agricultural holdings. The share of holdings with up to 5 hectares of UAA is decreasing. In this size class there are 41,919 agricultural holdings or. 60.0% of all agricultural holdings in Slovenia. These holdings cultivate 98,318 hectares of UAA, which represents 20.5% of all UAA. Compared to the year 2000, the share of holdings in this size class decreased by 1.8 percentage points, while the share of UAA cultivated by these holdings decreased by 5.7 percentage points. In contrast, in the period 2000–2016, the number of holdings in the size class above 50 ha of UAA and the agricultural land cultivated by these holdings increased significantly. In 2016, there were 593 agricultural holdings (3.4 times more than in 2000), which cultivated more than 65 thousand hectares of UAA (69% more than in the year 2000).
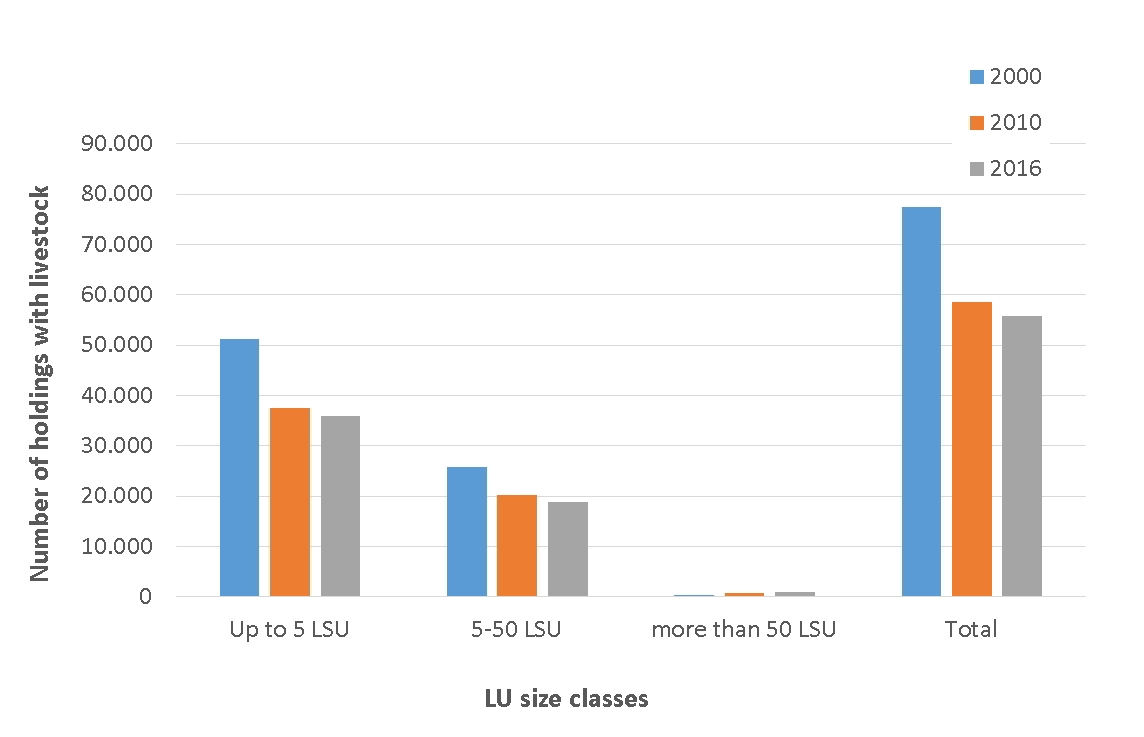
In 2016, slightly less than 56,000 agricultural holdings in Slovenia were engaged in livestock production, which is 21,670 holdings or a good quarter (28%) less than in the year 2000. These holdings together reared slightly less than 420,000 head of livestock units (LU), which is 11% less than in the year 2000. Livestock holdings reared on average 7.5 LU, which is almost a quarter more (23.6%) than in the year 2000, when they reared 6.1 LU per holding. The number of LU decreased in all size classes. In the year 2016, almost two thirds of all livestock holdings were in the size class up to 5 LU, and their share decreased by 2.2 percentage points compared to the year 2000. In 2016, these holdings reared slightly less than 56 thousand LU, which is 41.5% less than in the year 2000. In the period 2000–2016, the number of holdings in the size class over 50 LU more than doubled. In the year 2016 these holdings reared 102 thousand LU, which is almost a quarter of all LU. In comparison with the year 2000 the share of LU in this size class increased by almost 10 percentage points.
In the year 2016, the input of work in the Slovenian agriculture, including seasonal and occasional employment and machine services, expressed in Annual Work Units (AWU), amounted to 79,967 AWU. This is a more than a quarter less (–26%) than according to the 2000 Farm Structure Survey. The average number of AWUs per agricultural holding in 2016 was 1.14 AWU/holding, while in the year 2000 it was 1.24 PDM/holding. In the year 2016, the input of labour per unit of utilized agricultural area was 17 AWU/100 hectares of UAA. Compared to the year 2000, when the labour input per unit of utilized agricultural area was 22 AWU/100 hectares of UAA, the labour intensity improved significantly.
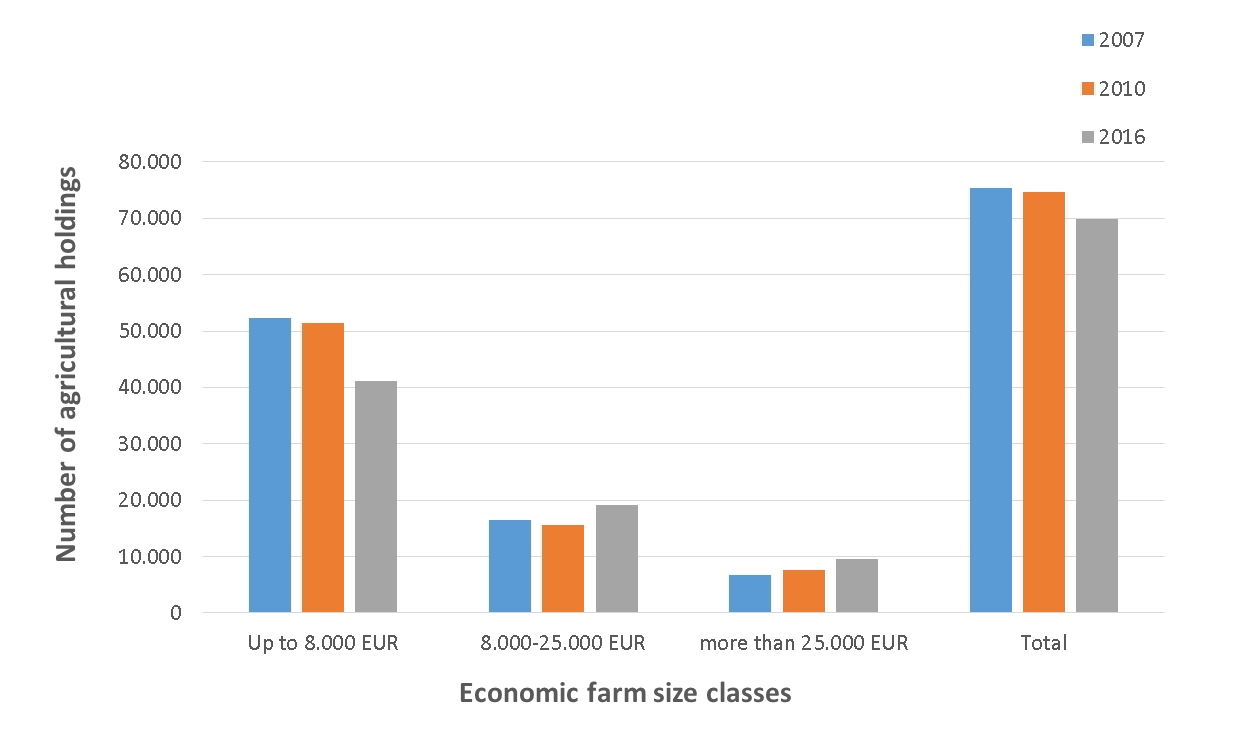
In the year 2016, Slovenian agricultural holdings achieved a total standard income of EUR 1.15 billion. Almost 60% of agricultural holdings was in the size classes up to EUR 8,000, which is 10 percentage points more than in the year 2000. These agricultural holdings together generated 13% of standard income. In 2007, agricultural holdings in this size classes generated almost 20% of standard income. An around quarter of holdings and 22% of standard income were in classes of economic size between EUR 8,000 and 25,000. In 2007, agricultural holdings in this size classes generated almost 25% of standard income. In the year 2016, only around tenth of agricultural holdings (14%) reached an economic size of over EUR 25,000, and almost two thirds of standard income were generated in this size class. In 2007, more than half (55.0% of standard income) was generated in this size class.
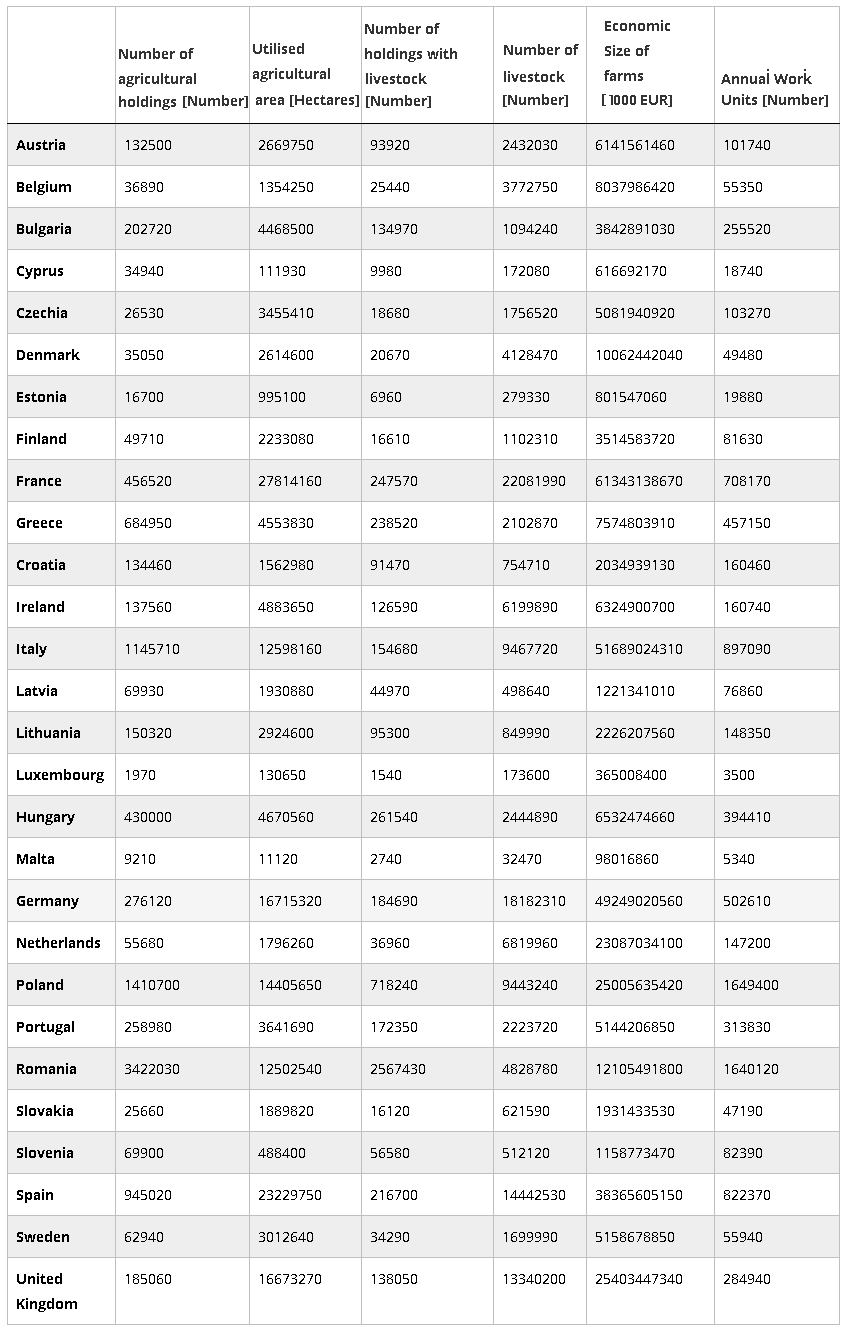
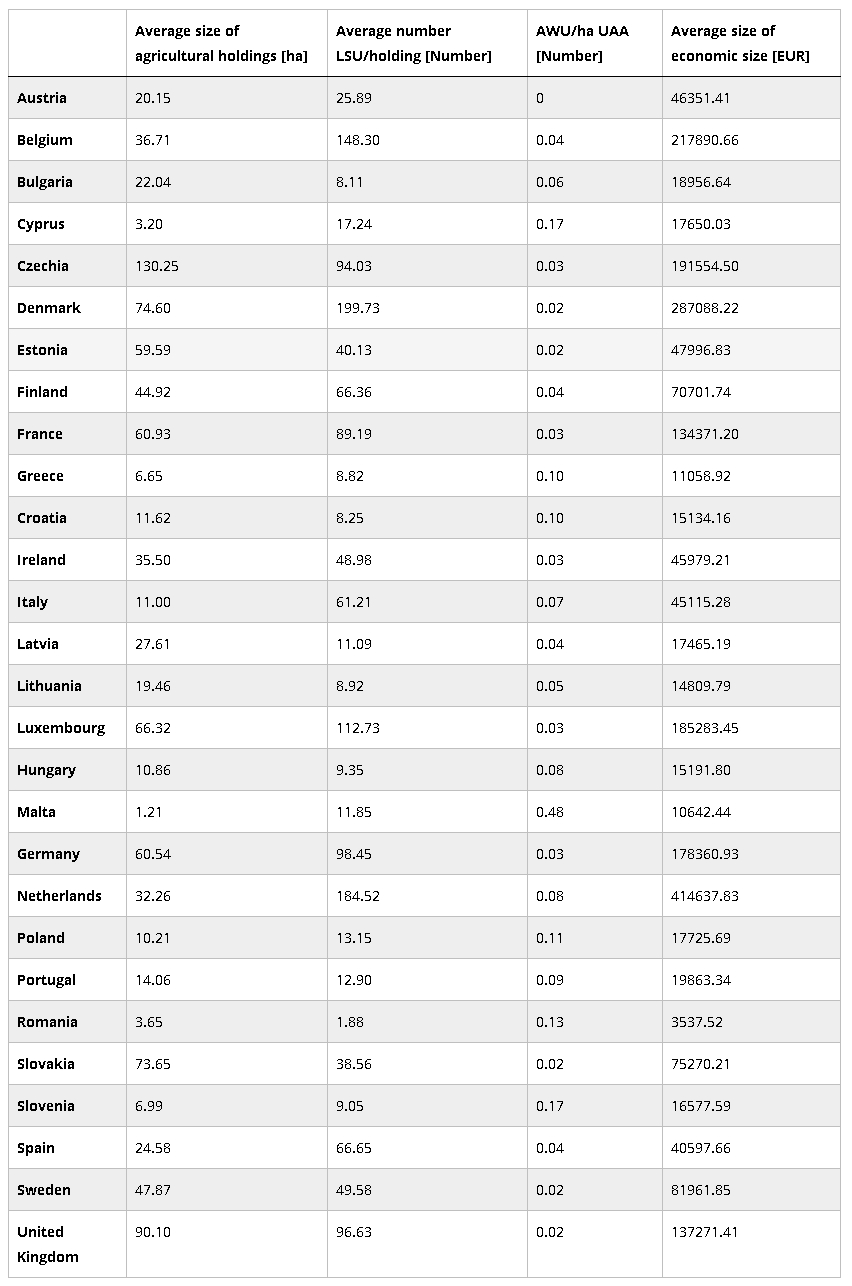
In the year 2016, the average agricultural holding in the EU–28 cultivated 16.6 hectares of UAA. The largest agricultural holdings are in the Czech Republic, where they cultivate an average of 132 hectares per agricultural holding, followed by the United Kingdom (with 91 ha) and Slovakia (with 79 ha). The smallest agricultural holdings are in Malta, where they cultivate on average only slightly more than a hectare of UAA per holding, and in Cyprus and Romania, where they cultivate just over 3 hectares of UAA. With 6.9 ha of UAA per agricultural holding, Slovenia belongs to the group of countries with the lowest average size of agricultural holdings.
In the year 2016, 5.7 million agricultural holdings were engaged in livestock farming in the European Union, which is 55% of all those engaged in agricultural production. Together, they reared just over 131 million head of livestock. In 2016, livestock farms in the EU–28 reared an average of 22.9 LU, which is more than twice as much as in Slovenia, where they reared 9.1 LU per holding. In terms of concentration, traditional livestock countries, such as Denmark, the Netherlands, Belgium and Luxembourg, are in the forefront, with an average of more than 100 LU per agricultural holding.
In the EU–28, just over 9 million AWU worked on agricultural holdings in 2016. The average agricultural holding in the EU–28 employs 0.9 AWU. The Czech Republic has the highest number of AWUs per agricultural holding (3.9 AWUs), followed by the Netherlands (2.6 AWUs) and Slovakia (1.8 AWUs). Compared to the EU–28, Slovenia also has above-average employment on agricultural holdings (1.1 AWUs). The lowest employment is in Cyprus and Romania, where on average less than 0.5 AWUs are employed per agricultural holding.
In 2016, the average economic size, measured by standard income per agricultural holding, in the EU–28 was EUR 35,000. Among EU–28 countries, the Netherlands leads with more than EUR 400,000 of standard output per agricultural holding, while in Romania the average economic size is just over € EUR 3,500 per holding. With around EUR 16,500 per agricultural holding, Slovenia is one of the EU member states that lag far behind the EU–28 average.
A comparison of the data from the 2000 Census of agricultural holdings and a sample survey of the structure of agricultural holdings from 2016 shows that the processes of concentration of agricultural production in Slovenia are ongoing mainly because of reduced number of agricultural holdings and improving of labour productivity. Despite the fact that the average size, labour productivity and economic size of agricultural holdings improved significantly, we still lag far behind the EU-28 average. Given that structural changes are taking place slowly, the continuation of these trends will not significantly increase the burden on the environment.


