[ZD22] Population exposure to airborne pollen/allergens

Key message

Population exposure to allergens has been increasing not only in Slovenia but also worldwide. It is influenced by increasing average air temperature, which is a consequence of climate change. Higher average air temperature results in a longer growing season. This is why allergenic pollen, in connection with climate change, shows a clear advancement of flowering date of allergenic plants. Observed trends show annual differences between continental Slovenia and the littoral. Evidence shows significantly increased airborne birch (betula) pollen in Slovenia.
Definition
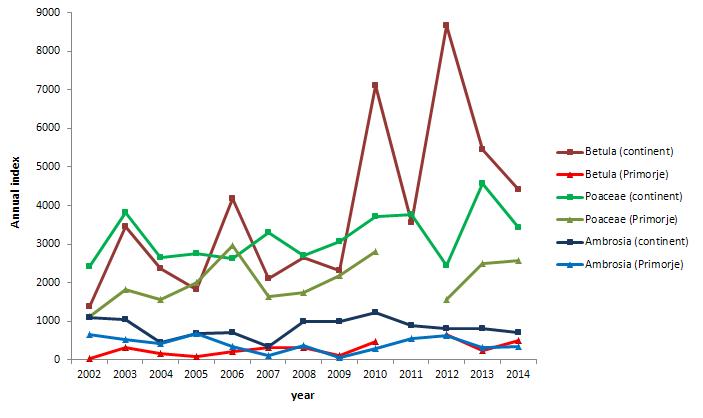
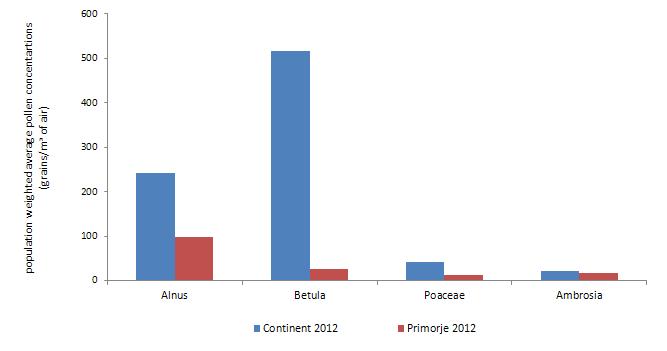
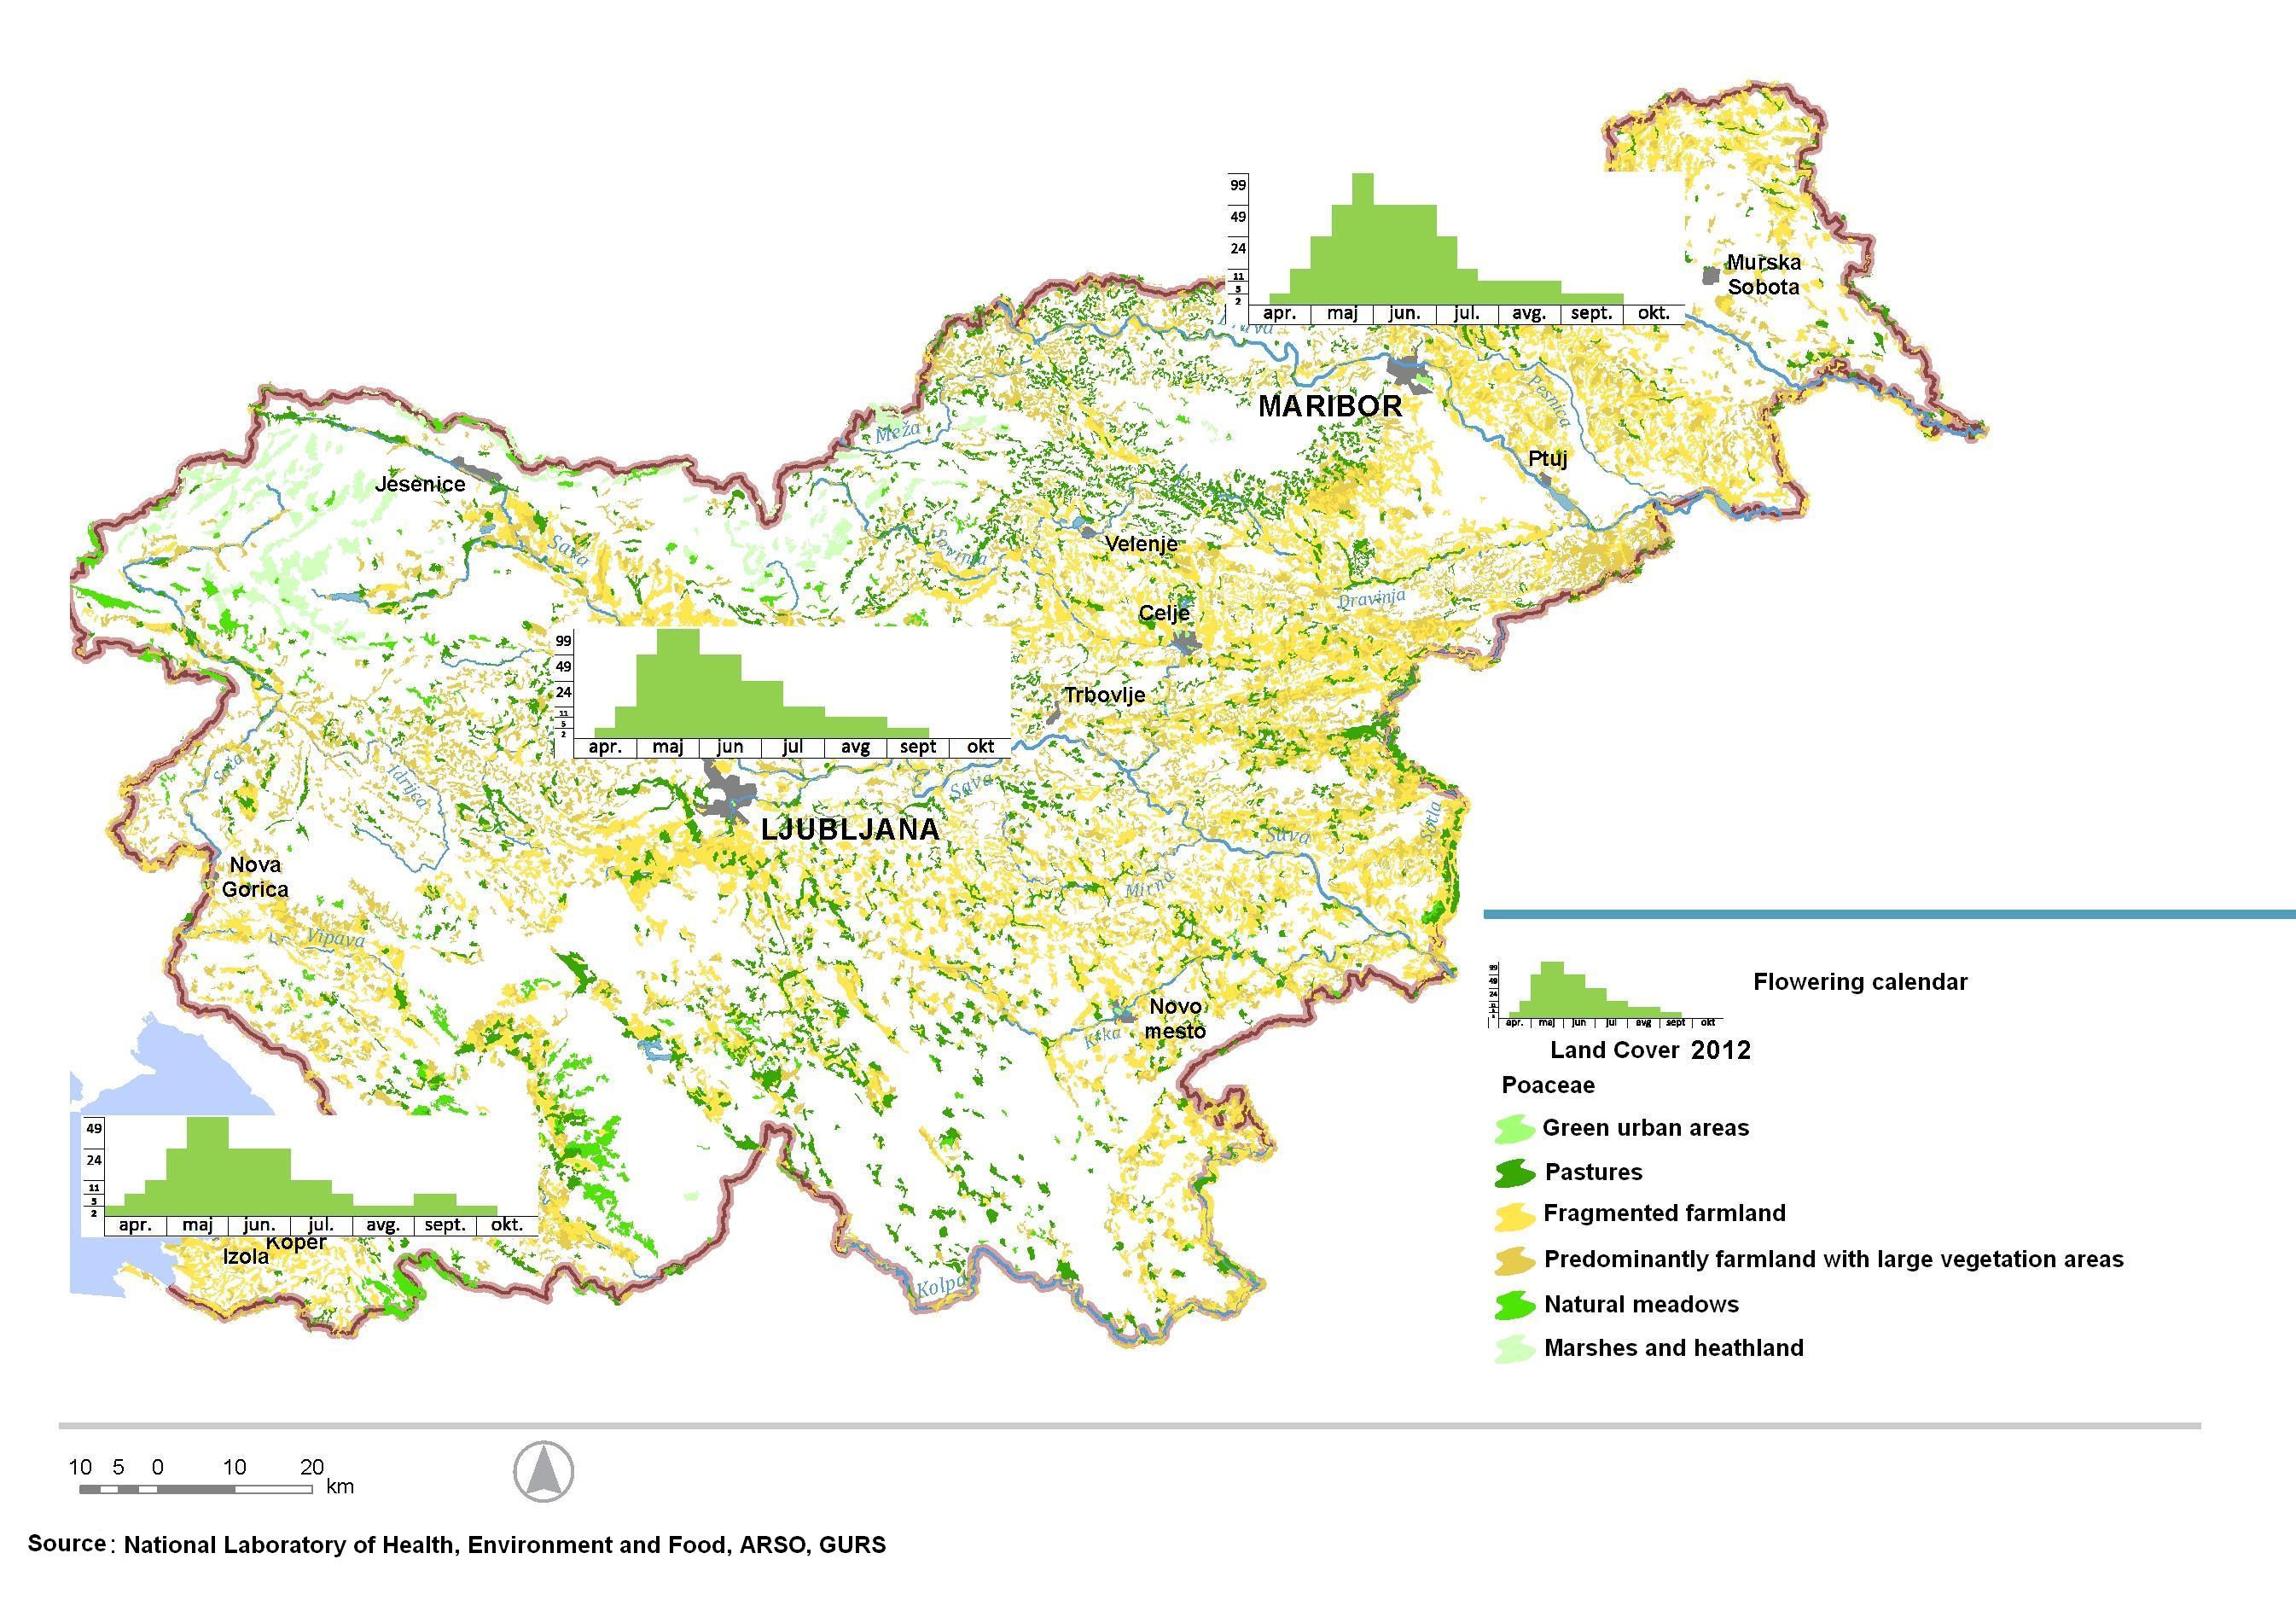
This indicator measures exposure of the population to allergenic pollen of birch, alder, grasses and ragweed (Ambrosia) in the areas of measurement. Exposure is determined on the basis of the population-weighted average concentration of pollen grains by plant species (UNIPHE, 2013). Fluctuation of pollen exposure within a year is presented as the average annual coarse of concentration of allergenic pollen in the air (annual calendar) and seasonal pollen load by plant species (annual index).
Pollen is a common cause of allergic diseases. The symptoms that develop as a result of exposure affect eyes, nose and throat, while bronchi and skin are less commonly affected. The most common allergic diseases are hay fever (intermittent allergic rhinitis), allergic asthma or contact dermatitis.
Pollen season is a time of the year when pollen is present in the air. It can refer to the pollen of individual plant species or the total airborne pollen. Pollen season and flowering season do not overlap entirely due to the winds that carry pollen from various areas to measuring stations.
The pollen load of a particular season is expressed by the annual index, i.e. the quantity of pollen recorded over one year at a single measuring site.
In the pollen calendar, the average seasonal course of pollen concentration in the air is graphically presented.
Pollen grains have a diameter of 10–200 μm or more. Therefore, small pollen grains may be a natural source of particulate matter in outdoor air (PM10). Pollen is classified as a source of particulate matter by the American Environmental Protection Agency (EPA) (EPA, 2013).
Charts
National Laboratory of Health, Environment and Food, 2014
| 2002 | 2003 | 2004 | 2005 | 2006 | 2007 | 2008 | 2009 | 2010 | 2011 | ||
|---|---|---|---|---|---|---|---|---|---|---|---|
| Betula (continent) | index | 1378 | 3457 | 2366 | 1823 | 4190 | 2103 | 2644 | 2311 | 7107 | 3552 |
| Betula (Primorje) | index | 24 | 317 | 167 | 91 | 222 | 309 | 309 | 116 | 465 | |
| Poaceae (continent) | index | 2413 | 3822 | 2650 | 2750 | 2617 | 3310 | 2704 | 3079 | 3725 | 3758 |
| Poaceae (Primorje) | index | 1115 | 1818 | 1567 | 2014 | 2959 | 1635 | 1755 | 2181 | 2820 | |
| Ambrosia (continent) | index | 1093 | 1033 | 437 | 669 | 696 | 355 | 1001 | 1005 | 1229 | 887 |
| Ambrosia (Primorje) | index | 649 | 523 | 413 | 681 | 344 | 108 | 374 | 47 | 302 | 556 |
| 2012 | 2013 | 2014 | |||||||||
| Betula (continent) | index | 8661 | 5458 | 4422 | |||||||
| Betula (Primorje) | index | 647 | 249 | 508 | |||||||
| Poaceae (continent) | index | 2440 | 4579 | 3421 | |||||||
| Poaceae (Primorje) | index | 1556 | 2509 | 2567 | |||||||
| Ambrosia (continent) | index | 815 | 813 | 702 | |||||||
| Ambrosia (Primorje) | index | 620 | 310 | 344 |
National Laboratory of Health, Environment and Food, 2014
| Alnus | Betula | Poaceae | Ambrosia | ||
|---|---|---|---|---|---|
| Continent 2012 | grains/ m3 of air | 241.631263582 | 516.266954813 | 42.2828143443 | 20.6017119232 |
| Primorje 2012 | grains/ m3 of air | 99 | 25 | 13 | 16 |
National Laboratory of Health, Environment and Food, ARSO, 2014
Goals
- To ensure continuous monitoring of pollen concentrations in the air for the purposes of providing information to the professional and general public, for short-term pollen forecasting and online pollen diary as well as a source of information and self-help aid for people suffering from allergies.
- To follow qualitative changes in pollen occurrence and ensure long-term high-quality measurements as pollen in the air is a sensitive indicator of climate change.
- To monitor the reduction of the concentration of ragweed pollen in the air in association with the Decree on measures to suppress harmful plants of genus Ambrosia.
Comment
In Slovenia, pollen monitoring is carried out at three measuring sites in Ljubljana (inland basin), Maribor (inland plain) and Izola (the littoral). Due to highly diverse terrain and great floristic variety, airborne pollen concentration cannot be presented for the entire territory of Slovenia.
Allergic rhinitis is an important and common chronic respiratory disease that affects quality of life, work and learning as well as productivity and represents an economic burden (Bosquet et al., 2009; Brożek et al., 2010). Allergic rhinitis is manifested by itchiness, sneezing and blocked or runny nose. It is often accompanied by allergic conjunctivitis, which is manifested by itchy, watery, red and swollen eyes and a burning sensation in the eyes. The condition worsens when rhinitis is accompanied by sinusitis (Ihan and Wraber, 2012). Intermittent allergic rhinitis is also called hay fever, as it often occurs due to allergic reaction to the pollen of various wind-pollinated flowering plants. As patients are affected only during the flowering season of certain plant species, it is also called seasonal allergic rhinitis or pollinosis. Perennial allergic rhinitis is a similar disease in which patents are allergic to an allergen that is present in the air throughout the year, which makes the symptoms permanent. (Golnik Clinic)
Research has supported a causal relationship between pollen as the cause and seasonal allergic rhinitis as the effect of exposure to allergens in the environment (Sofiev et al., 2013). Pollen grains have a diameter of 10–200 μm or more. Due to their size, they rarely reach the lungs, which makes seasonal (allergic) asthma less common. Patients suffering from severe allergic rhinitis may also develop asthma symptoms during the flowering season due to severe nose inflammation (Golnik Clinic). Doctors have been reporting asthma outbreaks during severe storms during the flowering of grasses. When pollen gets in contact with water and is exposed to an electric field, very small allergen particles are released that can penetrate deeper into the respiratory tract (de Weger et al., 2013).
In the population of adult patients with hay fever or asthma in Slovenia, the prevalence of sensitization to birch allergens is the highest (54%), followed by grasses (51%) and olive tree (26%). The prevalence for Ambrosia allergens in central Slovenia is 4.3% (Zidarn, 2013). According to the GA2LEN skin test study III (Bousquet et al., 2009), the prevalence of sensitization to birch in Europe varies from 41.4% in Finland to 89.9% in Denmark, to grasses from 27.7% in Austria to 80.2% in Switzerland and to Ambrosia from 52.5% in Austria to 97.6% in Portugal.
Pollen grains contain allergens with various degrees of allergenic potential. These proteins are capable of triggering a specific immune response particularly in people genetically susceptible to allergies (Golnik Clinic).
The seasonal pollen load is expressed with an annual index, i.e. the quantity of pollen registered over a one-year period at one measuring site. The index size is associated with the latitude and distribution of plants in the studied area. It depends on the size of the pollen source, intensity of flowering, changes in the vegetation and environmental conditions. The index is influenced by various factors, e.g. transport of pollen grains over different distances and their deposition from the air. The weather may affect the release of pollen into the air. In trees, flowering intensity varies considerably from year to year and is consistent within a population over large geographic areas. Intensive flowering cycles vary between tree species: e.g. in birch, intensive flowering occurs every second year, which is also the case in olive tree, alder and oak, while ash has a three-year cycle (Dahl in sod., 2013).
The calculated trends of annual pollen index at European measuring sites are not uniform. On one hand, the calculations have revealed a statistically insignificant or weak trend (Jaeger in sod., 2003; Spieksma in sod. 1995), while on the other, an increase in the trend does exist and is more pronounced in urban than in rural areas. However, it is not associated with a temperature increase; instead, it is related to the increased level of carbon dioxide in the air (Ziello et al., 2012). Plants respond to greater levels of carbon dioxide with faster growth and larger sizes – consequently, production of pollen per plant increases (Albertine in sod. 2014, Ziska 2000).
In polluted air, pollen is exposed to various substances. These substances can change the outer coat (exine) or certain biochemical properties of proteins in pollen grains. The impact of pollutants such as NO2 and SO2, on pollen's allergenic potential can be different. In grasses, it reduces the allergenic potential of pollen (Sofiev and Bergmann, 2013), while in birch and hornbeam, it increases this potential (Cuinica et al., 2014).
Research results indicate that climate change affects the course of the pollen season and the distribution of certain allergenic plants, e.g. ragweed. The trends vary and are climate-related. In the case of birch, the trend in northern Europe is moving toward a later onset of the flowering season, while in central and western Europe, pollen is appearing earlier in spring than it used to. In addition to birch, longer and earlier pollen seasons were also registered for grasses and ragweed in North America (Emberlin et al., 2003; Newnham et al., 2013; Eggen et al., 2013). The quantity of allergens in pollen grains is not constant. It varies greatly and the differences are evident between different measuring sites in Europe as well as from year to year at the same measuring sites. The difference in the content of allergens in pollen grains can be ten fold in birch and even greater in grasses. The content of allergens in pollen grains depends on the weather a weak before pollen is released into the air (Buters, 2014).


