[SE05] Education level
[SE05] Education level

Definition
Charts
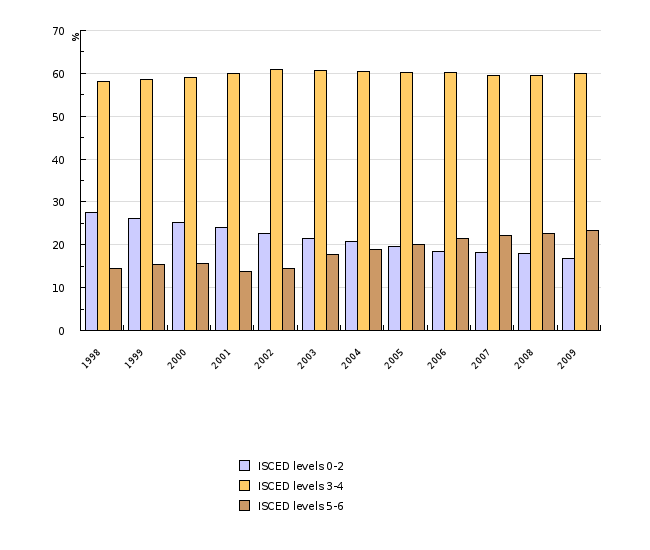
Figure SE05-1: Missing title
Sources:
EUROSTAT, Employment and unemployment (Labour Force Survey), 2010; Preračuni: UMAR, 2010.
| 1998 | 1999 | 2000 | 2001 | 2002 | 2003 | 2004 | 2005 | 2006 | 2007 | ||
|---|---|---|---|---|---|---|---|---|---|---|---|
| ISCED levels 0-2 | % | 27.4 | 26 | 25.2 | 24.1 | 22.7 | 21.5 | 20.7 | 19.7 | 18.4 | 18.2 |
| ISCED levels 3-4 | % | 58.2 | 58.6 | 59.1 | 59.9 | 60.8 | 60.7 | 60.5 | 60.1 | 60.2 | 59.6 |
| ISCED levels 5-6 | % | 14.4 | 15.4 | 15.7 | 13.8 | 14.5 | 17.7 | 18.8 | 20.2 | 21.4 | 22.2 |
| 2008 | 2009 | ||||||||||
| ISCED levels 0-2 | % | 18 | 16.7 | ||||||||
| ISCED levels 3-4 | % | 59.4 | 60 | ||||||||
| ISCED levels 5-6 | % | 22.6 | 23.3 |
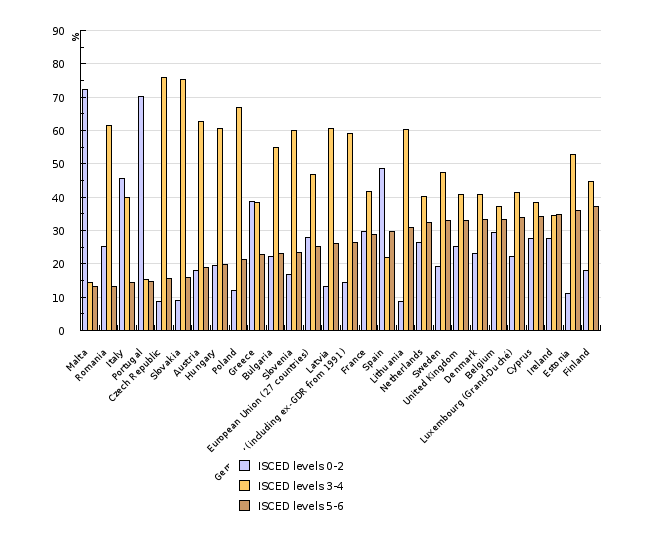
Figure SE05-2: Missing title
Sources:
EUROSTAT, Employment and unemployment (Labour Force Survey), 2010; Preračuni: UMAR, 2010.
| Malta | Romania | Italy | Portugal | Czech Republic | Slovakia | Austria | Hungary | Poland | Greece | ||
|---|---|---|---|---|---|---|---|---|---|---|---|
| ISCED levels 0-2 | % | 72.3 | 25.3 | 45.7 | 70.1 | 8.6 | 9.1 | 18.1 | 19.4 | 12 | 38.8 |
| ISCED levels 3-4 | % | 14.5 | 61.4 | 39.8 | 15.2 | 75.9 | 75.2 | 62.8 | 60.7 | 66.8 | 38.4 |
| ISCED levels 5-6 | % | 13.2 | 13.2 | 14.5 | 14.7 | 15.5 | 15.8 | 19 | 19.9 | 21.2 | 22.8 |
| Bulgaria | Slovenia | European Union (27 countries) | Latvia | Germany (including ex-GDR from 1991) | France | Spain | Lithuania | Netherlands | Sweden | ||
| ISCED levels 0-2 | % | 22.1 | 16.7 | 27.9 | 13.2 | 14.5 | 29.6 | 48.5 | 8.7 | 26.4 | 19.2 |
| ISCED levels 3-4 | % | 54.9 | 60 | 46.7 | 60.7 | 59 | 41.7 | 21.8 | 60.4 | 40.3 | 47.4 |
| ISCED levels 5-6 | % | 23 | 23.3 | 25.1 | 26.1 | 26.3 | 28.7 | 29.7 | 31 | 32.5 | 32.9 |
| United Kingdom | Denmark | Belgium | Luxembourg (Grand-Duché) | Cyprus | Ireland | Estonia | Finland | ||||
| ISCED levels 0-2 | % | 25.2 | 23 | 29.4 | 22.2 | 27.6 | 27.5 | 11.1 | 18 | ||
| ISCED levels 3-4 | % | 40.8 | 40.8 | 37.2 | 41.5 | 38.3 | 34.5 | 52.9 | 44.7 | ||
| ISCED levels 5-6 | % | 33.1 | 33.3 | 33.4 | 33.8 | 34.1 | 34.7 | 36 | 37.3 |
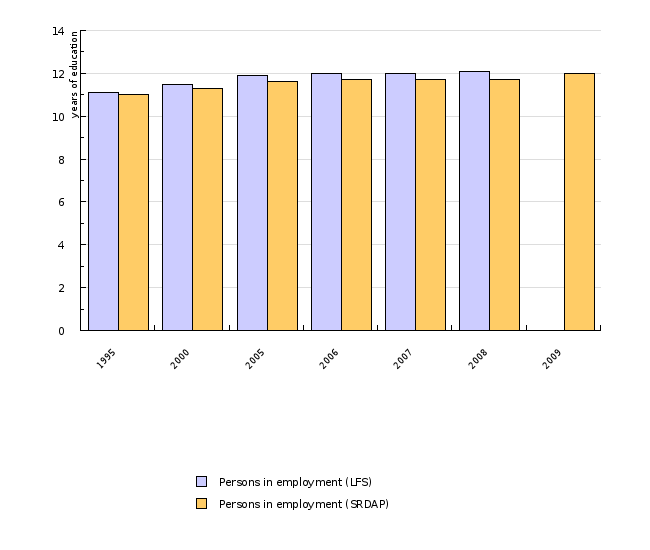
Figure SE05-3: Missing title
Sources:
SURS, Delovno aktivno prebivalstvo (brez kmetov) po stopnji strokovne izobrazbe, dejavnosti in spolu na dan 31.12., 2010; Preračuni: UMAR.
| 1995 | 2000 | 2005 | 2006 | 2007 | 2008 | 2009 | ||
|---|---|---|---|---|---|---|---|---|
| Persons in employment (LFS) | years | 11.1 | 11.5 | 11.9 | 12 | 12 | 12.1 | |
| Persons in employment (SRDAP) | years | 11 | 11.3 | 11.6 | 11.7 | 11.7 | 11.7 | 12 |
| Agriculture,forestry and fishing | years | 10.3 | 10.7 | 10.6 | 10.5 | 10.6 | 10.6 | 10.7 |
| Mining and quarrying | years | 10.3 | 10.6 | 11.1 | 11.1 | 11.2 | 11.2 | 11.4 |
| Manufacturing | years | 10.1 | 10.3 | 10.6 | 10.6 | 10.7 | 10.8 | 10.9 |
| Electricity,gas,steam,air cond.supply | years | 11.2 | 11.6 | 11.9 | 12 | 12.1 | 12.1 | 11.7 |
| Construction | years | 10.2 | 9.9 | 10 | 10 | 10 | 9.9 | 10.2 |
| Wholesale,retail;repair of mot.vehicles | years | 11.2 | 11.4 | 11.6 | 11.7 | 11.7 | 11.7 | 11.9 |
| Accommodation and food ser.activities | years | 10.2 | 10.4 | 10.5 | 10.6 | 10.6 | 10.6 | 10.8 |
| Transportation and storage | years | 10.9 | 11.1 | 11.3 | 11.4 | 11.4 | 11.4 | 11.4 |
| Financial and insurance activities | years | 12.7 | 12.9 | 13.3 | 13.4 | 13.5 | 13.6 | 13.7 |
| Real estate activities | years | 12 | 12.2 | 12.4 | 12.4 | 12.5 | 12.6 | 12.9 |
| Public admin,defence;compulsory soc.sec. | years | 12.9 | 13.3 | 13.6 | 13.7 | 13.8 | 13.9 | 14 |
| Education | years | 13 | 13.4 | 13.9 | 14 | 14.1 | 14.1 | 14.2 |
| Human health and social work activities | years | 11.9 | 11.8 | 12.7 | 12.8 | 12.9 | 12.9 | 13 |
| Other service activities | years | 11.8 | 11.9 | 12.3 | 12.3 | 12.3 | 12.4 | 12.6 |
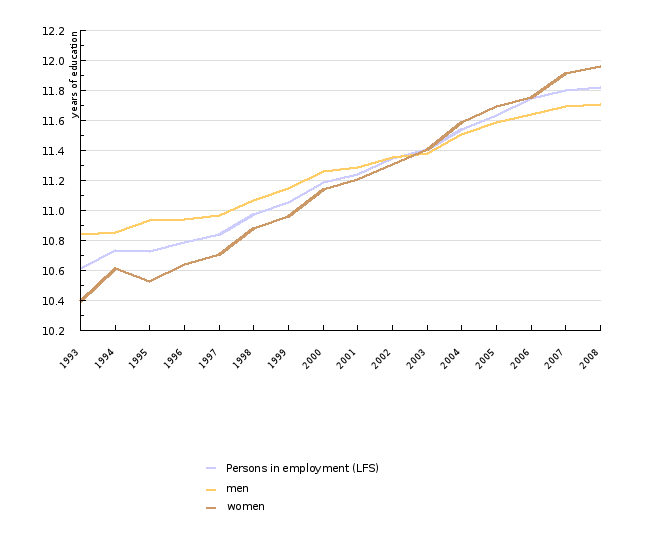
Figure SE05-4: Missing title
Sources:
SURS, Delovno aktivno prebivalstvo (brez kmetov) po stopnji strokovne izobrazbe, dejavnosti in spolu na dan 31.12., 2010; Preračuni: UMAR.
| 1993 | 1994 | 1995 | 1996 | 1997 | 1998 | 1999 | 2000 | 2001 | 2002 | ||
|---|---|---|---|---|---|---|---|---|---|---|---|
| Persons in employment (LFS) | years | 10.6 | 10.7 | 10.7 | 10.8 | 10.8 | 11 | 11.1 | 11.2 | 11.2 | 11.3 |
| men | years | 10.8 | 10.9 | 10.9 | 10.9 | 11 | 11.1 | 11.1 | 11.3 | 11.3 | 11.4 |
| women | years | 10.4 | 10.6 | 10.5 | 10.6 | 10.7 | 10.9 | 11 | 11.1 | 11.2 | 11.3 |
| 2003 | 2004 | 2005 | 2006 | 2007 | 2008 | ||||||
| Persons in employment (LFS) | years | 11.4 | 11.5 | 11.6 | 11.7 | 11.8 | 11.8 | ||||
| men | years | 11.4 | 11.5 | 11.6 | 11.6 | 11.7 | 11.7 | ||||
| women | years | 11.4 | 11.6 | 11.7 | 11.8 | 11.9 | 12 |


