[ZD03] Exposure of residents and children to PM10

Key message

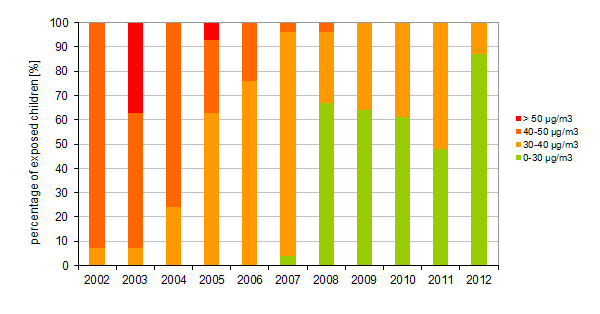
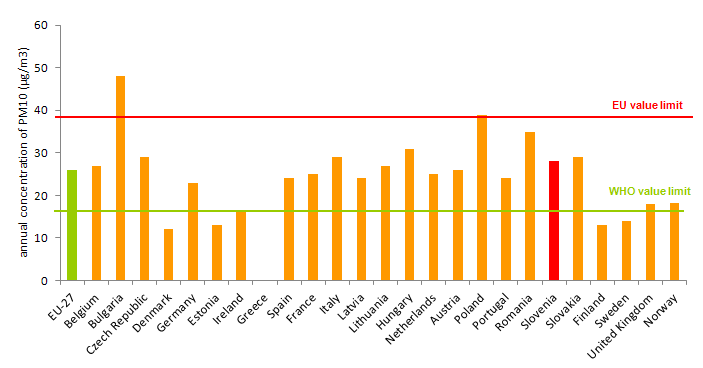
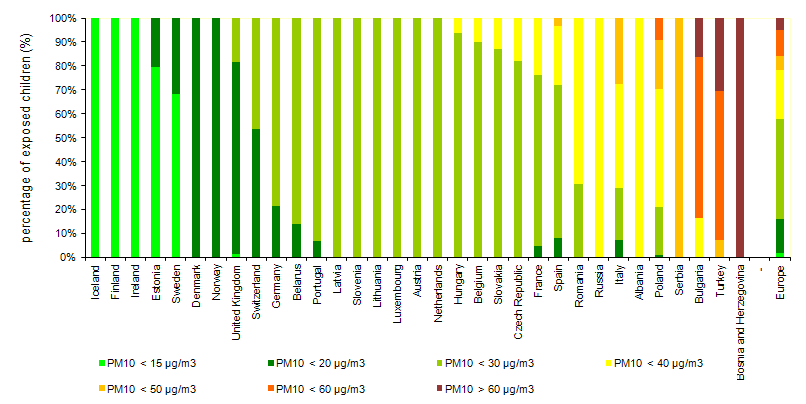
Slovenia belongs in the group of EU countries, which are more polluted with PM10. The average annual concentration of PM10 is exceeding the limit value recommended by the World Health Organization for human health (20 mg PMC10/m3). Very young children, including unborn babies and elderly are particularly sensitive to air pollutants. Analyses show that in Slovenia 2/5 of children are exposed to negative consequences because of the elevated PM10 concentrations. Most children in European cities where PM10 is monitored are exposed PM10 levels that do not exceed 30 micro g/m3, but in Slovenia 40 % of children are exposed to concentrations between 30-40 µg /m3. Recent data suggest that in Slovenia, 15 % of hospitalized children are due to respiratory diseases.
Definition
Charts
National Institute of Public Health, 2013, Slovenian Environment Agency, 2013
| 2002 | 2003 | 2004 | 2005 | 2006 | 2007 | 2008 | 2009 | 2010 | 2011 | ||
|---|---|---|---|---|---|---|---|---|---|---|---|
| 0-30 µg/m3 | % | 0 | 0 | 0 | 0 | 0 | 4 | 67 | 64 | 61.2 | 48 |
| 30-40 µg/m3 | % | 7 | 7 | 24 | 63 | 76 | 92 | 29 | 36 | 38.8 | 52 |
| 40-50 µg/m3 | % | 93 | 56 | 76 | 30 | 24 | 4 | 4 | 0 | 0 | 0 |
| > 50 µg/m3 | % | 0 | 37 | 0 | 7 | 0 | 0 | 0 | 0 | 0 | 0 |
| 2012 | |||||||||||
| 0-30 µg/m3 | % | 87 | |||||||||
| 30-40 µg/m3 | % | 13 | |||||||||
| 40-50 µg/m3 | % | 0 | |||||||||
| > 50 µg/m3 | % | 0 |
National Institute of Public Health, 2013, Statistical Office of the RS, 2013
| 2002 | 2003 | 2004 | 2005 | 2006 | 2007 | 2008 | 2009 | 2010 | 2011 | ||
|---|---|---|---|---|---|---|---|---|---|---|---|
| Ljubljana - children admitted to hospital | No. | 786 | 706 | 805 | 961 | 1020 | 973 | 1017 | 1333 | 1516 | 1378 |
| Maribor - children admitted to hospital | No. | 544 | 546 | 526 | 496 | 433 | 426 | 441 | 669 | 722 | 572 |
| Celje - children admitted to hospital | No. | 255 | 196 | 223 | 249 | 237 | 229 | 293 | 512 | 490 | 409 |
| Murska Sobota - children admitted to hospital | No. | 78 | 73 | 96 | 81 | 77 | 104 | 89 | 419 | 376 | 377 |
| Nova Gorica - children admitted to hospital | No. | 95 | 154 | 137 | 119 | 149 | 131 | 144 | 308 | 338 | 381 |
| Trbovlje - children admitted to hospital | No. | 97 | 91 | 79 | 88 | 77 | 90 | 88 | 88 | 70 | 73 |
| Zagorje ob Savi - children admitted to hospital | No. | 142 | 59 | 67 | 45 | 62 | 80 | 76 | 80 | 97 | 74 |
| Ljubljana - children in the municipality (1.7.) | No. | 46046 | 45044 | 44506 | 44416 | 44330 | 44498 | 37610 | 46482 | 47814 | 48909 |
| Maribor - children in the municipality (1.7.) | No. | 18487 | 18017 | 17660 | 17530 | 17338 | 17722 | 13571 | 17476 | 17641 | 17821 |
| Celje - children in the municipality (1.7.) | No. | 8961 | 8681 | 8624 | 8538 | 8497 | 8534 | 6803 | 8527 | 8628 | 8692 |
| Murska Sobota - children in the municipality (1.7.) | No. | 8443 | 8204 | 8039 | 7908 | 7787 | 7685 | 2607 | 7514 | 7444 | 7357 |
| Nova Gorica - children in the municipality (1.7.) | No. | 7925 | 7709 | 7600 | 7582 | 7500 | 7515 | 4472 | 7630 | 7757 | 7831 |
| Trbovlje - children in the municipality (1.7.) | No. | 2356 | 2245 | 2167 | 2107 | 2068 | 2057 | 2188 | 2022 | 2035 | 1997 |
| Zagorje ob Savi - children in the municipality (1.7.) | No. | 2664 | 2605 | 2501 | 2476 | 2447 | 2443 | 2628 | 2448 | 2451 | 2461 |
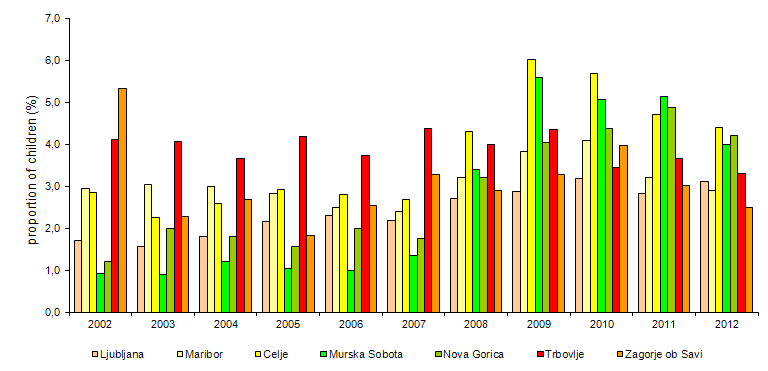
| Ljubljana | % | 1.70698866351 | 1.56735636267 | 1.80874488833 | 2.16363472622 | 2.30092488157 | 2.18661512877 | 2.7 | 2.8677767738 | 3.17061948383 | 2.81747735591 |
| Maribor | % | 2.94260831936 | 3.03047122162 | 2.97848244621 | 2.82943525385 | 2.49740454493 | 2.40379189708 | 3.2 | 3.82810711833 | 4.09273850689 | 3.20969642557 |
| Celje | % | 2.84566454637 | 2.25780440041 | 2.58580705009 | 2.91637385805 | 2.78921972461 | 2.68338411062 | 4.3 | 6.00445643251 | 5.67918405192 | 4.70547630005 |
| Murska Sobota | % | 0.923842236172 | 0.889809848854 | 1.1941783804 | 1.02427921093 | 0.988827533068 | 1.35328562134 | 3.4 | 5.57625765238 | 5.05104782375 | 5.12437134702 |
| Nova Gorica | % | 1.19873817035 | 1.99766506681 | 1.80263157895 | 1.56950672646 | 1.98666666667 | 1.74318030605 | 3.2 | 4.03669724771 | 4.35735464742 | 4.86527901928 |
| Trbovlje | % | 4.11714770798 | 4.05345211581 | 3.64559298569 | 4.17655434267 | 3.72340425532 | 4.37530384054 | 4 | 4.35212660732 | 3.4398034398 | 3.65548322484 |
| Zagorje ob Savi | % | 5.33033033033 | 2.26487523992 | 2.67892842863 | 1.81744749596 | 2.53371475276 | 3.27466230045 | 2.9 | 3.26797385621 | 3.95756833945 | 3.00690776107 |
| 2012 | |||||||||||
| Ljubljana - children admitted to hospital | No. | 1545 | |||||||||
| Maribor - children admitted to hospital | No. | 521 | |||||||||
| Celje - children admitted to hospital | No. | 389 | |||||||||
| Murska Sobota - children admitted to hospital | No. | 294 | |||||||||
| Nova Gorica - children admitted to hospital | No. | 333 | |||||||||
| Trbovlje - children admitted to hospital | No. | 66 | |||||||||
| Zagorje ob Savi - children admitted to hospital | No. | 63 | |||||||||
| Ljubljana - children in the municipality (1.7.) | No. | 49976 | |||||||||
| Maribor - children in the municipality (1.7.) | No. | 17966 | |||||||||
| Celje - children in the municipality (1.7.) | No. | 8818 | |||||||||
| Murska Sobota - children in the municipality (1.7.) | No. | 7344 | |||||||||
| Nova Gorica - children in the municipality (1.7.) | No. | 7964 | |||||||||
| Trbovlje - children in the municipality (1.7.) | No. | 1991 | |||||||||
| Zagorje ob Savi - children in the municipality (1.7.) | No. | 2488 | |||||||||
| Ljubljana | % | 3.1 | |||||||||
| Maribor | % | 2.9 | |||||||||
| Celje | % | 4.4 | |||||||||
| Murska Sobota | % | 4 | |||||||||
| Nova Gorica | % | 4.2 | |||||||||
| Trbovlje | % | 3.3 | |||||||||
| Zagorje ob Savi | % | 2.5 |
EUROSTAT, 2013
| 1997 | 1998 | 1999 | 2000 | 2001 | 2002 | 2003 | 2004 | 2005 | 2006 | ||
|---|---|---|---|---|---|---|---|---|---|---|---|
| EU-27 | µg/m3 | 33 | 28 | 29 | 28 | 26 | 27 | 30 | 27 | 28 | 30 |
| Belgium | µg/m3 | 41 | 35 | 34 | 33 | 34 | 33 | 36 | 31 | 30 | 31 |
| Bulgaria | µg/m3 | 0 | 0 | 0 | 20 | 29 | 0 | 59 | 52 | 49 | 53 |
| Czech Republic | µg/m3 | 35 | 26 | 25 | 30 | 32 | 39 | 41 | 34 | 34 | 35 |
| Denmark | µg/m3 | 0 | 0 | 0 | 0 | 0 | 24 | 25 | 20 | 24 | 27 |
| Germany | µg/m3 | 24 | 21 | 27 | 27 | 25 | 27 | 29 | 24 | 24 | 26 |
| Estonia | µg/m3 | 0 | 0 | 0 | 0 | 18 | 21 | 19 | 18 | 21 | 23 |
| Ireland | µg/m3 | 0 | 0 | 16 | 0 | 20 | 20 | 19 | 15 | 15 | 17 |
| Greece | µg/m3 | 0 | 0 | 0 | 0 | 35 | 35 | 34 | 33 | 29 | 26 |
| Spain | µg/m3 | 33 | 47 | 39 | 39 | 32 | 32 | 34 | 33 | 34 | 34 |
| France | µg/m3 | 0 | 0 | 0 | 0 | 21 | 21 | 23 | 21 | 20 | 21 |
| Italy | µg/m3 | 0 | 0 | 0 | 47 | 31 | 31 | 34 | 36 | 39 | 40 |
| Latvia | µg/m3 | 0 | 0 | 0 | 0 | 0 | 0 | 0 | 0 | 0 | 0 |
| Lithuania | µg/m3 | 0 | 0 | 29 | 0 | 0 | 0 | 0 | 23 | 23 | 20 |
| Hungary | µg/m3 | 0 | 0 | 0 | 0 | 0 | 0 | 34 | 24 | 39 | 37 |
| Netherlands | µg/m3 | 37 | 37 | 36 | 31 | 30 | 32 | 34 | 30 | 30 | 32 |
| Austria | µg/m3 | 0 | 0 | 0 | 26 | 33 | 26 | 31 | 24 | 29 | 30 |
| Poland | µg/m3 | 47 | 53 | 36 | 37 | 36 | 40 | 41 | 32 | 36 | 42 |
| Portugal | µg/m3 | 0 | 0 | 37 | 31 | 33 | 29 | 29 | 33 | 32 | 31 |
| Romania | µg/m3 | 0 | 0 | 0 | 0 | 0 | 0 | 50 | 54 | 49 | 53 |
| Slovenia | µg/m3 | 0 | 0 | 0 | 0 | 0 | 31 | 44 | 41 | 37 | 33 |
| Slovakia | µg/m3 | 0 | 0 | 36 | 29 | 27 | 29 | 30 | 31 | 34 | 31 |
| Finland | µg/m3 | 0 | 0 | 16 | 15 | 16 | 16 | 16 | 14 | 15 | 16 |
| Sweden | µg/m3 | 0 | 14 | 14 | 17 | 18 | 20 | 20 | 18 | 19 | 20 |
| United Kingdom | µg/m3 | 30 | 26 | 25 | 24 | 24 | 24 | 26 | 23 | 23 | 25 |
| Norway | µg/m3 | 0 | 0 | 0 | 0 | 0 | 0 | 20 | 17 | 22 | 22 |
| 2007 | 2008 | 2009 | 2010 | ||||||||
| EU-27 | µg/m3 | 28 | 26 | 26 | 26 | ||||||
| Belgium | µg/m3 | 26 | 26 | 29 | 27 | ||||||
| Bulgaria | µg/m3 | 54 | 61 | 56 | 48 | ||||||
| Czech Republic | µg/m3 | 27 | 25 | 26 | 29 | ||||||
| Denmark | µg/m3 | 23 | 21 | 17 | 12 | ||||||
| Germany | µg/m3 | 23 | 21 | 22 | 23 | ||||||
| Estonia | µg/m3 | 19 | 11 | 11 | 13 | ||||||
| Ireland | µg/m3 | 15 | 14 | 14 | 16 | ||||||
| Greece | µg/m3 | 30 | 0 | 0 | 0 | ||||||
| Spain | µg/m3 | 31 | 27 | 26 | 24 | ||||||
| France | µg/m3 | 27 | 24 | 26 | 25 | ||||||
| Italy | µg/m3 | 36 | 34 | 32 | 29 | ||||||
| Latvia | µg/m3 | 0 | 24 | 20 | 24 | ||||||
| Lithuania | µg/m3 | 21 | 19 | 23 | 27 | ||||||
| Hungary | µg/m3 | 32 | 29 | 30 | 31 | ||||||
| Netherlands | µg/m3 | 31 | 27 | 26 | 25 | ||||||
| Austria | µg/m3 | 23 | 22 | 24 | 26 | ||||||
| Poland | µg/m3 | 32 | 31 | 35 | 39 | ||||||
| Portugal | µg/m3 | 30 | 24 | 25 | 24 | ||||||
| Romania | µg/m3 | 46 | 39 | 30 | 35 | ||||||
| Slovenia | µg/m3 | 32 | 29 | 28 | 28 | ||||||
| Slovakia | µg/m3 | 29 | 27 | 25 | 29 | ||||||
| Finland | µg/m3 | 16 | 14 | 13 | 13 | ||||||
| Sweden | µg/m3 | 17 | 18 | 15 | 14 | ||||||
| United Kingdom | µg/m3 | 24 | 21 | 19 | 18 | ||||||
| Norway | µg/m3 | 20 | 19 | 19 | 20 |
ENHIS, 2011.
| Iceland | Finland | Ireland | Estonia | Sweden | Denmark | Norway | United Kingdom | Switzerland | Germany | ||
|---|---|---|---|---|---|---|---|---|---|---|---|
| PM10 | No. of exposed children | 113730 | 690541 | 586145 | 392306 | 1028892 | 203500 | ||||
| PM10 | No. of exposed children | 100482 | 478055 | 501664 | 759316 | 10402200 | 364528 | 4354978 | |||
| PM10 | No. of exposed children | 2368978 | 312277 | 15822665 | |||||||
| PM10 | No. of exposed children | ||||||||||
| PM10 | No. of exposed children | ||||||||||
| PM10 | No. of exposed children | ||||||||||
| PM10 > 60 µg/m3 | No. of exposed children | ||||||||||
| population covered | No. of exposed children | 113730 | 690541 | 586145 | 492788 | 1506947 | 501664 | 759316 | 12974678 | 676805 | 20177643 |
| PM10 | % of exposed children | 100 | 100 | 100 | 79.6 | 68.3 | 0 | 0 | 1.6 | 0 | 0 |
| PM10 | % of exposed children | 0 | 0 | 0 | 20.4 | 31.7 | 100 | 100 | 80.2 | 53.9 | 21.6 |
| PM10 | % of exposed children | 0 | 0 | 0 | 0 | 0 | 0 | 0 | 18.3 | 46.1 | 78.4 |
| PM10 | % of exposed children | 0 | 0 | 0 | 0 | 0 | 0 | 0 | 0 | 0 | 0 |
| PM10 | % of exposed children | 0 | 0 | 0 | 0 | 0 | 0 | 0 | 0 | 0 | 0 |
| PM10 | % of exposed children | 0 | 0 | 0 | 0 | 0 | 0 | 0 | 0 | 0 | 0 |
| PM10 > 60 µg/m3 | % of exposed children | 0 | 0 | 0 | 0 | 0 | 0 | 0 | 0 | 0 | 0 |
| annual mean PM10 | µg/m3 | 9.7 | 13.3 | 13.5 | 12.6 | 14.8 | 16.7 | 19 | 19.2 | 20 | 22.4 |
| Belarus | Portugal | Latvia | Slovenia | Lithuania | Luxembourg | Austria | Netherlands | Hungary | Belgium | ||
| PM10 | No. of exposed children | ||||||||||
| PM10 | No. of exposed children | 372000 | 100847 | ||||||||
| PM10 | No. of exposed children | 2246600 | 1384079 | 735241 | 267563 | 1039306 | 83226 | 2165313 | 2326067 | 1900107 | 2016016 |
| PM10 | No. of exposed children | 127587 | 229344 | ||||||||
| PM10 | No. of exposed children | ||||||||||
| PM10 | No. of exposed children | ||||||||||
| PM10 > 60 µg/m3 | No. of exposed children | ||||||||||
| population covered | No. of exposed children | 2618600 | 1484926 | 735241 | 267563 | 1039306 | 83226 | 2165313 | 2326067 | 2027694 | 2245360 |
| PM10 | % of exposed children | 0 | 0 | 0 | 0 | 0 | 0 | 0 | 0 | 0 | 0 |
| PM10 | % of exposed children | 14.2 | 6.8 | 0 | 0 | 0 | 0 | 0 | 0 | 0 | 0 |
| PM10 | % of exposed children | 85.8 | 93.2 | 100 | 100 | 100 | 100 | 100 | 100 | 93.7 | 89.8 |
| PM10 | % of exposed children | 0 | 0 | 0 | 0 | 0 | 0 | 0 | 0 | 6.3 | 10.2 |
| PM10 | % of exposed children | 0 | 0 | 0 | 0 | 0 | 0 | 0 | 0 | 0 | 0 |
| PM10 | % of exposed children | 0 | 0 | 0 | 0 | 0 | 0 | 0 | 0 | 0 | 0 |
| PM10 > 60 µg/m3 | % of exposed children | 0 | 0 | 0 | 0 | 0 | 0 | 0 | 0 | 0 | 0 |
| annual mean PM10 | µg/m3 | 20.6 | 24.8 | 20.2 | 29.4 | 23 | 23.3 | 23.6 | 25.5 | 29.8 | 29 |
| Slovakia | Czech Republic | France | Spain | Romania | Russia | Italy | Albania | Poland | Serbia | ||
| PM10 | No. of exposed children | ||||||||||
| PM10 | No. of exposed children | 1008276 | 818439 | 761070 | 107773 | ||||||
| PM10 | No. of exposed children | 567747 | 2125088 | 14677679 | 6456773 | 66293 | 2186685 | 2153515 | |||
| PM10 | No. of exposed children | 85268 | 459356 | 4933105 | 2479108 | 150267 | 10579300 | 4428274 | 365376.2 | 5233822 | |
| PM10 | No. of exposed children | 351385.9 | 2798475 | 2153232 | 1123594.3 | ||||||
| PM10 | No. of exposed children | 983648 | |||||||||
| PM10 > 60 µg/m3 | No. of exposed children | ||||||||||
| population covered | No. of exposed children | 653015 | 2584444 | 20619060 | 10105705.9 | 216560 | 10579300 | 10174504 | 365376.2 | 10631990 | 1123594.3 |
| PM10 | % of exposed children | 0 | 0 | 0 | 0 | 0 | 0 | 0 | 0 | 0 | 0 |
| PM10 | % of exposed children | 0 | 0 | 4.9 | 8.1 | 0 | 0 | 7.5 | 0 | 1 | 0 |
| PM10 | % of exposed children | 86.9 | 82.2 | 71.2 | 63.9 | 30.6 | 0 | 21.5 | 0 | 20.3 | 0 |
| PM10 | % of exposed children | 13.1 | 17.8 | 23.9 | 24.5 | 69.4 | 100 | 43.5 | 100 | 49.2 | 0 |
| PM10 | % of exposed children | 0 | 0 | 0 | 3.5 | 0 | 0 | 27.5 | 0 | 20.3 | 100 |
| PM10 | % of exposed children | 0 | 0 | 0 | 0 | 0 | 0 | 0 | 0 | 9.3 | 0 |
| PM10 > 60 µg/m3 | % of exposed children | 0 | 0 | 0 | 0 | 0 | 0 | 0 | 0 | 0 | 0 |
| annual mean PM10 | µg/m3 | 24.8 | 25.8 | 26.2 | 26.3 | 30.3 | 33.3 | 32.5 | 38.5 | 35 | 40.1 |
| Bulgaria | Turkey | Bosnia and Herzegovina | - | Europe | |||||||
| PM10 | No. of exposed children | 3015114 | |||||||||
| PM10 | No. of exposed children | 20129628 | |||||||||
| PM10 | No. of exposed children | 60901218 | |||||||||
| PM10 | No. of exposed children | 347730 | 29418538 | ||||||||
| PM10 | No. of exposed children | 1650106 | 8076793.2 | ||||||||
| PM10 | No. of exposed children | 1408304 | 13546193 | 15938145 | |||||||
| PM10 > 60 µg/m3 | No. of exposed children | 341464 | 6596424 | 374558.7 | 7312446.6 | ||||||
| population covered | No. of exposed children | 2097498 | 21792723 | 374558.7 | 144791882.8 | ||||||
| PM10 | % of exposed children | 0 | 0 | 0 | 2.1 | ||||||
| PM10 | % of exposed children | 0 | 0 | 0 | 13.9 | ||||||
| PM10 | % of exposed children | 0 | 0 | 0 | 42.1 | ||||||
| PM10 | % of exposed children | 16.6 | 0 | 0 | 20.3 | ||||||
| PM10 | % of exposed children | 0 | 7.6 | 0 | 5.6 | ||||||
| PM10 | % of exposed children | 67.1 | 62.2 | 0 | 11 | ||||||
| PM10 > 60 µg/m3 | % of exposed children | 16.3 | 30.3 | 100 | 5.1 | ||||||
| annual mean PM10 | µg/m3 | 52.9 | 58.1 | 60.9 |
Goals
Comment
Methodology
PictureZD03-5: Path of the particle through the respiratory tract
Source: CEHAP, 2004


