


[ZD03] Exposure of residents and children to PM10

PM10
Key message
Slovenia belongs in the group of EU countries, which are more polluted due to particulate matter (PM10). The average annual concentration of PM10 is exceeding the limit value recommended for the protection of human health by the World Health Organization (20 µg PM10/m3). Very young children, including unborn babies and elderlies, are particularly sensitive to air pollutants like PM. Analyses show that in Slovenia most of the children is exposed to negative consequences of PM10 pollution (more than 21 µg/m3). Most children living in European cities are exposed to PM10 levels that do not exceed 30 µg/m3 but in Slovenia 7 % of children have been exposed to concentrations of PM10 between 31-40 µg/m3 till 2016. As a consequence, 15 % of hospitalization of children is due to respiratory diseases.
Charts
ARSO (National automatic measurement air quality network database), 2018; SURS, 2018
| 0-20 µg/m3 | 21-30 µg/m3 | 31-40 µg/m3 | > 41 µg/m3 | |
|---|---|---|---|---|
| 2008 | 0 | 70 | 27 | 3 |
| 2009 | 0 | 85 | 15 | 0 |
| 2010 | 0 | 72 | 28 | 0 |
| 2011 | 0 | 36 | 64 | 0 |
| 2012 | 0 | 88 | 12 | 0 |
| 2013 | 7.50 | 91 | 1 | 0 |
| 2014 | 12 | 88 | 0 | 0 |
| 2015 | 0 | 90.50 | 9 | 0 |
| 2016 | 10 | 83 | 7 | 0 |
| 2017 | 8 | 92 | 0 | 0 |
NIJZ (Collection of hospital treatments), 2018; SURS (Population by selected administrative units), 2018
| Ljubljana | Maribor | Celje | Murska Sobota | Nova Gorica | Trbovlje | Zagorje ob Savi | |
|---|---|---|---|---|---|---|---|
| 2009 | 2.87 | 3.83 | 6.00 | 5.58 | 4.04 | 4.35 | 3.27 |
| 2010 | 3.17 | 4.09 | 5.68 | 5.05 | 4.36 | 3.44 | 3.96 |
| 2011 | 2.82 | 3.21 | 4.71 | 5.12 | 4.87 | 3.66 | 3.01 |
| 2012 | 3.10 | 2.90 | 4.40 | 4 | 4.20 | 3.30 | 2.50 |
| 2013 | 3.10 | 3.40 | 4.90 | 4.50 | 4.90 | 3.40 | 3.50 |
| 2014 | 3.20 | 3.10 | 4.70 | 5.30 | 7.40 | 4.40 | 4.30 |
| 2015 | 2.40 | 2.50 | 4.20 | 4.50 | 6.10 | 3.90 | 3.70 |
| 2016 | 2.50 | 2.70 | 3.70 | 4 | 5.60 | 4 | 3.70 |
| 2017 | 2.30 | 2.70 | 3.80 | 4.30 | 4.40 | 4.30 | 3.80 |
EUROSTAT, 2018
| EU-28 | Belgium | Bulgaria | Denmark | Germany | Italy | Hungary | Slovenia | United Kingdom | Norway | |
|---|---|---|---|---|---|---|---|---|---|---|
| 2003 | 30 | 36 | 59 | 25 | 29 | 34 | 34 | 44 | 26 | 20 |
| 2005 | 28 | 30 | 49 | 24 | 24 | 39 | 39 | 37 | 23 | 22 |
| 2007 | 28 | 26 | 54 | 23 | 23 | 36 | 32 | 32 | 24 | 20 |
| 2009 | 26.50 | 29 | 54 | 17 | 22.50 | 33.20 | 29.70 | 27.50 | 19.30 | 19.10 |
| 2010 | 26.20 | 27 | 48.40 | 12.10 | 23.10 | 30.40 | 31.30 | 28.20 | 17.80 | 19.70 |
| 2011 | 27.30 | 26.70 | 57.30 | 0 | 22.90 | 35.40 | 33.30 | 31 | 21.70 | 19.60 |
| 2012 | 24.80 | 24.80 | 45.90 | 17.40 | 19.80 | 30.70 | 28.80 | 25.40 | 18.30 | 16 |
| 2013 | 24 | 25 | 43.70 | 15.90 | 20.30 | 30.30 | 27.30 | 24.90 | 17.90 | 16.70 |
| 2014 | 22.50 | 22.30 | 41.20 | 18.70 | 20.10 | 26.80 | 28.20 | 22.50 | 17.70 | 15.10 |
| 2015 | 22.80 | 21 | 36.20 | 18.30 | 18.80 | 30.70 | 26.90 | 27.40 | 16.40 | 13.90 |
ENHIS, 2011.
| PM10 < 15 µg/m3 | PM10 < 20 µg/m3 | PM10 < 30 µg/m3 | PM10 < 40 µg/m3 | PM10 < 50 µg/m3 | PM10 < 60 µg/m3 | PM10 > 60 µg/m3 | |
|---|---|---|---|---|---|---|---|
| Iceland | 100 | 0 | 0 | 0 | 0 | 0 | 0 |
| Finland | 100 | 0 | 0 | 0 | 0 | 0 | 0 |
| Ireland | 100 | 0 | 0 | 0 | 0 | 0 | 0 |
| Estonia | 83 | 17 | 0 | 0 | 0 | 0 | 0 |
| Sweden | 55 | 45 | 0 | 0 | 0 | 0 | 0 |
| Denmark | 0 | 100 | 0 | 0 | 0 | 0 | 0 |
| Norway | 49 | 51 | 0 | 0 | 0 | 0 | 0 |
| United Kingdom | 9 | 85 | 6 | 0 | 0 | 0 | 0 |
| Switzerland | 0 | 73 | 27 | 0 | 0 | 0 | 0 |
| Germany | 2 | 52 | 46 | 0 | 0 | 0 | 0 |
| Belarus | 0 | 0 | 0 | 0 | 0 | 0 | 0 |
| Portugal | 0 | 15 | 81 | 4 | 0 | 0 | 0 |
| Latvia | 0 | 0 | 100 | 0 | 0 | 0 | 0 |
| Slovenia | 0 | 0 | 100 | 0 | 0 | 0 | 0 |
| Lithuania | 0 | 82 | 18 | 0 | 0 | 0 | 0 |
| Luxembourg | 0 | 100 | 0 | 0 | 0 | 0 | 0 |
| Austria | 0 | 6 | 94 | 0 | 0 | 0 | 0 |
| Netherlands | 0 | 0 | 100 | 0 | 0 | 0 | 0 |
| Hungary | 0 | 0 | 100 | 0 | 0 | 0 | 0 |
| Belgium | 0 | 0 | 100 | 0 | 0 | 0 | 0 |
| Slovakia | 0 | 0 | 52 | 48 | 0 | 0 | 0 |
| Czech Republic | 0 | 2 | 77.00 | 16 | 5 | 0 | 0 |
| France | 1 | 13 | 77 | 9 | 0 | 0 | 0 |
| Spain | 3 | 16 | 71 | 9 | 1 | 0 | 0 |
| Romania | 0 | 0 | 39 | 61 | 0 | 0 | 0 |
| Russia | 0 | 0 | 0 | 0 | 0 | 0 | 0 |
| Italy | 2 | 12 | 48 | 18 | 22 | 0 | 0 |
| Albania | 0 | 0 | 0 | 0 | 0 | 0 | 0 |
| Poland | 0.50 | 1.50 | 26 | 46 | 18 | 10 | 0 |
| Serbia | 0 | 0 | 0 | 15 | 85 | 0 | 0 |
| Bulgaria | 0 | 0 | 0 | 9 | 79 | 12 | 0 |
| Turkey | 0 | 0.50 | 0.50 | 0.50 | 12.50 | 52 | 34 |
| Bosnia and Herzegovina | 0 | 0 | 0 | 0 | 0 | 0 | 0 |
| - | 0 | 0 | 0 | 0 | 0 | 0 | 0 |
| Europe | 4 | 20 | 37 | 10 | 8 | 13 | 8 |
Methodology
Figure ZD03-5: Path of the particles through the respiratory tract
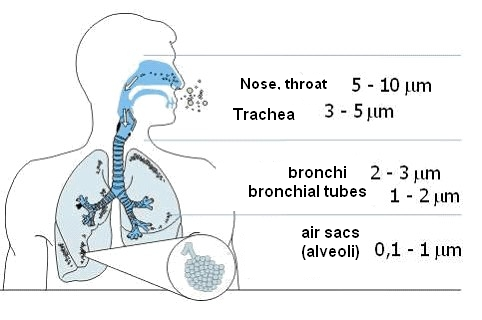
Source: CEHAP, 2004