[EN20] Energy prices

Key message

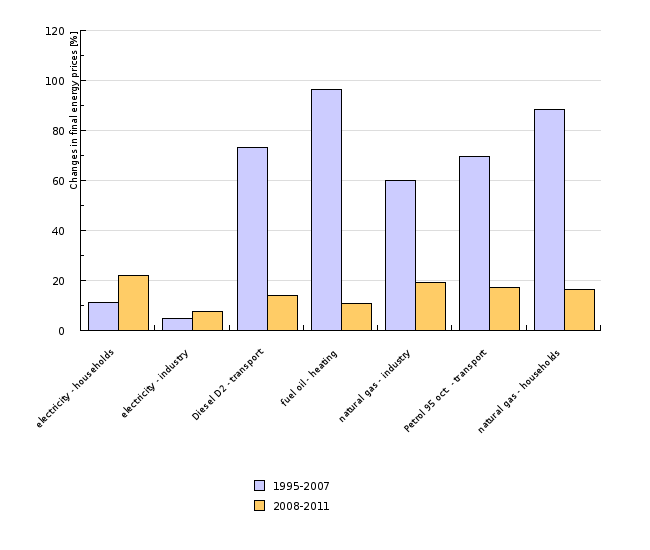
Prices of energy have increased over the period 2008-2011. In the same period, the most raised the price of electricity for households, in real terms by almost 23%, followed by natural gas for industry, 95 octane gasoline, natural gas for households, diesel D2, fuel oil and electricity for industry.
Definition
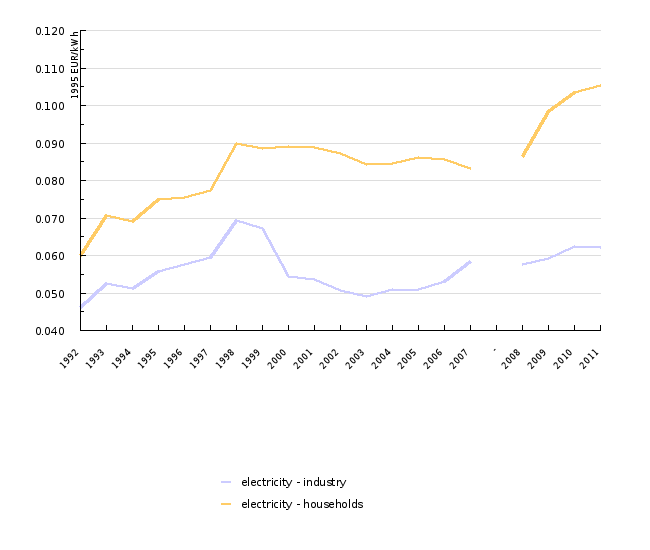
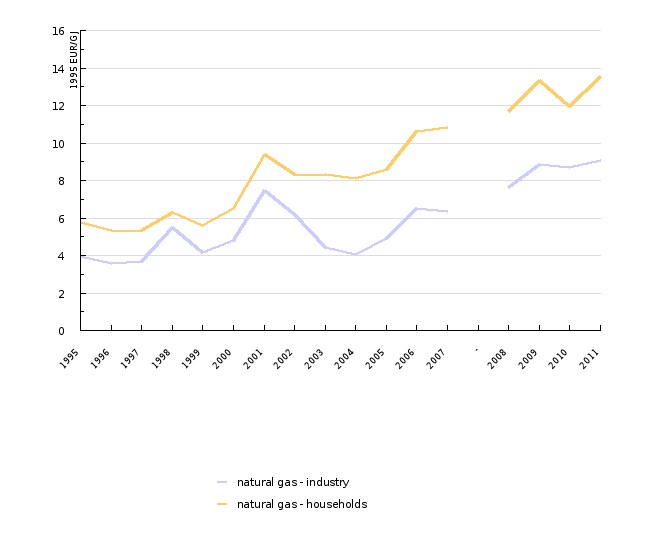
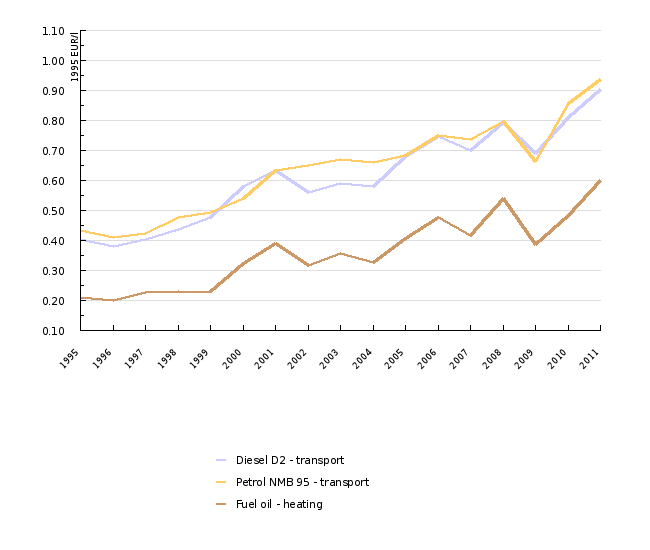
The Energy prices indicator shows the final prices of fuels reflecting the basic prices of fuels, including all taxes. The prices for electricity are reflected in EUR per kilowatt hour (EUR/kWh), for natural gas in EUR per gigajoul (EUR/GJ), for liquid fuels in EUR per litre of fuel (EUR/l).
The prices of electricity and natural gas show the final energy prices for typical consumer groups of industrial and household consumers, whereby the prices for industrial consumers do not include the value-added tax (VAT).
Charts
Statistical Office of the Republic of Slovenia, 2012.
| electricity - households | electricity - industry | Diesel D2 - transport | fuel oil - heating | natural gas - industry | Petrol 95 oct. - transport | natural gas - households | ||
|---|---|---|---|---|---|---|---|---|
| 1995-2007 | % | 11.1 | 4.9 | 73.1 | 96.5 | 60.2 | 69.7 | 88.5 |
| 2008-2011 | % | 22.1 | 7.6 | 14 | 10.8 | 19.4 | 17.4 | 16.3 |
Statistical Office of the Republic of Slovenia, 2012.
| 1992 | 1993 | 1994 | 1995 | 1996 | 1997 | 1998 | 1999 | 2000 | 2001 | ||
|---|---|---|---|---|---|---|---|---|---|---|---|
| electricity - industry | EUR/kWh | 0.046 | 0.052 | 0.051 | 0.056 | 0.058 | 0.06 | 0.069 | 0.067 | 0.054 | 0.054 |
| electricity - households | EUR/kWh | 0.06 | 0.071 | 0.069 | 0.075 | 0.076 | 0.077 | 0.09 | 0.089 | 0.089 | 0.089 |
| 2002 | 2003 | 2004 | 2005 | 2006 | 2007 | - | 2008 | 2009 | 2010 | ||
| electricity - industry | EUR/kWh | 0.051 | 0.049 | 0.051 | 0.051 | 0.053 | 0.058 | 0.058 | 0.059 | 0.062 | |
| electricity - households | EUR/kWh | 0.087 | 0.084 | 0.085 | 0.086 | 0.086 | 0.083 | 0.086 | 0.098 | 0.103 | |
| 2011 | |||||||||||
| electricity - industry | EUR/kWh | 0.062 | |||||||||
| electricity - households | EUR/kWh | 0.105 |
Statistical Office of the Republic of Slovenia, 2012.
| 1995 | 1996 | 1997 | 1998 | 1999 | 2000 | 2001 | 2002 | 2003 | 2004 | ||
|---|---|---|---|---|---|---|---|---|---|---|---|
| natural gas - industry | EUR/GJ | 3.971 | 3.576 | 3.655 | 5.478 | 4.179 | 4.786 | 7.452 | 6.167 | 4.452 | 4.027 |
| natural gas - households | EUR/GJ | 5.754 | 5.338 | 5.338 | 6.309 | 5.61 | 6.488 | 9.412 | 8.311 | 8.32 | 8.082 |
| 2005 | 2006 | 2007 | - | 2008 | 2009 | 2010 | 2011 | ||||
| natural gas - industry | EUR/GJ | 4.909 | 6.493 | 6.359 | 7.609 | 8.857 | 8.711 | 9.083 | |||
| natural gas - households | EUR/GJ | 8.611 | 10.59 | 10.848 | 11.666 | 13.349 | 11.946 | 13.57 |
Statistical Office of the Republic of Slovenia, 2012.
| 1995 | 1996 | 1997 | 1998 | 1999 | 2000 | 2001 | 2002 | 2003 | 2004 | ||
|---|---|---|---|---|---|---|---|---|---|---|---|
| Diesel D2 - transport | EUR/l | 0.404 | 0.381 | 0.405 | 0.436 | 0.478 | 0.581 | 0.632 | 0.559 | 0.591 | 0.58 |
| Petrol NMB 95 - transport | EUR/l | 0.434 | 0.409 | 0.424 | 0.478 | 0.492 | 0.54 | 0.635 | 0.649 | 0.669 | 0.661 |
| Fuel oil - heating | EUR/l | 0.212 | 0.2 | 0.226 | 0.23 | 0.23 | 0.323 | 0.39 | 0.316 | 0.355 | 0.328 |
| 2005 | 2006 | 2007 | 2008 | 2009 | 2010 | 2011 | |||||
| Diesel D2 - transport | EUR/l | 0.68 | 0.746 | 0.699 | 0.794 | 0.689 | 0.809 | 0.904 | |||
| Petrol NMB 95 - transport | EUR/l | 0.684 | 0.749 | 0.736 | 0.797 | 0.662 | 0.855 | 0.935 | |||
| Fuel oil - heating | EUR/l | 0.406 | 0.476 | 0.416 | 0.542 | 0.387 | 0.484 | 0.6 |
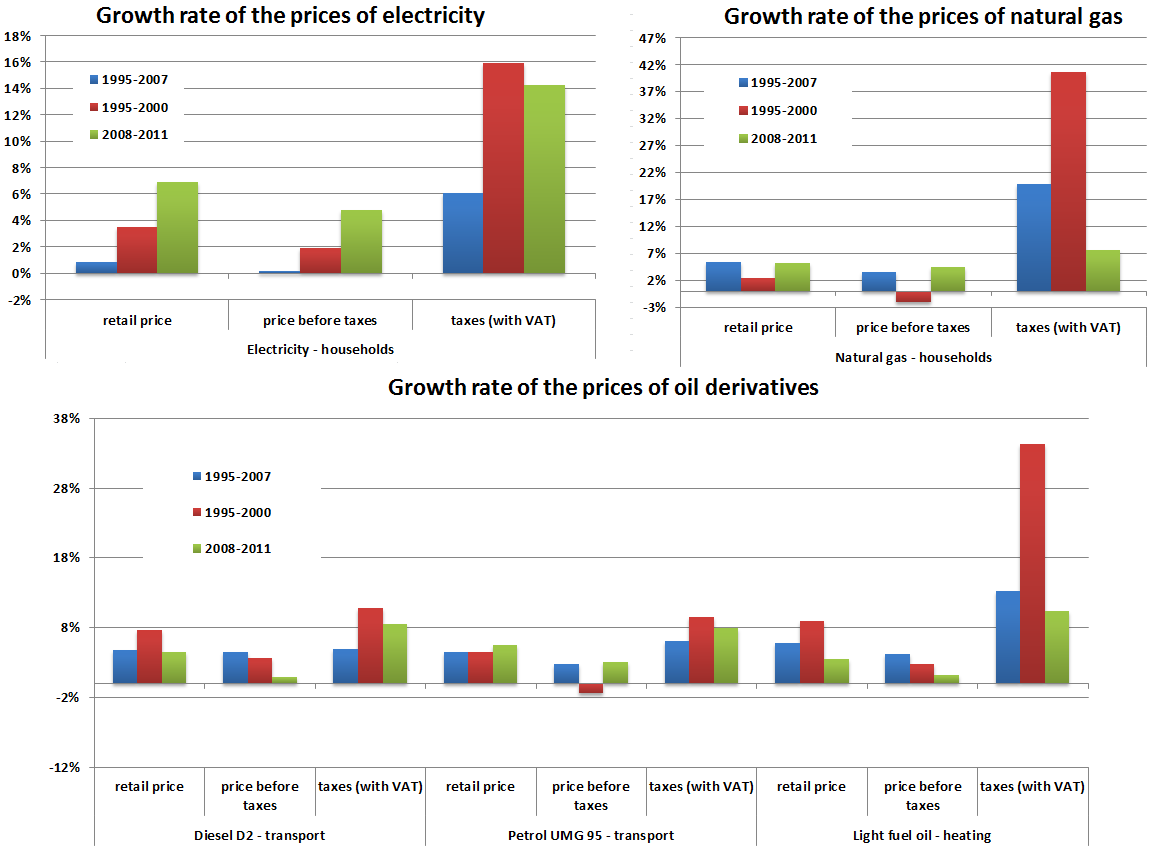
Statistical Office of the Republic of Slovenia, 2012
| 1995-2007 | 1995-2000 | 2008-2011 | ||
|---|---|---|---|---|
| Electricity: households - retail price | % | 0.9 | 3.5 | 6.9 |
| Electricity: households - price before taxes | % | 0.2 | 1.9 | 4.8 |
| Electricity: households - taxes (with VAT) | % | 6.1 | 15.9 | 14.2 |
| Natural gas: households: retail price | % | 5.4 | 2.4 | 5.2 |
| Natural gas: households: price before taxes | % | 3.6 | -1.9 | 4.5 |
| Natural gas: households: taxes (with VAT) | % | 19.9 | 40.7 | 7.7 |
| Diesel D2: transport - retail price | % | 4.7 | 7.6 | 4.5 |
| Diesel D2: transport - price before taxes | % | 4.5 | 3.6 | 0.9 |
| Diesel D2: transport - taxes (with VAT) | % | 4.9 | 10.8 | 8.4 |
| Petrol 95: transport - retail price | % | 4.5 | 4.5 | 5.5 |
| Petrol 95: transport - price before taxes | % | 2.7 | -1.5 | 3 |
| Petrol 95: transport - taxes (with VAT) | % | 6.1 | 9.4 | 7.9 |
| Fuel oil EL - retail price | % | 5.8 | 8.8 | 3.5 |
| Fuel oil EL - price before taxes | % | 4.2 | 2.8 | 1.1 |
| Fuel oil EL - taxes (with VAT) | % | 13.2 | 34.3 | 10.4 |
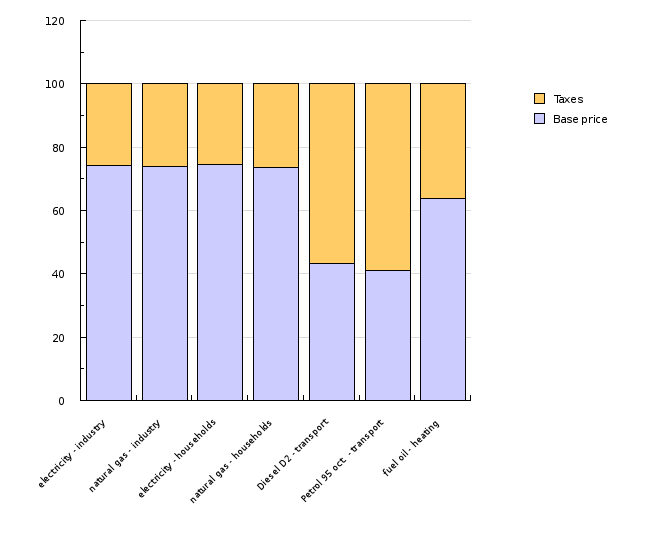
Statistical Office of the Republic of Slovenia, 2012.
| electricity - industry | natural gas - industry | electricity - households | natural gas - households | Diesel D2 - transport | Petrol 95 oct. - transport | fuel oil - heating | ||
|---|---|---|---|---|---|---|---|---|
| Base price | % | 74.2 | 74 | 74.4 | 73.5 | 43.4 | 40.9 | 63.7 |
| Taxes | % | 25.8 | 26 | 25.6 | 26.5 | 56.6 | 59.1 | 36.3 |
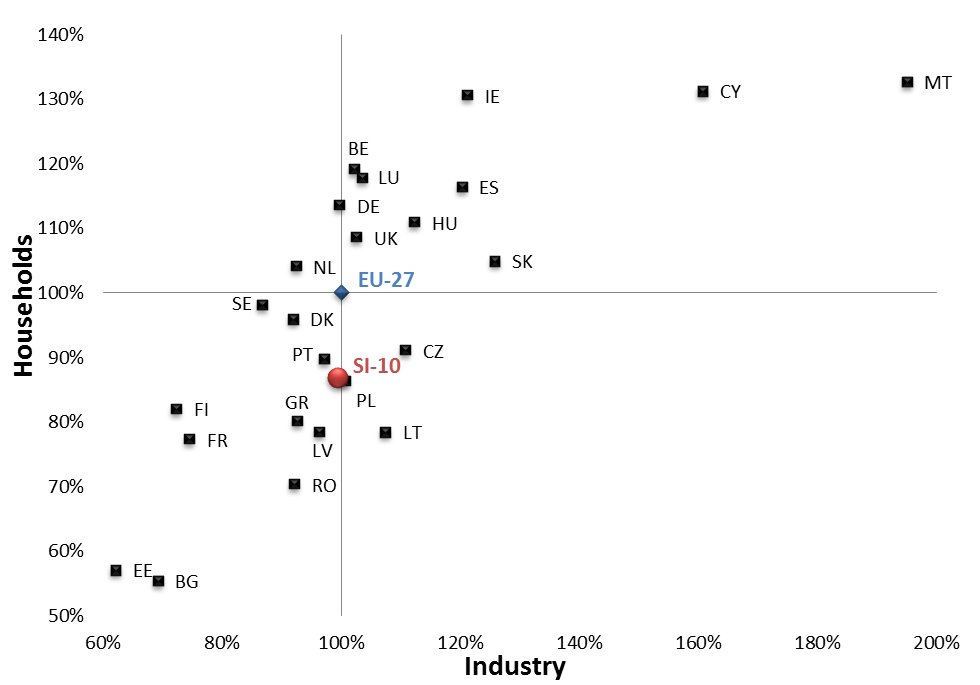
Eurostat, 2012.
| BE | BG | CZ | DK | DE | EE | IE | GR | ES | FR | ||
|---|---|---|---|---|---|---|---|---|---|---|---|
| industry | % | 104.60385439 | 68.3083511777 | 117.451820128 | 93.6830835118 | 96.3597430407 | 65.9528907923 | 120.021413276 | 98.1798715203 | 115.845824411 | 77.3019271949 |
| households | % | 122.716627635 | 53.7080405933 | 96.174863388 | 98.5948477752 | 109.758001561 | 54.9570647931 | 123.653395785 | 80.0156128025 | 124.668227947 | 77.5956284153 |
| CY | LV | LT | LU | HU | MT | NL | AT | PL | PT | ||
| industry | % | 171.841541756 | 105.353319058 | 111.884368308 | 102.78372591 | 104.710920771 | 192.719486081 | 90.0428265525 | 98.1798715203 | 103.104925054 | 96.6809421842 |
| households | % | 135.128805621 | 74.7072599532 | 78.3762685402 | 113.270882123 | 104.293520687 | 126.073380172 | 101.483216237 | 112.568306011 | 89.3832943013 | 79.2349726776 |
| RO | SI-11 | SK | FI | SE | UK | IT | |||||
| industry | % | 85.9743040685 | 95.182012848 | 132.012847966 | 73.4475374732 | 94.9678800857 | 100.535331906 | 122.591006424 | |||
| households | % | 66.1982825917 | 84.231069477 | 107.103825137 | 84.387197502 | 107.416081187 | 106.557377049 | 109.055425449 |
Eurostat, 2012.
| BE | BG | CZ | DK | DE | EE | IE | GR | ES | FR | ||
|---|---|---|---|---|---|---|---|---|---|---|---|
| CY | LV | LT | LU | HU | MT | NL | AT | PL | PT | ||
| RO | SI-11 | SK | FI | SE | UK | IT |
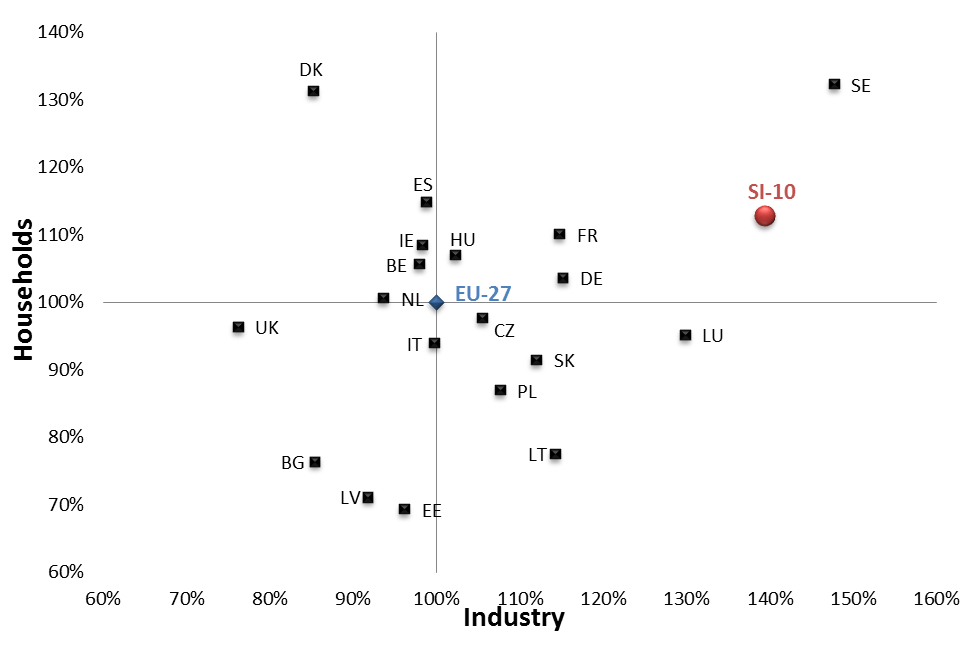
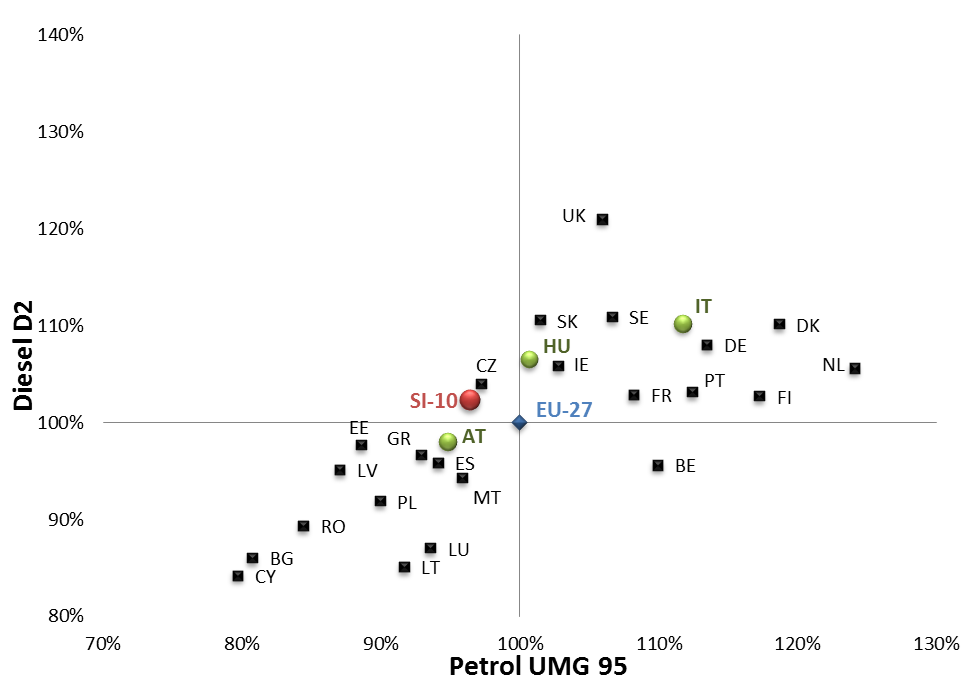
Eurostat, 2012; Oil Bulletin, 2012.
| BE | BG | CY | CZ | DE | DK | EE | ES | FI | FR | ||
|---|---|---|---|---|---|---|---|---|---|---|---|
| NMB | % | 110.147857211 | 83.4694146554 | 83.9367536246 | 99.6672793101 | 109.144824447 | 113.146553681 | 88.7126755548 | 93.3771494001 | 110.930222767 | 106.477500283 |
| D2 | % | 100.069053937 | 88.5420106854 | 90.5573571278 | 104.881486143 | 105.302052266 | 105.426456368 | 97.3562419201 | 95.2718712666 | 101.758541895 | 100.117210364 |
| GR | HU | IE | IT | LT | LU | LV | MT | NL | PL | ||
| NMB | % | 118.35786613 | 96.950175001 | 97.851418514 | 106.804414665 | 93.6126763528 | 91.8205911482 | 88.451144049 | 97.3313274513 | 117.729298931 | 90.3346166833 |
| D2 | % | 111.642648401 | 101.979258849 | 101.208756027 | 105.311683552 | 91.6031541865 | 87.3710069182 | 94.4178973061 | 97.1154597883 | 101.889366853 | 93.3648767835 |
| PT | RO | SE | SI-10 | SK | UK | EU-27 | |||||
| NMB | % | 109.962110403 | 86.811371227 | 110.404930793 | 93.8392874587 | 98.0743146837 | 107.700457267 | 100 | |||
| D2 | % | 102.492927396 | 92.3222901532 | 115.851520064 | 98.9614561314 | 96.5536348144 | 120.312410357 | 100 |
Goals
The Slovenian energy policy that is defined in the Resolution on the National Energy Programme does not set any specific objectives with regard to energy prices; however, it does stipulate mechanisms in the area of competitiveness of energy supply, the implementation of which has a direct influence on higher competitiveness and energy prices.
Methodology
Data for Slovenia
Objectives summarised by: Resolucija o Nacionalnem energetskem programu (ReNEP) (Resolution on the National Energy Programme, Official Gazette of the RS, No. 57/04).
Data source or database: The data on prices of energy products are published by SORS in the SI-STAT Data Portal > Environment and natural resources > Energy > Prices of energy sources for all consumer groups.
Data administrator: Statistical Office of the Republic of Slovenia (Ema Mišič) and Eurostat.
Data acquisition date for the indicator: 14 November 2012.
Methodology and frequency of data collection for the indicator: The data for energy prices are published twice a year; namely, the prices in force on 1 January are published by SORS in the second week of March, and the prices of 1 July of the current year by SORS in the second week of September.
The prices for electricity and natural gas by individual consumer groups are monitored by the Statistical Office of the Republic of Slovenia; since 1992 for electricity and since 1995 for natural gas. The Statistical Office of the Republic of Slovenia also monitors the prices of fuels, but only since 1999. The prices of fuels before that year are available from fuel dealers (Petrol).
The most representative consumer groups for industrial consumers of natural gas and electricity are I3 for consumers of natural gas and Id for consumers of electricity. For household consumers, the most representative consumer groups are D2 for consumers of natural gas and Dc for consumers of electricity.
Data processing methodology: The energy prices published by SORS are current prices. Since these are nominal categories, changes in prices do not reflect real changes. Real changes in prices are reflected only by real prices, which are calculated by the deflation of nominal prices with the GDP deflator, which is published by SORS for every previous year. Energy prices that are indicated in the data sheet are real prices; deflators that converted nominal prices to the level of real prices of 1995 were used for the calculation. The real prices of 1995 were converted into EUR 1995 with the use of the average annual exchange rate of the Bank of Slovenia in 1995. Such calculation enables better comparability of energy prices in Slovenia with average prices in the EU.
Real energy prices are calculated as:
PRt = [(Pt*1/D1995,t)/er1995]
PR-real prices, P – current prices, D – deflator, er – exchange rate.
Geographical coverage: EU-27.
Information concerning data quality:
- Advantages and disadvantages of the indicator: The source of basic data for the entire time series for electricity and natural gas is SORS, which enables a more efficient and consistent analysis of individual sectors; only for prices of fuels before 1999, it was necessary to obtain data from the largest fuel dealer in Slovenia (Petrol).
- Relevance, accuracy, robustness, uncertainty:
Reliability of the indicator (archive data): The data reflect the prices by individual consumers groups that were in force on the first day of January and July. SORS publishes prices that are obtained from suppliers of electricity and natural gas, and not directly from energy consumers. In industry, the majority of contracts between electricity suppliers and consumers are concluded for several years. Prices usually differ inside individual consumers of the same consumer group; therefore, we can conclude that SORS' prices most likely do not reflect the actual conditions in the area.
Uncertainty of the indicator (scenarios/projections): Scenarios and projections are not available.
- Overall assessment (1 = no major comments, 3 = data to be considered with reservation):
Relevance: 1
Accuracy: 2
Completeness over time: 1
Completeness over space: 1
Data for the other countries
Data source or database: Eurostat - Tables by themes > Environment and energy > Energy Statistics - prices, Oil bulletin, link Time series – History from 2005 onwards
Data administrator: Eurostat, European Communities, contact: tren-oil-bulletin@ec.europa.eu
Data acquisition date for the indicator: 14 November 2012.
Methodology and frequency of data collection for the indicator:
In the Oil Bulletin database data on motor fuels are gathered weekly, with and without the taxes. Prices on January 4 are used for each country. Methodology of the data collection is described here.
Data processing methodology:
Weighted average prices for each country are used.
Geographical coverage: EU-27.
Information concerning data quality:
- Advantages and disadvantages of the indicator: The source of basic data for the entire time series for the petrol and diesel is Eurostat, which enables a more efficient and consistent analysis of individual sectors.
- Relevance, accuracy, robustness, uncertainty:
Reliability of the indicator (archive data): The data reflect the prices by individual consumers groups that were in force on the first day of January and July. SORS publishes prices that are obtained from suppliers of electricity and natural gas, and not directly from energy consumers. In industry, the majority of contracts between electricity suppliers and consumers are concluded for several years. Prices usually differ inside individual consumers of the same consumer group; therefore, we can conclude that SORS' prices most likely do not reflect the actual conditions in the area.
Uncertainty of the indicator (scenarios/projections): Prices and trends comparison among the EU member states very likely doesn't necessary reflect the reality due to differences in quality of the products and the structure of the fuel market.
- Overall assessment (1 = no major comments, 3 = data to be considered with reservation):
Relevance: 1
Accuracy: 2
Completeness over time: 1
Completeness over space: 1
Other sources and literature:
- AGEN-RS, 2012. Poročilo o stanju na področju energetike v Sloveniji v letu 2011.
- Oil bulletin.
- Uredba o oblikovanju cen naftnih derivatov (Regulation on the price methodology of oil derivatives, Official Gazette of the RS, No. 91/07).


