[EN20] Energy prices

Key message

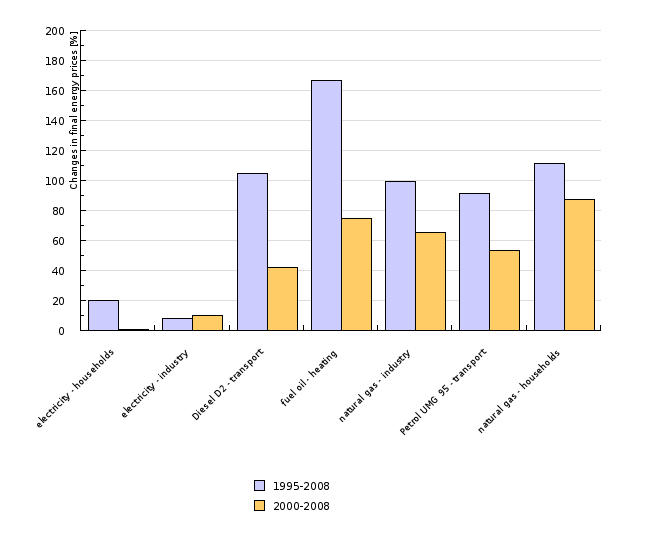
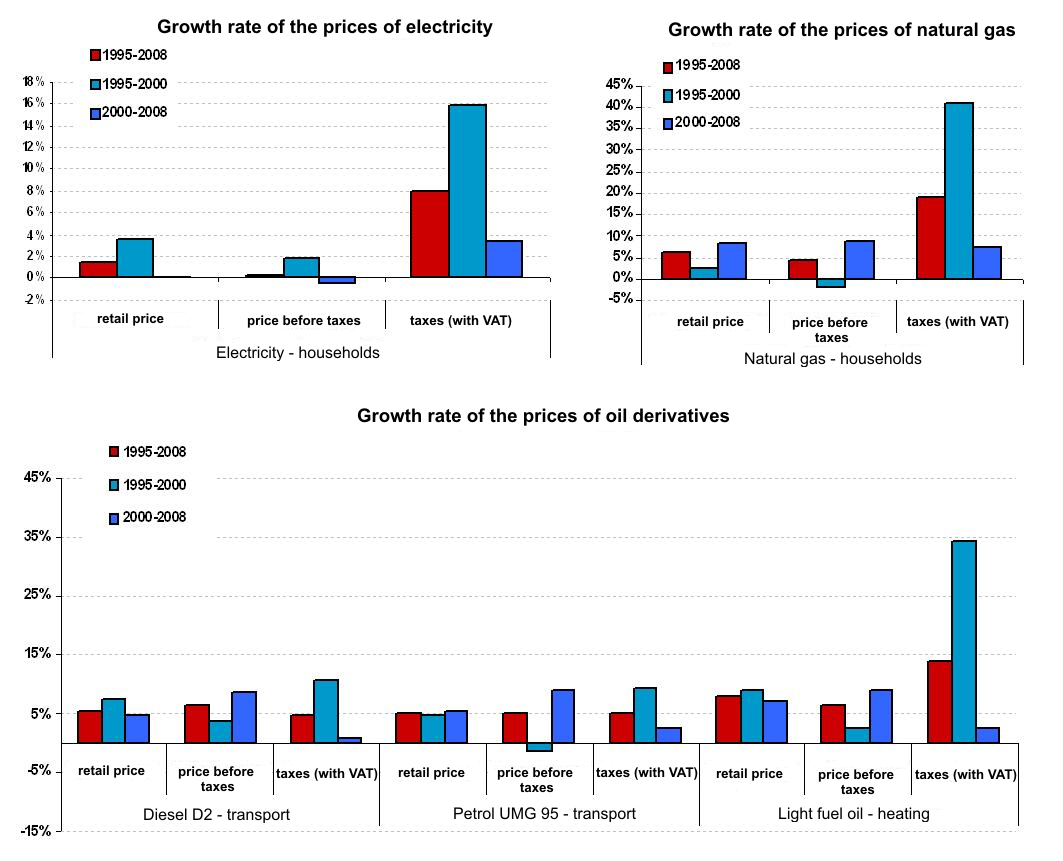
The prices of energy products have been increasing. In the period 2000–2008, the real price of natural gas for households increased the most, followed by heating oil, natural gas for industry, gasoline and diesel. The real price of electricity has increased only by a minimum amount. Taxes contributed only a small portion to higher prices, with the exception of motor fuels.
Definition
The indicator Energy prices shows the final prices of fuels reflecting the basic prices of fuels, including all taxes. The prices for electricity are reflected in EUR per kilowatt hour (EUR/kWh), for natural gas in EUR per gigajoul (EUR/GJ), for liquid fuels in EUR per litre of fuel (EUR/l).
The prices of electricity and natural gas show the final energy prices for typical consumer groups of industrial and household consumers, whereby the prices for industrial consumers do not include the value-added tax (VAT).
Charts
Statistical Office of the Republic of Slovenia, 2009.
| electricity - households | electricity - industry | Diesel D2 - transport | fuel oil - heating | natural gas - industry | Petrol UMG 95 - transport | natural gas - households | ||
|---|---|---|---|---|---|---|---|---|
| 1995-2008 | % | 19.8 | 7.9 | 104.7 | 166.5 | 99.6 | 91.2 | 111.1 |
| 2000-2008 | % | 0.8 | 10.3 | 42.2 | 74.4 | 65.6 | 53.4 | 87.2 |
Statistical Office of the Republic of Slovenia, 2009.
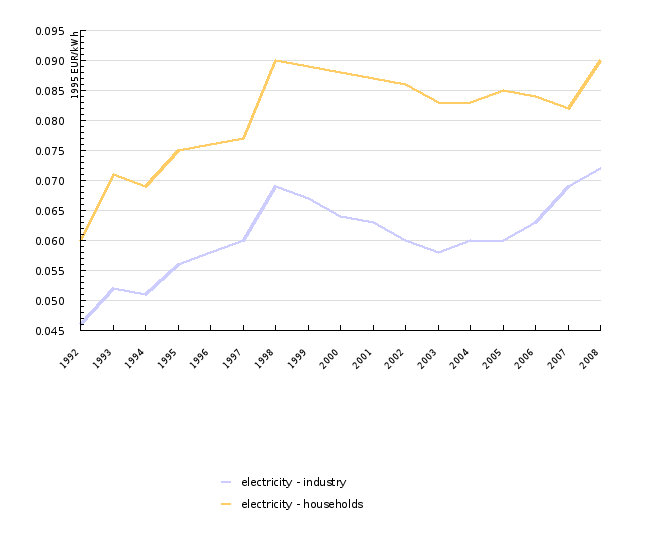
| 1992 | 1993 | 1994 | 1995 | 1996 | 1997 | 1998 | 1999 | 2000 | 2001 | ||
|---|---|---|---|---|---|---|---|---|---|---|---|
| electricity - industry | EUR/kWh | 0.046 | 0.052 | 0.051 | 0.056 | 0.058 | 0.06 | 0.069 | 0.067 | 0.064 | 0.063 |
| electricity - households | EUR/kWh | 0.06 | 0.071 | 0.069 | 0.075 | 0.076 | 0.077 | 0.09 | 0.089 | 0.088 | 0.087 |
| 2002 | 2003 | 2004 | 2005 | 2006 | 2007 | 2008 | |||||
| electricity - industry | EUR/kWh | 0.06 | 0.058 | 0.06 | 0.06 | 0.063 | 0.069 | 0.072 | |||
| electricity - households | EUR/kWh | 0.086 | 0.083 | 0.083 | 0.085 | 0.084 | 0.082 | 0.09 |
Statistical Office of the Republic of Slovenia, 2009.
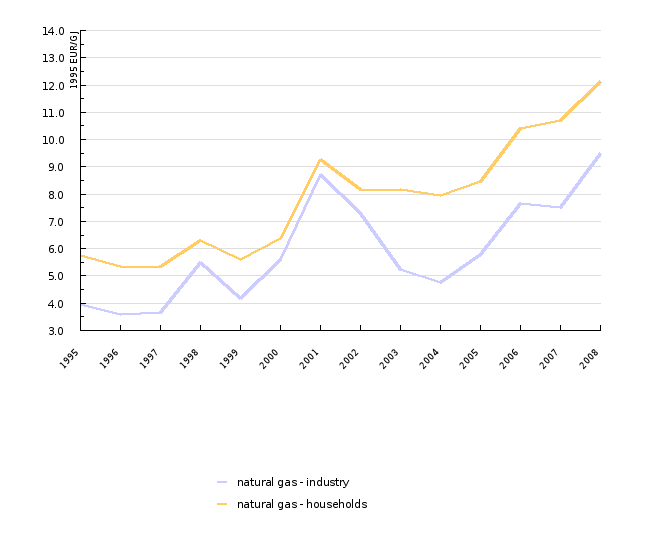
| 1995 | 1996 | 1997 | 1998 | 1999 | 2000 | 2001 | 2002 | 2003 | 2004 | ||
|---|---|---|---|---|---|---|---|---|---|---|---|
| natural gas - industry | EUR/GJ | 3.971 | 3.576 | 3.655 | 5.478 | 4.179 | 5.595 | 8.714 | 7.276 | 5.253 | 4.755 |
| natural gas - households | EUR/GJ | 5.754 | 5.338 | 5.338 | 6.309 | 5.61 | 6.376 | 9.253 | 8.17 | 8.179 | 7.947 |
| 2005 | 2006 | 2007 | 2008 | ||||||||
| natural gas - industry | EUR/GJ | 5.791 | 7.668 | 7.516 | 9.507 | ||||||
| natural gas - households | EUR/GJ | 8.468 | 10.423 | 10.685 | 12.146 |
Statistical Office of the Republic of Slovenia, 2009.
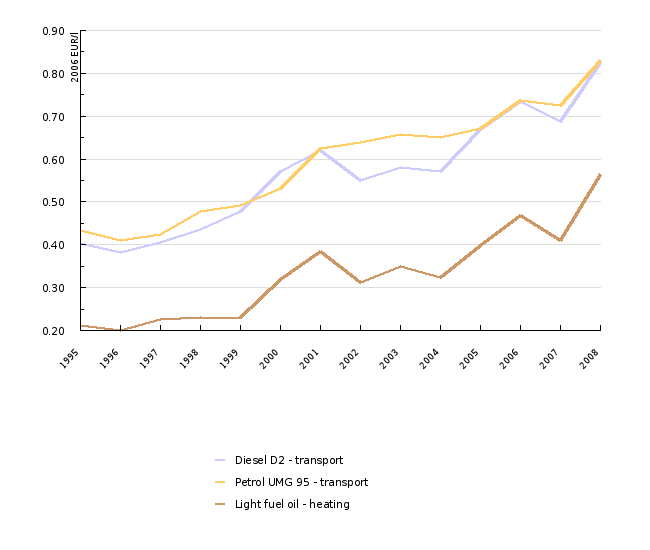
| 1995 | 1996 | 1997 | 1998 | 1999 | 2000 | 2001 | 2002 | 2003 | 2004 | ||
|---|---|---|---|---|---|---|---|---|---|---|---|
| Diesel D2 - transport | EUR/l | 0.404 | 0.381 | 0.405 | 0.436 | 0.478 | 0.571 | 0.621 | 0.55 | 0.581 | 0.57 |
| Petrol UMG 95 - transport | EUR/l | 0.434 | 0.409 | 0.424 | 0.478 | 0.492 | 0.531 | 0.624 | 0.638 | 0.658 | 0.65 |
| Light fuel oil - heating | EUR/l | 0.212 | 0.2 | 0.226 | 0.23 | 0.23 | 0.318 | 0.384 | 0.311 | 0.349 | 0.323 |
| 2005 | 2006 | 2007 | 2008 | ||||||||
| Diesel D2 - transport | EUR/l | 0.669 | 0.734 | 0.688 | 0.826 | ||||||
| Petrol UMG 95 - transport | EUR/l | 0.672 | 0.737 | 0.725 | 0.829 | ||||||
| Light fuel oil - heating | EUR/l | 0.399 | 0.469 | 0.41 | 0.564 |
Statistical Office of the Republic of Slovenia, 2009; Petrol, 2007.
| 1995-2008 | 1995-2000 | 2000-2008 | ||
|---|---|---|---|---|
| Electricity: households - retail price | % | 1.3 | 3.6 | -0.6 |
| Electricity: households - price before taxes | % | 0.5 | 2 | -0.8 |
| Electricity: households - taxes (with VAT) | % | 7 | 16 | 0.1 |
| Natural gas: households: retail price | % | 5.8 | 2.5 | 8.6 |
| Natural gas: households: price before taxes | % | 3.8 | -1.9 | 8.7 |
| Natural gas: households: taxes (with VAT) | % | 21.9 | 40.8 | 8.2 |
| Diesel D2: transport - retail price | % | 5.8 | 7.6 | 4.3 |
| Diesel D2: transport - price before taxes | % | 6.2 | 3.6 | 8.4 |
| Diesel D2: transport - taxes (with VAT) | % | 5.4 | 10.9 | 1.1 |
| Petrol UMG 95: transport - retail price | % | 5.2 | 4.6 | 5.6 |
| Petrol UMG 95: transport - price before taxes | % | 3.9 | -1.4 | 8.5 |
| Petrol UMG 95: transport - taxes (with VAT) | % | 6.3 | 9.5 | 3.7 |
| Light fuel oil - retail price | % | 7.7 | 8.9 | 6.7 |
| Light fuel oil - price before taxes | % | 6 | 2.8 | 8.8 |
| Light fuel oil - taxes (with VAT) | % | 15.6 | 34.3 | 2 |
Eurostat, 2009.
| EU15 | BE | BG | CZ | DK | DE | EE | IE | GR | ES | ||
|---|---|---|---|---|---|---|---|---|---|---|---|
| industry | % | 100 | 112 | 63 | 124 | 89 | 105 | 58 | 147 | 98 | 104 |
| households | % | 100 | 126 | 50 | 89 | 101 | 109 | 54 | 131 | 80 | 94 |
| FR | CY | LV | LT | LU | HU | MA | NL | AU | PL | ||
| industry | % | 67 | 159 | 75 | 94 | 113 | 127 | 138 | 97 | 102 | 92 |
| households | % | 79 | 128 | 67 | 61 | 119 | 107 | 107 | 81 | 118 | 74 |
| PT | RO | SI-08 | SK | FI | SE | VB | SI-07 | SI-06 | SI-05 | ||
| industry | % | 101 | 100 | 102 | 130 | 70 | 78 | 106 | 79 | 75 | 79 |
| households | % | 76 | 96 | 77 | 91 | 117 | 67 | 73 | 75 | 74 | 71 |
| SI-04 | SI-03 | SI-02 | SI-01 | SI-00 | |||||||
| industry | % | 84 | 76 | 81 | 78 | 75 | |||||
| households | % | 71 | 68 | 62 | 68 | 62 |
Eurostat, 2009.
| EA-15 | BE | BG | CZ | DE | EE | IE | ES | FR | IT | ||
|---|---|---|---|---|---|---|---|---|---|---|---|
| industry | % | 100 | 96 | 61 | 91 | 121 | 73 | 118 | 82 | 97 | 94 |
| households | % | 100 | 102 | 64 | 80 | 105 | 58 | 104 | 108 | 96 | 94 |
| LV | LT | LU | MA | NL | AU | PL | PT | RO | SI-08 | ||
| industry | % | 85 | 94 | 121 | 101 | 87 | np | 90 | 93 | 67 | 100 |
| households | % | 65 | 61 | 124 | 73 | 94 | 93 | 74 | 130 | 47 | 95 |
| SK | SE | VB | SI-07 | SI-06 | SI-05 | SI-04 | SI-03 | SI-02 | SI-01 | ||
| industry | % | 95 | 134 | 78 | 84 | 89 | 87 | 80 | 84 | 108 | 116 |
| households | % | 75 | 116 | 82 | 88 | 96 | 88 | 87 | 83 | 79 | 81 |
| SI-00 | |||||||||||
| industry | % | 97 | |||||||||
| households | % | 60 |
Eurostat, 2009; Oil Buletin, 2009.
| EU15 | BE | CZ | DK | DE | EE | IE | GR | ES | FR | ||
|---|---|---|---|---|---|---|---|---|---|---|---|
| UMG 95 | % | 100 | 109 | 92 | 103 | 104 | 78 | 92 | 85 | 85 | 103 |
| D2 | % | 100 | 97 | 107 | 104 | 110 | 98 | 106 | 99 | 93 | 105 |
| IT | CY | LV | LT | LU | HU | MT | NL | AT | PL | ||
| UMG 95 | % | 105 | 79 | 80 | 79 | 89 | 88 | 84 | 115 | 91 | 91 |
| D2 | % | 112 | 89 | 92 | 92 | 90 | 103 | 90 | 104 | 102 | 99 |
| PT | SI-08 | SK | FI | SE | UK | SI-07 | SI-06 | SI-05 | SI-04 | ||
| UMG 95 | % | 108 | 82 | 90 | 105 | 98 | 108 | 82 | 79 | 76 | 79 |
| D2 | % | 106 | 93 | 108 | 103 | 109 | 129 | 89 | 87 | 87 | 87 |
| SI-03 | SI-02 | SI-01 | |||||||||
| UMG 95 | % | 80 | 79 | 78 | |||||||
| D2 | % | 90 | 89 | 85 |
Goals
The Slovenian energy policy that is defined in the Resolution on the National Energy Programme does not set any specific objectives with regard to energy prices; however, it does stipulate mechanisms in the area of competitiveness of energy supply, the implementation of which has a direct influence on higher competitiveness and energy prices.
Comment
The absolute level of energy prices and their trends have a strong influence on total energy consumption and changes in the demand for various fuels. The growth of energy prices represents an initiative for the reduction of energy consumption with final users, which would also reduce the impact on the environment. The relative changes of prices of energy products, which are mutually exchangeable, influence the substitution of fuels.
The opening of the market is significant for the provision of competitive energy supply, especially of industrial consumers, for higher efficiency of operations of energy companies, higher transparency of energy supply and energy markets as well as better provision of energy services to consumers. The energy policy does not have an indirect influence on the basic price of energy; namely, the price for the use of networks is also shaped by the Energy Agency of the Republic of Slovenia. The only mechanism, by which the state can directly influence the final price of energy, is the implementation of tax policy, through which the amount of energy taxation is determined.
In general, the prices of energy products have increased in real terms with regard to 1995. The main reason has been the high prices of oil and gas on international markets. The prices of electricity, which were in 2006 in real terms the only ones that were comparable with the level of prices from 1995, became in 2008 in real terms higher than the prices from 1995. For the formation of prices of electricity, especially liberalisation, the opening of markets and a higher level of taxation had a strong impact; in recent years, the lack of supply in the wider European market has also had an effect on prices.
Electricity
After 1992, the prices of electricity in Slovenia increased primarily due to deregulation in the area of prices and the elimination of cross subsidizing. In general, the prices of electricity began to reflect the costs of its production more. In industry, prices significantly decreased in 1999 due to higher competitiveness among energy providers, as a result of the opening of the market. In the period 2000–2005, the prices settled down and there were not any significant changes. In 2006, the prices of electricity began to increase in real terms, primarily as a result of greater demand, lack of offers of electricity and higher prices of oil derivatives in the world market; such a trend continued also in 2008.
The trends of electricity prices for households were in the period 1995–2000 similar to those in industry, whereby the main reason for the increase was higher taxation (see figure 5). After 2000, there were no significant changes in prices for households. The main reason was the state control of prices. On 1 July 2007, the market was completely opened; however, no significant price changes were noticed in 2008.
Natural gas
Until 1999, moderate growth in the use of natural gas was typical for Slovenia; in the period 1999–2001, this growth became more intensive. The reasons for growth before 2000 and afterwards are different. In the period 1995–2000, the main reason for the increase in the price of natural gas was higher taxation (increase in the share of taxes in the final price of natural gas). After 2000, inconsistent trends of prices for household and industrial consumers were recorded; in recent years, a strong increasing trend was recorded. The prices of natural gas for industrial consumers were in 2008, with regard to 2000, more than 60 percent higher in real terms; for households, prices were more than 80 percent higher. The main reason for the increase in final prices was the higher basic price of natural gas – as a result of higher import prices and general conditions in international markets of natural gas (see Figure 5).
Oil derivatives and heating oil
In Slovenia, oil derivatives are the most expensive energy product, mainly due to a relatively high share of taxes in their final prices. Slovenia is also one of the rare EU countries that entirely regulates the price of oil derivatives. It has a prescribed methodology for the pricing of fuels, while the state can also influence the final prices by increasing excise duties. The basic purpose of introducing the control of prices of oil derivatives was the protection of consumers against the oligopolistic formation of basic prices by dealers with fuels and also the possibility of implementing protection measures against the influence of global prices of oil on inflation in Slovenia. Since 1995, the prices of oil derivatives have been increasing in real terms with an average annual growth rate above 4.5 %; however, the main reason for growth in the period before 2000 and afterwards is not the same. In the first period, the growth of prices was primarily a result of higher taxation of oil derivatives (introduction of excise duty and VAT), while the main reason for the growth of retail prices of oil derivatives in recent years is primarily the result of the growth of basic prices of fuels due to higher prices of oil in global markets.
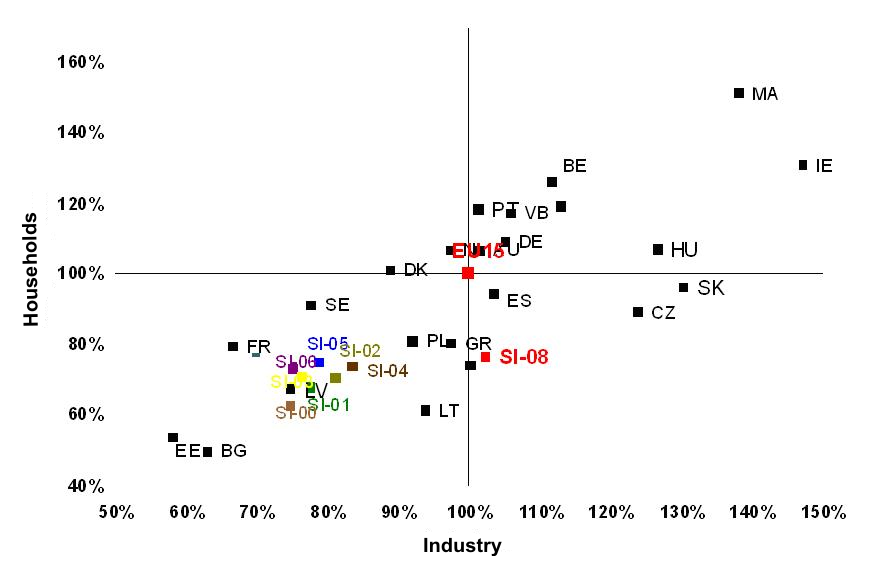
The prices of electricity in Slovenia remain below the level of EU-15 prices for tariff (household) consumers; for industrial consumers, energy prices are higher. According to purchasing power (considering the standard of living in terms of prices), prices in Slovenia in 2008 were 24 % lower than the average price in the EU-15. The prices of electricity for industrial consumers in 2008 were 2.5 % higher than the EU-15 average.
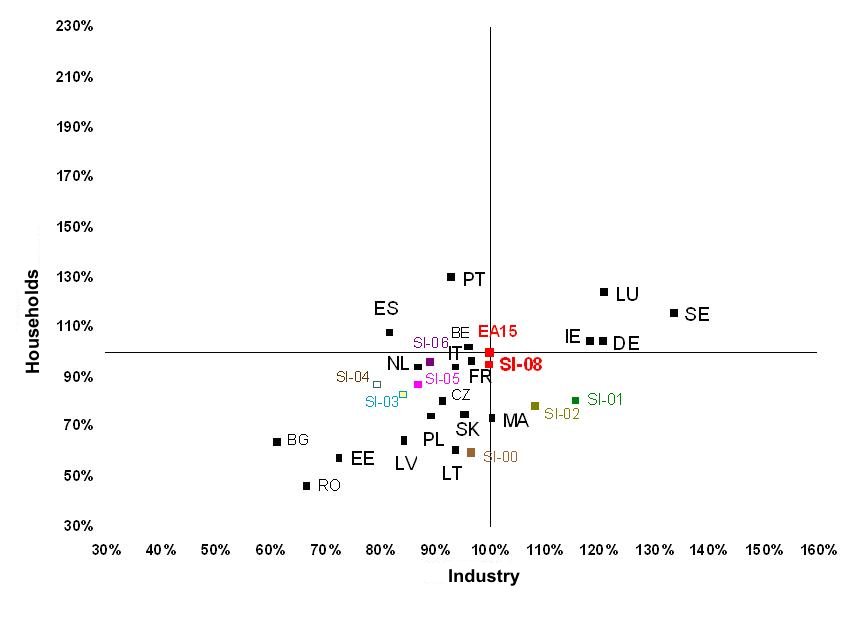
In 2008, the prices of natural gas remained below the level of the EA-15 for industrial and household consumers, whereby the price of natural gas has been, in recent years, approaching the European average. According to purchasing power (considering the standard of living in terms of prices), the price of natural gas for tariff consumers in 2008 was 5 % lower than the EA-15 average.
In the area of oil derivatives, the prices of unleaded gasoline (UMG 95) and diesel fuel (D2) in 2008 were around 18 % (UMG 95) and 11 % (D2) below the average prices in the EU-15. There are two reasons – lower basic prices of fuels and primarily the taxation level of fuels, which remains significantly below the level of the most developed countries.
Methodology
Data for Slovenia and other countries
Objectives summarised by: Resolucija o Nacionalnem energetskem programu (ReNEP) (Resolution on the National Energy Programme, Official Gazette of the RS, No. 57/04).
Source database or source: The data on prices of energy products are published by SORS in the SI-STAT Data Portal > Environment and natural resources > Energy > Prices of energy sources for all consumer groups.
Data administrator: Statistical Office of the Republic of Slovenia (Mojca Suvorov) and Eurostat.
Data acquisition date for the indicator: 5 December 2009.
Methodology and frequency of data collection for the indicator: The data for energy prices are published twice a year; namely, the prices in force on 1 January are published by SORS in the second week of March, and the prices of 1 July of the current year by SORS in the second week of September.
The prices for electricity and natural gas by individual consumer groups are monitored by the Statistical Office of the Republic of Slovenia; since 1992 for electricity and since 1995 for natural gas. The Statistical Office of the Republic of Slovenia also monitors the prices of fuels, but only since 1999. The prices of fuels before that year are available from fuel dealers (Petrol).
The most representative consumer groups for industrial consumers of natural gas and electricity are I3 for consumers of natural gas and Id for consumers of electricity. For household consumers, the most representative consumer groups are D2 for consumers of natural gas and Dc for consumers of electricity.
Data processing methodology: The energy prices published by SORS are current prices. Since these are nominal categories, changes in prices do not reflect real changes. Real changes in prices are reflected only by real prices, which are calculated by the deflation of nominal prices with the GDP deflator, which is published by SORS for every previous year. Energy prices that are indicated in the data sheet are real prices; deflators that converted nominal prices to the level of real prices of 1995 were used for the calculation. The real prices of 1995 were converted into EUR 1995 with the use of the average annual exchange rate of the Bank of Slovenia in 1995. Such calculation enables better comparability of energy prices in Slovenia with average prices in the EU.
Real energy prices are calculated as:
PRt = [(Pt*1/D1995,t)/er1995]
PR-real prices, P – current prices, D – deflator, er – exchange rate.
Geographical coverage: The EA-15 is composed of: Austria, Belgium, Cyprus, Finland, France, Germany, Greece, Ireland, Italy, Luxembourg, Malta, the Netherlands, Portugal, Spain, Sweden, the United Kingdom and Slovenia. The EU-15 includes old EU Member States (Austria, Belgium, Denmark, Finland, France, Germany, Greece, Ireland, Italy, Luxembourg, the Netherlands, Portugal, Spain, Sweden, the United Kingdom). The EU-10 includes Member States that joined the EU in 2004 (Cyprus, Czech Republic, Estonia, Hungary, Lithuania, Latvia, Malta, Poland, Slovenia, Slovakia). The EU-12 includes, besides the EU-10, Bulgaria and Romania. The EU-27 includes the EU-15 and EU-12, while the EU-25 includes the EU-15 and EU-10.
Information concerning data quality:
- Advantages and disadvantages of the indicator: The source of basic data for the entire time series for electricity and natural gas is SORS, which enables a more efficient and consistent analysis of individual sectors; only for prices of fuels before 1999, it was necessary to obtain data from the largest fuel dealer in Slovenia (Petrol).
- Relevance, accuracy, robustness, uncertainty:
Reliability of the indicator (archive data): The data reflect the prices by individual consumers groups that were in force on the first day of January and July. SORS publishes prices that are obtained from suppliers of electricity and natural gas, and not directly from energy consumers. In industry, the majority of contracts between electricity suppliers and consumers are concluded for several years. Prices usually differ inside individual consumers of the same consumer group; therefore, we can conclude that SORS' prices most likely do not reflect the actual conditions in the area.
Uncertainty of the indicator (scenarios/projections): Scenarios and projections are not available.
- Overall assessment (1 = no major comments, 3 = data to be considered with reservation):
Relevance: 1
Accuracy: 2
Completeness over time: 1
Completeness over space: 1
Other sources and literature:
- MG, 2007. Letni energetski pregled za leto 2005 (Annual energy review for 2005).
- Oil bulletin.
- Uredba o oblikovanju cen naftnih derivatov (Regulation on the price methodology of oil derivatives, Official Gazette of the RS, No. 91/07).


