[ZR15] Emissions of particulate matter
[ZR15] Emissions of particulate matter

Key message

Definition
Charts
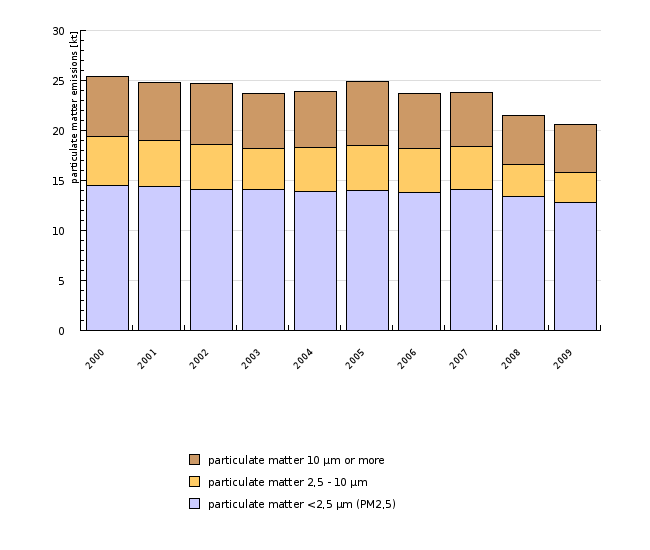
Figure ZR15-1: Gibanje izpustov delcev v zrak v obdobju 2000-2009 razdeljenih glede na velikost
Sources:
Airnet, Državne evidence izpustov, Agencija RS za okolje, 2011
| 2000 | 2001 | 2002 | 2003 | 2004 | 2005 | 2006 | 2007 | 2008 | 2009 | ||
|---|---|---|---|---|---|---|---|---|---|---|---|
| particulate matter | kt | 14.499 | 14.353 | 14.125 | 14.086 | 13.902 | 14.019 | 13.838 | 14.135 | 13.447 | 12.78 |
| particulate matter 2,5 - 10 µm | kt | 4.881 | 4.66 | 4.473 | 4.08 | 4.378 | 4.509 | 4.353 | 4.313 | 3.112 | 3.01 |
| particulate matter | kt | 19.38 | 19.013 | 18.598 | 18.165 | 18.28 | 18.528 | 18.191 | 18.448 | 16.559 | 15.79 |
| particulate matter 10 µm or more | kt | 6.003 | 5.795 | 6.125 | 5.502 | 5.571 | 6.345 | 5.556 | 5.395 | 4.951 | 4.847 |
| total suspended particles (TSP) | kt | 25.382 | 24.808 | 24.724 | 23.667 | 23.851 | 24.873 | 23.748 | 23.843 | 21.51 | 20.637 |
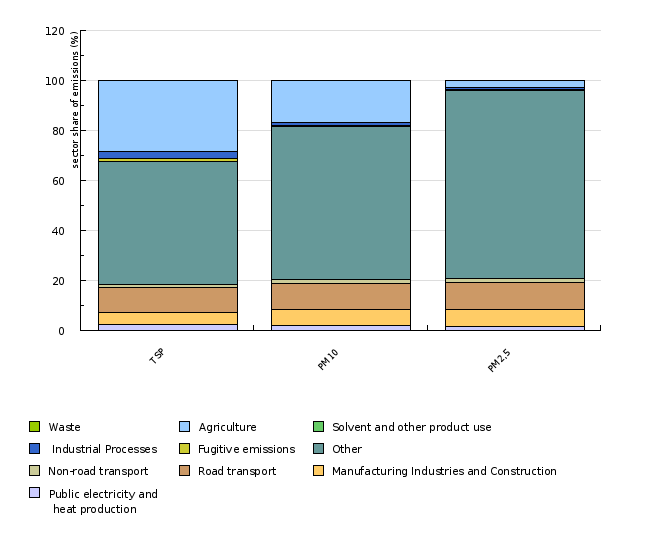
Figure ZR15-2: Struktura izpustov delcev različnih velikosti leta 2009 glede na vir onesnaževanja
Sources:
Airnet, Državne evidence izpustov, Agencija RS za okolje, 2011
| TSP | PM10 | PM2,5 | ||
|---|---|---|---|---|
| Public electricity and heat production |
kt | 0.46 | 0.34 | 0.19 |
| Manufacturing Industries and Construction |
kt | 1.02 | 0.95 | 0.9 |
| Road transport | kt | 2.09 | 1.7 | 1.38 |
| Non-road transport | kt | 0.2 | 0.2 | 0.2 |
| Other | kt | 10.23 | 9.67 | 9.63 |
| Fugitive emissions | kt | 0.22 | 0.11 | 0.02 |
| Industrial Processes | kt | 0.6 | 0.19 | 0.12 |
| Solvent and other product use | kt | 0.01 | 0 | 0 |
| Agriculture | kt | 5.8 | 2.62 | 0.36 |
| Waste | kt | 0.02 | 0.01 | 0 |
| Public electricity and heat production |
% | 2.23 | 2.18 | 1.46 |
| Manufacturing Industries and Construction | % | 4.94 | 6.03 | 7.04 |
| Road transport | % | 10.11 | 10.75 | 10.79 |
| Non-road transport | % | 0.96 | 1.24 | 1.53 |
| Other | % | 49.56 | 61.25 | 75.33 |
| Fugitive emissions | % | 1.06 | 0.68 | 0.13 |
| Industrial Processes | % | 2.89 | 1.22 | 0.92 |
| Solvent and other product use | % | 0.05 | 0 | 0 |
| Agriculture | % | 28.11 | 16.59 | 2.78 |
| Waste | % | 0.1 | 0.06 | 0.02 |
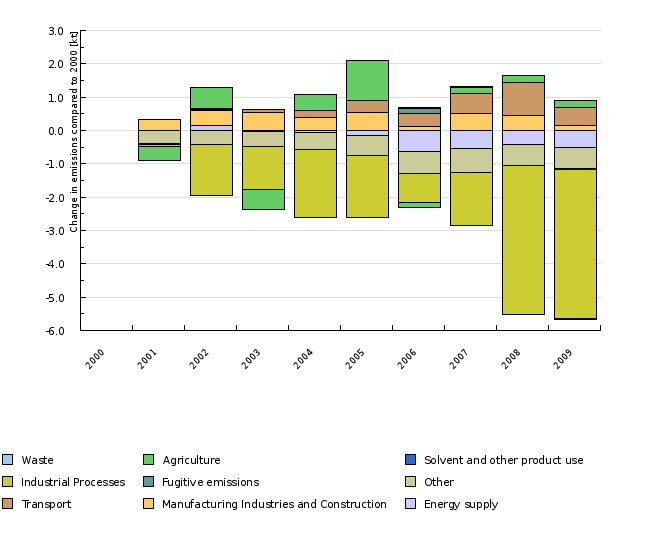
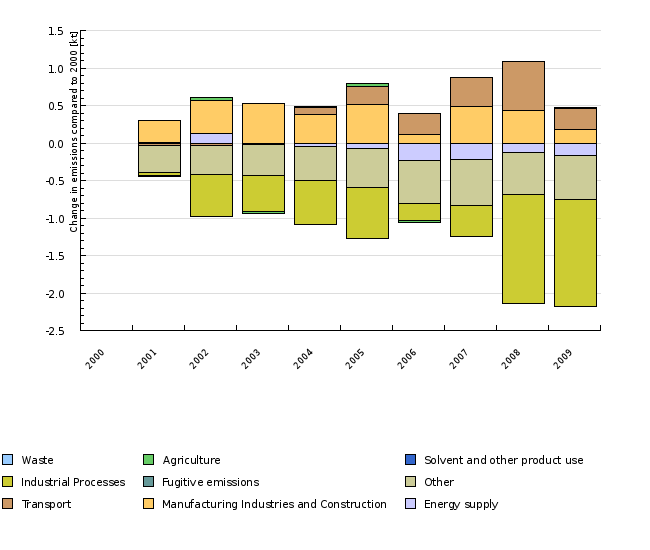
Figure ZR15-3: Sprememba izpustov prašnih delcev vseh velikosti po virih glede na leto 2000 v obdobju 2001-2009
Sources:
Airnet, Državne evidence izpustov, Agencija RS za okolje, 2011
| 2000 | 2001 | 2002 | 2003 | 2004 | 2005 | 2006 | 2007 | 2008 | 2009 | ||
|---|---|---|---|---|---|---|---|---|---|---|---|
| Emissions by sector | |||||||||||
| Energy supply | kt | 0.96 | 0.94 | 1.1 | 0.94 | 0.9 | 0.79 | 0.33 | 0.42 | 0.54 | 0.46 |
| Manufacturing Industries and Construction | kt | 0.86 | 1.18 | 1.33 | 1.41 | 1.25 | 1.41 | 0.97 | 1.37 | 1.31 | 1.02 |
| Transport | kt | 1.75 | 1.76 | 1.77 | 1.83 | 1.95 | 2.09 | 2.16 | 2.36 | 2.75 | 2.28 |
| Other | kt | 10.88 | 10.5 | 10.46 | 10.43 | 10.37 | 10.29 | 10.23 | 10.16 | 10.25 | 10.23 |
| Fugitive emissions | kt | 0.23 | 0.21 | 0.24 | 0.25 | 0.23 | 0.23 | 0.36 | 0.24 | 0.23 | 0.22 |
| Industrial Processes | kt | 5.09 | 5.03 | 3.56 | 3.79 | 3.05 | 3.23 | 4.2 | 3.51 | 0.63 | 0.6 |
| Solvent and other product use | kt | 0.02 | 0.02 | 0.02 | 0.02 | 0.01 | 0.03 | 0.04 | 0.02 | 0 | 0.01 |
| Agriculture | kt | 5.59 | 5.15 | 6.24 | 5 | 6.07 | 6.78 | 5.44 | 5.77 | 5.78 | 5.8 |
| Waste | kt | 0.02 | 0.02 | 0.02 | 0.02 | 0.02 | 0.02 | 0.02 | 0.02 | 0.02 | 0.02 |
| Change in emissions compared to 2000 | |||||||||||
| Energy supply | kt | -0.01 | 0.15 | -0.02 | -0.06 | -0.16 | -0.63 | -0.54 | -0.42 | -0.5 | |
| Manufacturing Industries and Construction | kt | 0.32 | 0.46 | 0.54 | 0.39 | 0.54 | 0.11 | 0.5 | 0.45 | 0.16 | |
| Transport | kt | 0.01 | 0.03 | 0.08 | 0.21 | 0.35 | 0.42 | 0.61 | 1.01 | 0.54 | |
| Other | kt | -0.38 | -0.42 | -0.45 | -0.51 | -0.59 | -0.65 | -0.73 | -0.64 | -0.65 | |
| Fugitive emissions | kt | -0.02 | 0.01 | 0.02 | 0 | 0 | 0.14 | 0.01 | 0 | -0.01 | |
| Industrial Processes | kt | -0.06 | -1.53 | -1.3 | -2.04 | -1.86 | -0.89 | -1.58 | -4.46 | -4.49 | |
| Solvent and other product use | kt | 0 | 0 | 0 | -0 | 0.01 | 0.02 | 0 | -0.02 | -0.01 | |
| Agriculture | kt | -0.44 | 0.65 | -0.58 | 0.49 | 1.2 | -0.15 | 0.18 | 0.2 | 0.22 | |
| Waste | kt | 0 | 0 | 0 | 0 | 0 | 0 | 0 | 0 | 0 |
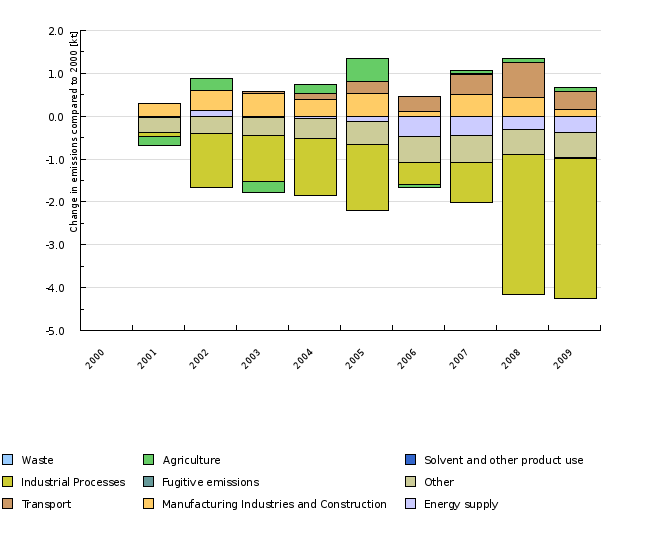
Figure ZR15-4: Sprememba izpustov delcev PM10 po virih glede na leto 2000 v obdobju 2001-2009
Sources:
Airnet, Državne evidence izpustov, Agencija RS za okolje, 2011
| 2000 | 2001 | 2002 | 2003 | 2004 | 2005 | 2006 | 2007 | 2008 | 2009 | ||
|---|---|---|---|---|---|---|---|---|---|---|---|
| Emissions by sector | |||||||||||
| Energy supply | kt | 0.72 | 0.72 | 0.87 | 0.7 | 0.67 | 0.6 | 0.25 | 0.28 | 0.41 | 0.34 |
| Manufacturing Industries and Construction | kt | 0.79 | 1.09 | 1.24 | 1.32 | 1.17 | 1.31 | 0.91 | 1.28 | 1.23 | 0.95 |
| Transport | kt | 1.5 | 1.49 | 1.49 | 1.53 | 1.64 | 1.79 | 1.84 | 1.98 | 2.31 | 1.89 |
| Other | kt | 10.26 | 9.9 | 9.86 | 9.84 | 9.79 | 9.72 | 9.67 | 9.62 | 9.68 | 9.67 |
| Fugitive emissions | kt | 0.11 | 0.1 | 0.12 | 0.12 | 0.11 | 0.11 | 0.12 | 0.12 | 0.11 | 0.11 |
| Industrial Processes | kt | 3.47 | 3.39 | 2.21 | 2.39 | 2.15 | 1.94 | 2.95 | 2.56 | 0.2 | 0.19 |
| Solvent and other product use | kt | 0 | 0 | 0 | 0 | 0 | 0 | 0 | 0 | 0 | 0 |
| Agriculture | kt | 2.52 | 2.32 | 2.81 | 2.26 | 2.74 | 3.06 | 2.46 | 2.6 | 2.61 | 2.62 |
| Waste | kt | 0.01 | 0.01 | 0.01 | 0.01 | 0.01 | 0.01 | 0.01 | 0.01 | 0.01 | 0.01 |
| Change in emissions compared to 2000 | |||||||||||
| Energy supply | kt | -0.01 | 0.14 | -0.02 | -0.05 | -0.13 | -0.48 | -0.44 | -0.32 | -0.38 | |
| Manufacturing Industries and Construction | kt | 0.31 | 0.45 | 0.53 | 0.38 | 0.52 | 0.12 | 0.5 | 0.44 | 0.17 | |
| Transport | kt | -0.01 | -0.01 | 0.04 | 0.15 | 0.29 | 0.34 | 0.49 | 0.81 | 0.4 | |
| Other | kt | -0.36 | -0.4 | -0.42 | -0.48 | -0.54 | -0.59 | -0.65 | -0.58 | -0.59 | |
| Fugitive emissions | kt | -0.01 | 0.01 | 0.01 | 0 | 0 | 0 | 0.01 | 0 | -0.01 | |
| Industrial Processes | kt | -0.09 | -1.27 | -1.08 | -1.32 | -1.53 | -0.52 | -0.91 | -3.27 | -3.28 | |
| Solvent and other product use | kt | 0 | 0 | 0 | 0 | 0 | 0 | 0 | 0 | 0 | |
| Agriculture | kt | -0.2 | 0.29 | -0.26 | 0.22 | 0.54 | -0.06 | 0.08 | 0.09 | 0.1 | |
| Waste | kt | 0 | 0 | 0 | 0 | 0 | 0 | 0 | 0 | 0 |
Figure ZR15-5: Sprememba izpustov prašnih delcev vseh velikosti (TSP) po virih glede na leto 2000 v obdobju 2001-2009
Sources:
Airnet, Državne evidence izpustov, Agencija RS za okolje, 2011
| 2000 | 2001 | 2002 | 2003 | 2004 | 2005 | 2006 | 2007 | 2008 | 2009 | ||
|---|---|---|---|---|---|---|---|---|---|---|---|
| Emissions by sector | |||||||||||
| Energy supply | kt | 0.36 | 0.36 | 0.48 | 0.34 | 0.32 | 0.29 | 0.12 | 0.14 | 0.23 | 0.19 |
| Manufacturing Industries and Construction | kt | 0.72 | 1.02 | 1.16 | 1.25 | 1.09 | 1.22 | 0.84 | 1.21 | 1.16 | 0.9 |
| Transport | kt | 1.29 | 1.26 | 1.26 | 1.29 | 1.39 | 1.53 | 1.57 | 1.67 | 1.94 | 1.57 |
| Other | kt | 10.2 | 9.84 | 9.81 | 9.79 | 9.74 | 9.68 | 9.63 | 9.58 | 9.64 | 9.63 |
| Fugitive emissions | kt | 0.02 | 0.02 | 0.02 | 0.02 | 0.02 | 0.02 | 0.02 | 0.02 | 0.02 | 0.02 |
| Industrial Processes | kt | 1.56 | 1.52 | 1 | 1.08 | 0.98 | 0.88 | 1.32 | 1.15 | 0.11 | 0.12 |
| Solvent and other product use | kt | 0 | 0 | 0 | 0 | 0 | 0 | 0 | 0 | 0 | 0 |
| Agriculture | kt | 0.35 | 0.33 | 0.39 | 0.32 | 0.36 | 0.4 | 0.33 | 0.36 | 0.35 | 0.36 |
| Waste | kt | 0 | 0 | 0 | 0 | 0 | 0 | 0 | 0 | 0 | 0 |
| Change in emissions compared to 2000 | |||||||||||
| Energy supply | kt | 0 | 0.12 | -0.02 | -0.04 | -0.07 | -0.24 | -0.22 | -0.13 | -0.17 | |
| Manufacturing Industries and Construction | kt | 0.3 | 0.44 | 0.53 | 0.38 | 0.51 | 0.12 | 0.49 | 0.44 | 0.18 | |
| Transport | kt | -0.03 | -0.03 | 0 | 0.1 | 0.24 | 0.28 | 0.38 | 0.65 | 0.28 | |
| Other | kt | -0.36 | -0.39 | -0.41 | -0.47 | -0.53 | -0.57 | -0.62 | -0.57 | -0.58 | |
| Fugitive emissions | kt | -0 | 0 | 0 | 0 | 0 | 0 | 0 | 0 | -0 | |
| Industrial Processes | kt | -0.04 | -0.56 | -0.48 | -0.58 | -0.68 | -0.23 | -0.41 | -1.45 | -1.44 | |
| Solvent and other product use | kt | 0 | 0 | 0 | 0 | 0 | 0 | 0 | 0 | 0 | |
| Agriculture | kt | -0.02 | 0.04 | -0.03 | 0.01 | 0.05 | -0.02 | 0 | 0 | 0 | |
| Waste | kt | 0 | 0 | 0 | 0 | 0 | 0 | 0 | 0 | 0 |
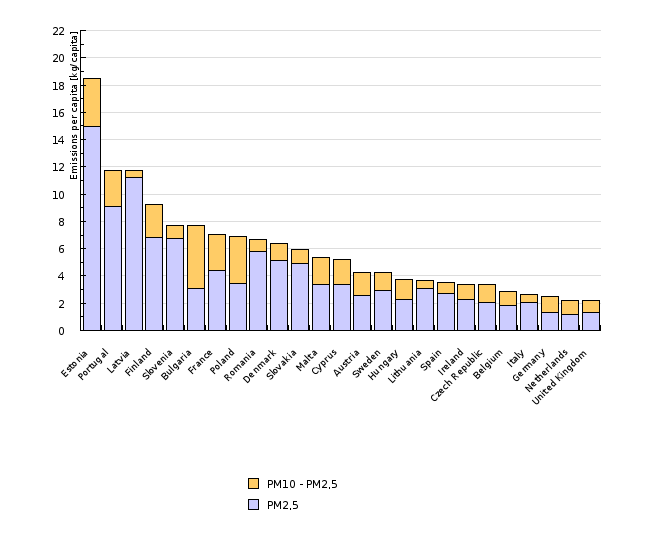
Figure ZR15-6: Izpusti PM10 in PM2.5 na prebivalca za države EU-27 leta 2009
Sources:
National emissions reported to the Convention on Long-range Transboundary Air Pollution, Air pollutant emissions data viewer (LRTAP Convention), Evropska agencija za okolje
| Estonia | Portugal | Latvia | Finland | Slovenia | Bulgaria | France | Poland | Romania | Denmark | ||
|---|---|---|---|---|---|---|---|---|---|---|---|
| PM10 | kt | 24.81 | 124.77 | 26.6 | 49.03 | 15.47 | 58.81 | 452.02 | 263.39 | 144.49 | 35 |
| PM2,5 | kt | 20.02 | 96.69 | 25.47 | 36.03 | 13.59 | 23.58 | 282.31 | 130.69 | 124.68 | 28.29 |
| PM10 - PM2,5 | kt | 4.79 | 28.09 | 1.13 | 13 | 1.89 | 35.23 | 169.71 | 132.7 | 19.81 | 6.71 |
| population by countries | number | 1340935 | 10617575 | 2270894 | 5300484 | 2010269 | 7640238 | 64004333 | 38115641 | 21528627 | 5475791 |
| PM10 | kg/capita | 18.5 | 11.75 | 11.71 | 9.25 | 7.7 | 7.7 | 7.06 | 6.91 | 6.71 | 6.39 |
| PM2,5 | kg/capita | 14.93 | 9.11 | 11.21 | 6.8 | 6.76 | 3.09 | 4.41 | 3.43 | 5.79 | 5.17 |
| PM10 - PM2,5 | kg/capita | 3.57 | 2.64 | 0.5 | 2.45 | 0.94 | 4.61 | 2.65 | 3.48 | 0.92 | 1.22 |
| Slovakia | Malta | Cyprus | Austria | Sweden | Hungary | Lithuania | Spain | Ireland | Czech Republic | ||
| PM10 | kt | 31.92 | 2.2 | 4.09 | 35.56 | 39.23 | 37.78 | 12.26 | 159.61 | 14.93 | 34.93 |
| PM2,5 | kt | 26.73 | 1.38 | 2.69 | 21.09 | 27.23 | 22.69 | 10.3 | 124.67 | 9.88 | 20.94 |
| PM10 - PM2,5 | kt | 5.19 | 0.82 | 1.4 | 14.47 | 12 | 15.09 | 1.95 | 34.94 | 5.05 | 13.99 |
| population by countries | number | 5400998 | 410290 | 789269 | 8318592 | 9182927 | 10045401 | 3366357 | 45283259 | 4401335 | 10381130 |
| PM10 | kg/capita | 5.91 | 5.35 | 5.18 | 4.27 | 4.27 | 3.76 | 3.64 | 3.52 | 3.39 | 3.36 |
| PM2,5 | kg/capita | 4.95 | 3.36 | 3.41 | 2.54 | 2.97 | 2.26 | 3.06 | 2.75 | 2.25 | 2.02 |
| PM10 - PM2,5 | kg/capita | 0.96 | 1.99 | 1.77 | 1.73 | 1.3 | 1.5 | 0.58 | 0.77 | 1.14 | 1.34 |
| Belgium | Italy | Germany | Netherlands | United Kingdom | |||||||
| PM10 | kt | 30.14 | 155.88 | 203.05 | 36.6 | 132.97 | |||||
| PM2,5 | kt | 19.71 | 123.91 | 110.17 | 19.46 | 81.09 | |||||
| PM10 - PM2,5 | kt | 10.44 | 31.97 | 92.87 | 17.14 | 51.88 | |||||
| population by countries | number | 10666866 | 59619290 | 82217837 | 16405399 | 61179256 | |||||
| PM10 | kg/capita | 2.83 | 2.61 | 2.47 | 2.23 | 2.17 | |||||
| PM2,5 | kg/capita | 1.85 | 2.08 | 1.34 | 1.19 | 1.33 | |||||
| PM10 - PM2,5 | kg/capita | 0.98 | 0.53 | 1.13 | 1.04 | 0.84 |


