[EN18] Renewable energy sources

Key message

The share of renewable sources in total energy consumption increased in 2008; however, the set objectives are still far away. The most important renewable energy source is wood biomass, followed by hydropower.
Definition
The indicator shows the consumption from renewable energy sources in Slovenia, incorporating the use of solar energy, biomass (wood, biogas, biofuels) and waste, geothermal energy, hydropower and wind energy.
The indicator can be shown in relative (share of renewable energy sources) or absolute units (use of renewable energy sources). For the indication in absolute units, a thousand tonnes of oil equivalent (ktoe) are used.
Charts
Statistical Office of the RS, 2009; Jožef Stefan Institute, 2009.
| 2000 | 2001 | 2002 | 2003 | 2004 | 2005 | 2006 | 2007 | 2008 | ||
|---|---|---|---|---|---|---|---|---|---|---|
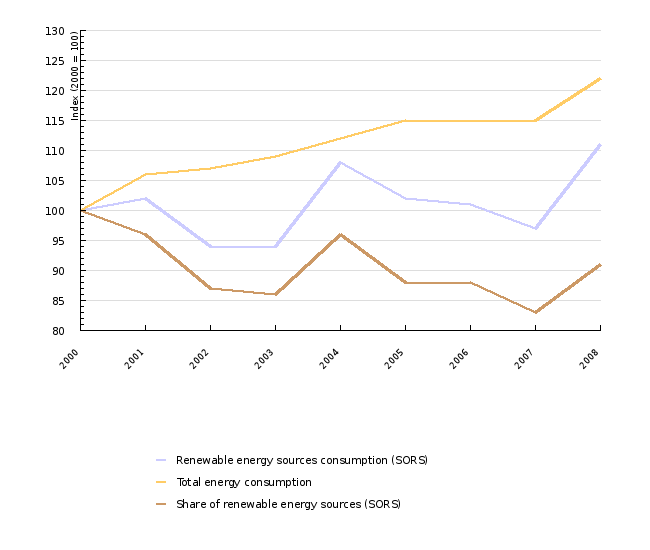
| Renewable energy sources consumption (SORS) | ktoe | 761 | 776 | 716 | 714 | 822 | 774 | 768 | 735 | 845 |
| Total energy consumption | ktoe | 6360 | 6749 | 6820 | 6931 | 7129 | 7307 | 7318 | 7336 | 7749 |
| Share of renewable energy sources (SORS) | % | 12 | 12 | 10 | 10 | 12 | 11 | 11 | 10 | 11 |
| Renewable energy sources consumption (SORS) | Index (2000 = 100) | 100 | 102 | 94 | 94 | 108 | 102 | 101 | 97 | 111 |
| Total energy consumption | Index (2000 = 100) | 100 | 106 | 107 | 109 | 112 | 115 | 115 | 115 | 122 |
| Share of renewable energy sources (SORS) | Index (2000 = 100) | 100 | 96 | 87 | 86 | 96 | 88 | 88 | 83 | 91 |
Statistical Office of the RS, 2009; Jožef Stefan Institute, 2009.
| 1992 | 1993 | 1994 | 1995 | 1996 | 1997 | 1998 | 1999 | - | 2000 | ||
|---|---|---|---|---|---|---|---|---|---|---|---|
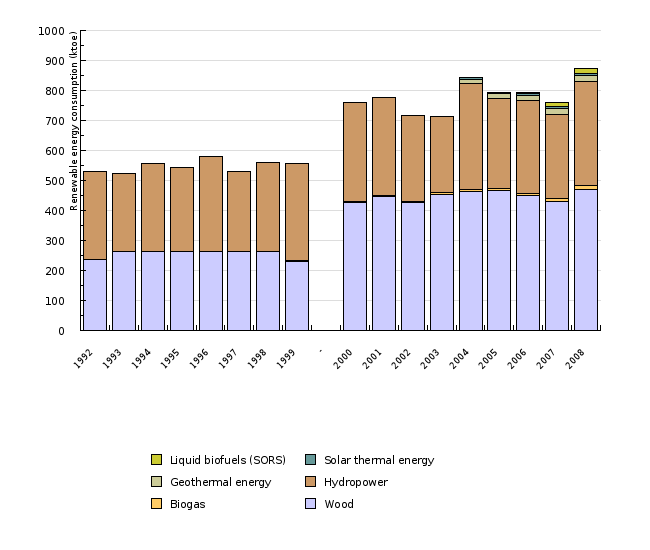
| Wood | ktoe | 236.7 | 264.3 | 263.2 | 262.9 | 262.7 | 262.6 | 262.8 | 230.2 | 427.4 | |
| Biogas | ktoe | 0 | 0 | 0 | 0 | 0 | 0 | 0 | 3.7 | 3.6 | |
| Hydropower | ktoe | 293 | 260 | 292 | 279 | 316 | 266 | 297 | 322 | 330 | |
| Geothermal energy | ktoe | np | np | np | np | np | np | np | np | np | |
| Solar thermal energy | ktoe | np | np | np | np | np | np | np | np | np | |
| Liquid biofuels (MESP) | ktoe | np | np | np | np | np | np | np | np | np | |
| Liquid biofuels (SORS) | ktoe | np | np | np | np | np | np | np | np | np | |
| Total (SORS) | ktoe | 529.7 | 524.3 | 555.2 | 541.9 | 578.7 | 528.6 | 559.8 | 555.9 | 760.7 | |
| Total | ktoe | ||||||||||
| 2001 | 2002 | 2003 | 2004 | 2005 | 2006 | 2007 | 2008 | ||||
| Wood | ktoe | 445.6 | 425.5 | 453.8 | 463.4 | 467.2 | 448.7 | 428.8 | 468.8 | ||
| Biogas | ktoe | 4.3 | 5.1 | 5.8 | 6.6 | 6.8 | 8.4 | 11.9 | 14.1 | ||
| Hydropower | ktoe | 326 | 285 | 254 | 352 | 298 | 308.8 | 280.8 | 345.5 | ||
| Geothermal energy | ktoe | np | np | np | 16 | 16.4 | 17 | 17.9 | 20.8 | ||
| Solar thermal energy | ktoe | np | np | np | 6.1 | 6.4 | 6.8 | 7.5 | 8.3 | ||
| Liquid biofuels (MESP) | ktoe | np | np | np | np | 4.9 | 4.3 | 13.8 | 24.6 | ||
| Liquid biofuels (SORS) | ktoe | np | np | np | np | np | 2 | 13 | 16.3 | ||
| Total (SORS) | ktoe | 775.9 | 715.6 | 713.6 | 822.1 | 773.8 | 767.9 | 734.6 | 844.6 | ||
| Total | ktoe | 844.1 | 801.5 | 794 | 760.9 | 882 |
Jožef Stefan Institute, 2009; Statistical Office of the RS, 2009; Ministry of the Environment and Spatial Planning, 2009.
| 2000 | 2008 - SORS | 2008 - MESP | ||
|---|---|---|---|---|
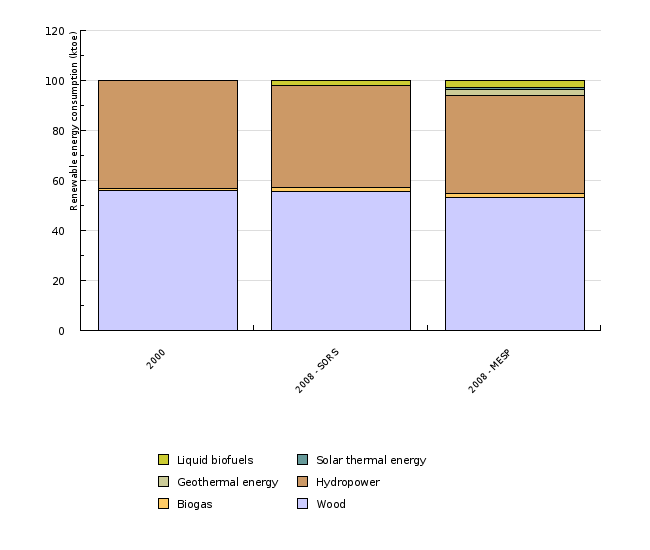
| Wood | ktoe | 427.4 | 468.8 | 468.8 |
| Biogas | ktoe | 3.6 | 14.1 | 14.1 |
| Hydropower | ktoe | 330 | 345.5 | 345.5 |
| Geothermal energy | ktoe | np | 20.8 | |
| Solar thermal energy | ktoe | np | 8.3 | |
| Liquid biofuels | ktoe | np | 16.3 | 24.6 |
| Total | ktoe | 760.7 | 844.6 | 882 |
| Wood | % | 56.2 | 55.5 | 53.2 |
| Biogas | % | 0.5 | 1.7 | 1.6 |
| Hydropower | % | 43.4 | 40.9 | 39.2 |
| Geothermal energy | % | 2.4 | ||
| Solar thermal energy | % | 0.9 | ||
| Liquid biofuels | % | 1.9 | 2.8 | |
| Total | % | 100 | 100 | 100 |
Statistical Office of the RS, 2009.
* Solar energy, geothermal energy and liquid biofuels are not included in the increase of total energy consumption from RES, as there is no data for 2000.
| Wood | Biogas | Hydropower | Geothermal energy | Solar energy | Liquid biofuels | Total (SORS)* | ||
|---|---|---|---|---|---|---|---|---|
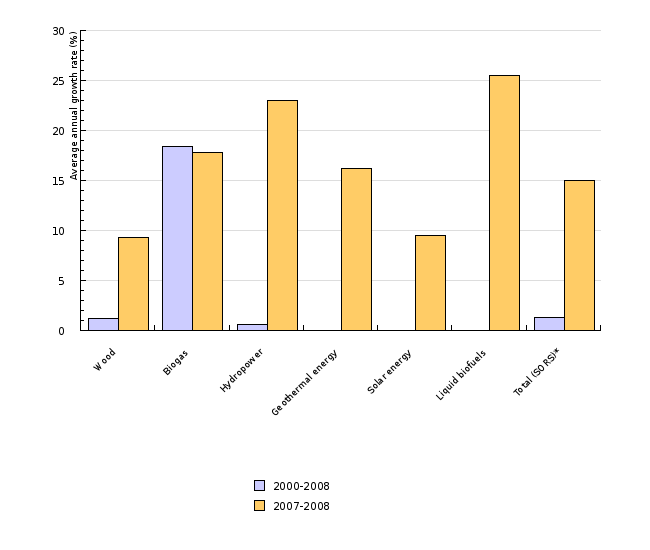
| 2000-2008 | % | 1.2 | 18.4 | 0.6 | 1.3 | |||
| 2007-2008 | % | 9.3 | 17.8 | 23 | 16.2 | 9.5 | 25.5 | 15 |
Eurostat, 2009.
| Wood | Biogas | Municipal waste | Geothermal energy | Hydropower | Wind power | Solar energy | Liquid biofuels | Total | ||
|---|---|---|---|---|---|---|---|---|---|---|
| 2000 | ktoe | 42946 | 2180 | 7293 | 3323 | 27518 | 1912 | 386 | 619 | 86177 |
| 2001 | ktoe | 42250 | 2654 | 7756 | 3526 | 29199 | 2318 | 452 | 727 | 88882 |
| 2002 | ktoe | 42548 | 3339 | 7960 | 3847 | 24144 | 3064 | 502 | 1016 | 86419 |
| 2003 | ktoe | 46790 | 3274 | 8623 | 5198 | 23877 | 3799 | 556 | 1342 | 93459 |
| 2004 | ktoe | 49606 | 3729 | 9238 | 5280 | 24755 | 5038 | 632 | 2073 | 100350 |
| 2005 | ktoe | 50566 | 4266 | 10079 | 5174 | 22850 | 6037 | 761 | 3819 | 103551 |
| 2006 | ktoe | 53230 | 4572 | 10707 | 5420 | 23261 | 7033 | 939 | 6115 | 111276 |
| 2007 | ktoe | 54963 | 5544 | 13129 | 5610 | 23696 | 8873 | 1203 | 9090 | 122109 |
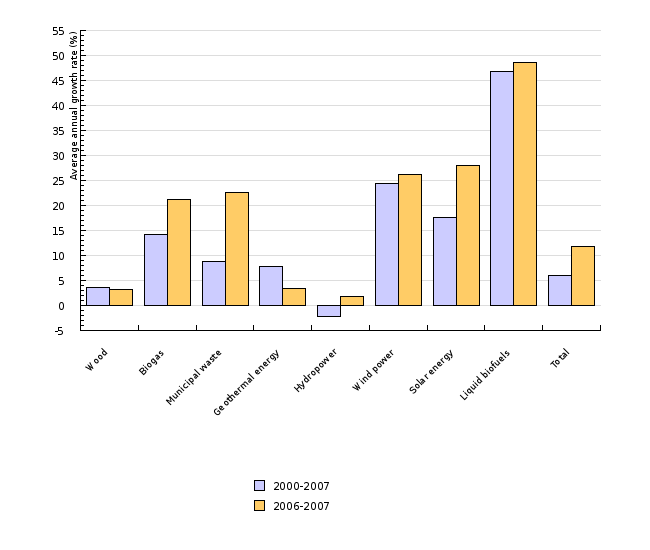
| 2000-2007 | % | 3.6 | 14.3 | 8.8 | 7.8 | -2.1 | 24.5 | 17.6 | 46.8 | 6.1 |
| 2006-2007 | % | 3.3 | 21.3 | 22.6 | 3.5 | 1.9 | 26.2 | 28.1 | 48.7 | 11.8 |
Eurostat, 2009.
| Wood | Biogas | Municipal waste | Geothermal energy | Hydropower | Wind power | Solar energy | Liquid biofuels | Total | ||
|---|---|---|---|---|---|---|---|---|---|---|
| 2000 | ktoe | 6896 | 70 | 148 | 89 | 1356 | 1 | 35 | 0 | 8595 |
| 2001 | ktoe | 7488 | 86 | 193 | 98 | 1415 | 2 | 36 | 41 | 9357 |
| 2002 | ktoe | 8068 | 84 | 160 | 111 | 1407 | 7 | 37 | 3 | 9876 |
| 2003 | ktoe | 9079 | 103 | 163 | 105 | 1055 | 16 | 38 | 38 | 10596 |
| 2004 | ktoe | 9586 | 127 | 168 | 105 | 1380 | 19 | 44 | 50 | 11479 |
| 2005 | ktoe | 9978 | 141 | 214 | 109 | 1434 | 24 | 46 | 72 | 12018 |
| 2006 | ktoe | 10543 | 168 | 270 | 107 | 1365 | 42 | 49 | 187 | 12731 |
| 2007 | ktoe | 10824 | 191 | 286 | 108 | 1336 | 87 | 60 | 316 | 13211 |
| 2000-2007 | % | 6.7 | 15.4 | 9.9 | 2.8 | -0.2 | 89.3 | 8 | 6.7 | |
| 2006-2007 | % | 2.7 | 13.7 | 5.9 | 0.9 | -2.1 | 107.1 | 22.4 | 69 | 4.7 |
Goals
- 12 % share of renewable energy sources in total energy consumption in 2010;
- 20 % share of renewable energy sources in total energy consumption in the EU in 2020;
- 25 % share of renewable energy sources in final energy use in Slovenia in 2020;
- attainment of the target shares for the content of biofuels in motor vehicle fuels: 1.2 % in 2006, 3 % in 2008, 4 % in 2009 and 5 % in 2010;
- 10 % share of biofuels in motor vehicle fuels for 2020.
Comment
Consumption from renewable energy sources has a smaller impact on the environment than the use of fossil fuels or nuclear energy. Therefore, the monitoring of the share of renewable energy sources provides an indication for the trend of total energy consumption – environmentally friendly or not. However, we still have to be aware that there is an impact from renewable energy sources, which depends on the source itself. Namely, the construction of hydroelectric and wind power plants requires a big intervention in space, influences ecosystems and hydrology; furthermore, waste incineration plants are problematic with regard to emissions, while the production of biofuels can be problematic due to the use of pesticides, etc. Therefore, attention should be paid, in the planning process of the use of renewable energy sources, to reducing the negative impact to the minimum level.
Consumption from renewable energy sources in 2008 represented 10.9 % of the total energy consumption, which is 0.9 percentage points more than in 2007. At the same time, this is 1.1 percentage points less than the objective for 2010 set in the Resolution on the National Energy Programme. The statistics on consumption from renewable energy sources before 2000 are based on a different (lower) assessment of the use of wood biomass; therefore, the data for the periods 1992-1999 and after 2000 are not mutually comparable. The low share is, besides the record consumption from RES, a result of the record total energy consumption. The consumption from RES was in 2008, with regard to 2000, higher by 11 %; the total energy consumption was higher by 22 %. In 2000, the share of RES was equal to the target share.
The consumption from RES in 2008 amounted to 845 ktoe, which is 15 % more than the previous year. In the period 2000-2008, the consumption fluctuated a lot, which is primarily a consequence of fluctuations in electricity production in hydroelectric power plants. The most important sources are wood biomass and hydropower.
Wood and other solid biomass represented, with 56 % in 2008, the most important renewable energy source in Slovenia, which is, with regard to the high coverage of Slovenia with forests in 2008, 58.5 % (Slovenian Forest Service, 2009), expected. Biomass includes wood and wood waste, bone flour and fats as well as paper sludge. The majority of wood biomass is used in households (in 2008, 69 %), followed by industry with 16 %. The use of wood biomass in electricity and heat production increased in 2008 by almost 100 %, which is a result of the start-up of the co-incineration plant in Šoštanj thermal power plant (January), Trbovlje thermal power plant and Ljubljana thermal power and heating plant (November). Besides the larger units that represent the majority, wood biomass is used in conversion also in CHP plants in industry and in heating plants. The data on the use of wood biomass in households have remained unchanged since 2002, when the last survey on energy consumption in households was carried out. Due to high prices of heating oil in recent years as well as the promotion of investments, the number of households using wood biomass for fuel has definitely increased. On the other hand, due to the installation of new boilers and higher energy efficiency in buildings, the efficiency of the use of wood biomass has increased as well. In industry, the use of wood biomass has been decreasing since 2005 after years of growth. The main reason is the closure of the cellulose production in the Vipap company. In 2008, the use was 8 % lower than in 2000. The total use of wood biomass in 2008, with 469 ktoe, was 10 % higher than in 2000.
The monitoring of the use of wood biomass is problematic especially in households, since larger amounts of wood are sold in the grey economy or used by the owners of forests (73 % of forests are in private ownership (Slovenian Forest Service, 2008)). The use of wood biomass is with regard to CO2 emissions a renewable energy source, since it is considered as a CO2 neutral fuel. For the emissions of other substances, wood biomass is not an environmentally neutral fuel. The use of wood biomass is especially problematic when used in older boilers with bad incineration conditions, where larger amounts of volatile organic compounds are released, beside particles, which generate ground-level ozone. New boilers run on wood biomass have significantly lower emissions of the indicated compounds. The use of wood biomass will continue to increase in the future, since it represents a domestic energy source that does not contribute to CO2 emissions; furthermore, Slovenia is bound to increase its share of RES. However, this source must be used rationally, since is it also used for other purposes – construction, the furniture industry, etc. The purchase of new modern boilers run on wood biomass is encouraged by the Efficiency Use and Renewable Energy Sources Division at the Ministry of the Environment and Spatial Planning and the Ecological Fund of the Republic of Slovenia. In the process of being adopted is also the Operational programme of energy utilisation of wood biomass for the period 2007-2013, the purpose of which is to increase the energy utilisation of wood biomass. The programme shall define the main barriers for the higher consumption of wood biomass and contains the main mechanisms for the elimination of barriers and attainment of objectives. The implementation of the programme shall contribute to the increase of the use of wood biomass by 3.4 PJ. Wood biomass is at this moment primarily used for heat production.
The second most important renewable energy source in Slovenia is hydropower. Electricity production from hydropower is due to the higher water stage of rivers in 2008 which were 23 % higher than in 2007, and 5 % higher than in 2000. The production capacities in the period 2000-2008 increased by 19 % on account of the restoration of bigger hydroelectric power plants and the construction of the Boštanj hydroelectric power plant, as well as the construction and restoration of smaller hydroelectric power plants. In 2002, the construction of the chain of hydroelectric power plants on the lower Sava commenced. The chain of five hydroelectric power plants is planned to be completed by 2018. The total electricity production shall amount to 720 GWh. In preparation are also other projects for the use of water potential: hydroelectric power plants on the mid-Sava and Mura, etc.
Other renewable sources used in Slovenia include: landfill gas, gas from purification facilities and other biogases (biogas facilities in agriculture) that belong to biogases, geothermal energy, solar energy and biofuels. The use of biogas in the period 2000-2008 increased by 288 % especially on account of the recovery of landfill gas and its energy utilisation (as required in the Decree on the landfill of waste and the former Rules on the landfill of waste) and the exceptional increase of the use of biogas in agriculture, which increased in 2007 by almost 800 %. In 2008, the use of biogas increased by almost 18 %. In 2008, the growth of the use of liquid biofuels in transport continued. The data on the use of liquid biofuels are available from two sources. Besides SORS, these data are collected and published also by the Ministry of the Environment and Spatial Planning, which is in accordance with Directive 2003/30/EC on the promotion of the use of biofuels or other renewable fuels for transport, obliged to report to the European Commission. For 2008, the data of MESP were, by 8.3 ktoe or 51 %, higher. Therefore, big differences in the growth of the use of this fuel appear also in 2008. On the basis of the data of SORS, the growth was 26 %, while on the basis of the data of MESP it was 78 %. Following are the sources, which are not monitored by SORS; in the preparation of the indicator assessments, which were obtained within the framework of the EurObserv project that is implemented in Slovenia by the Centre for Energy Efficiency, Jožef Stefan Institute, were considered. The use of geothermal energy in 2008 was estimated at 20.8 ktoe, which represents more than 2 % of the total energy consumption from renewable energy sources in Slovenia. In recent years a high increase in the use of heat pumps can be observed; however, their statistical consideration is still not defined also at the EU level. Geothermal energy is used for heat production, largely in spas. Solar energy is primarily used for the heating of sanitary water (assessment for 2008, 8.1 ktoe), while electricity production contributed 0.18 ktoe. Solar power stations have been increasing in recent years, which is primarily due to the change of fixed redemption prices of electricity from qualified producers.
Higher consumption from renewable energy sources is promoted by various mechanisms. Investments in new equipment are promoted by the Efficiency Use and Renewable Energy Sources Division with subsidies and by the Ecological Fund of the Republic of Slovenia with favourable loans and subsidies. Higher consumption from renewable energy sources for electricity production is promoted through the system of fixed redemption prices for qualified producers, which was upgraded in 2009. The results are higher incentives for consumption from all RES, with the exception of solar power stations. The use of biofuels is promoted through the exemption of excise duties, while the distributors of liquid motor fuels must achieve objectives as stipulated in the Decree on the promotion of the use of biofuels and other renewable fuels for the propulsion of motor vehicles (OG RS, No. 103/07).
In the EU-27, consumption from renewable energy sources in 2007 represented 7.8 % of the total energy consumption. With regard to 2000, it increased by almost 42 %. Consumption from renewable energy sources in the EU-27 varies in different countries, since it is dependent on natural resources. In the EU-27, the use of wood biomass prevails (49 %), followed by hydropower (19 %), municipal waste (10 %), biofuels (7 %), wind energy (6 %), geothermal energy (4 %), biogas (4 %) and solar energy (1 %).
Methodology
Data for Slovenia and other countries
Objectives summarised by: Resolucija o Nacionalnem energetskem programu (ReNEP) (Resolution on the National Energy Programme, Official Gazette of the RS, No. 57/04), proposal of the climate-energy package, Directive 2009/28/EC on the promotion of the use of energy from renewable sources and Pravilnik o vsebnosti biogoriv v gorivih za pogon motornih vozil (Rules on the content of biofuels in motor vehicle fuels, Official Gazette of the RS, No. 83/05, 108/05, 103/07).
Source database or source:
- Joint questionnaire - EUROSTAT (1992-2002) and EUROSTAT > Environment and energy.
- SI-STAT Data Portal > Environment and natural resources > Renewables and wastes > Renewable energy and waste use, Slovenia, annual (after 2002).
- EurObserv'ER.
Data administrator: Statistical Office of the Republic of Slovenia (Jože Zalar), IJS (geothermal and solar energy – Fouad Al Mansour), MESP (biofuels - Mirko Bizjak) and EUROSTAT.
Date of acquisition for this indicator: 8 December 2009
Methodology and frequency of data collection for the indicator: The data were prepared on an annual basis. The data for the period 1992-2002 were obtained from completed questionnaires that were communicated by SORS to EUROSTAT (Joint Annual Questionnaire).
The data after 2002 were obtained on the SORS website on the SI-STAT Data Portal (Environment and natural resources > Renewables and wastes > Renewable energy and waste use, Slovenia, annual). The Statistical Office of the Republic of Slovenia is monitoring the use of hydropower, biomass (wood, wood waste, other renewable waste), biogas and industrial and municipal waste. For the calculation of the share of RES in total energy consumption, the total energy consumption from the EN16 indicator was used. For the use of solar and geothermal energy, the IJS data were used, and for the use of biofuels, the data of the Ministry of Environment and Spatial Planning.
The data for the EU-25 were obtained on the EUROSTAT website under the column »Environment and energy«. The data for the use of individual renewable sources were used: solar energy 5530 gross inland consumption 100900 + biomass and waste 5540 gross inland consumption 100900 + geothermal energy 5550 gross inland consumption 100900 + hydropower 5510 gross inland consumption 100900 + wind energy 5520 gross inland consumption 100900. For the calculation of the share of RES, sector 100900 »Gross inland consumption« was used as the denominator.
Data processing methodology:
Average annual rate of growth calculated using: [(last year/base year) ^ (1/number of years) –1]*100
The share of renewable energy sources in total energy consumption is calculated as the quotient between the total consumption from renewable energy sources and the total energy consumption in an individual year.
For the calculation of the share of RES in total energy consumption, total energy consumption is the denominator and the total energy consumption from RES is the numerator.
A percentage point is a unit used for the comparison of different rates of growth. A percentage point includes an absolute comparison calculated by the formula (nthis year)-(nlast year)=16 %–15 %=1 pp (for instance: if last year the growth was 15 % and this year 16 %, then this year the growth was higher by 1 percentage point). The difference in growth can also be expressed in a relative comparison using the formula [(nthis year/nlast year)*100]–100=[(16 %/15 %)*100]–100=6.7 %, where the growth is indicated in percentages.
Geographical coverage: The EU-15 is composed of the old EU Member States: Austria, Belgium, Denmark, Finland, France, Germany, Greece, Ireland, Italy, Luxembourg, the Netherlands, Portugal, Spain, Sweden, the United Kingdom. The EU-10 (NMS-10) includes the Member States that joined the EU in 2004 (Cyprus, the Czech Republic, Estonia, Hungary, Lithuania, Latvia, Malta, Poland, Slovenia, Slovakia). The EU-25 includes the EU-15 and EU-10.
Information concerning data quality:
- Advantages and disadvantages of the indicator: /
- Relevance, accuracy, robustness, uncertainty:
Reliability of the indicator (archival data): Data reliability is limited, since the use of wood biomass, which represents the most important renewable energy source, is assessed every five years and does not enable the monitoring of the trends of the use of wood biomass. Moreover, the Statistical Office of the Republic of Slovenia also does not monitor the use of solar energy and geothermal energy. The data for 1992–1999 and after 2000 are not comparable due to different assessments on the use of wood biomass.
Uncertainty of the indicator (scenarios/projections): Scenarios and projections are not available.
- Overall assessment (1 = no major comments, 3 = data to be considered with reservation):
Relevance: 1
Accuracy: 2
Completeness over time: 3
Completeness over space: 1
References:
- EEA, 2007. EN29 Renewable Energy.
- EurObserv'ER, 2007. Barometri za toploto iz sonca, fotovoltaiko in geotermalno energijo (Barometers for heat from sun, photovoltaics and geothermal energy).
- IBE, 2005. Indikativni razvojni načrt energetskega sektorja (Indicative development plan of the energy sector).
- MESP, 2009a. Operativni program zmanjševanja emisij toplogrednih plinov do leta 2012 (Operational programme for limiting greenhouse gas emissions until 2012).
- MESP, 2009b. Raba biogoriv v transportnem sektorju v Republiki Sloveniji v letu 2008 (The use of biofuels in transport sector in the Republic of Slovenia in 2008).
- Nowak, 2009. The EU RES Directive and heat pumps.
- Renewable Energy Road Map: Renewable energies in the 21st century: building a more sustainable future (COM(2006) 848 – final).
- Ljubljana thermal power and heating plant, 2009. Megavat (21 March 2009).
- Šoštanj thermal power plant, 2009. Annual report 2008 – Energy for the future.
- Trbovlje thermal power plant, 2009. Annual report for 2008.
- Slovenian Forest Service, 2009. Poročilo ZGS o gozdovih Slovenije za leto 2008 (Slovenian Forest Service report on Slovenia's forests for 2008).


