[PB03] Greenhouse gas emissions

Key message

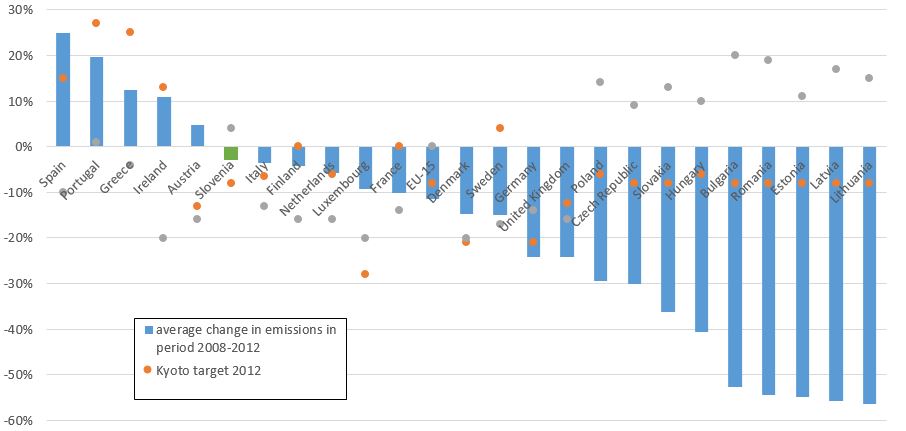
The European Community has fulfilled its obligations from the first period of the Kyoto Protocol, as total GHG emissions in the first commitment period 2008–2012, with no sinks taken into account, were approximately 19% below the base year values. By imposing the maximum level of allowed sinks, Slovenia has exceeded the goal by about 3%.
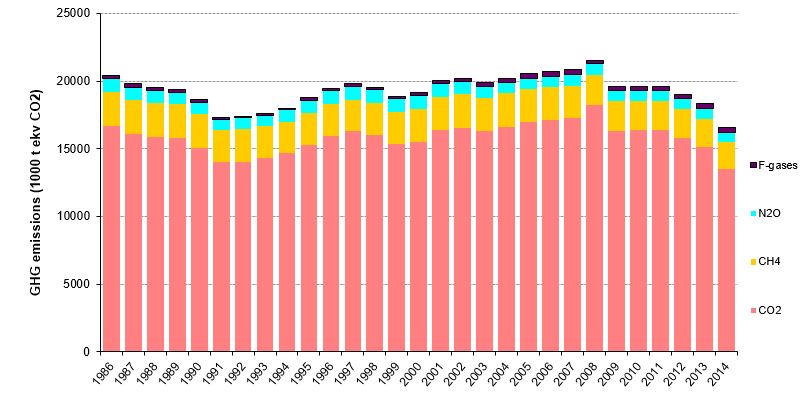
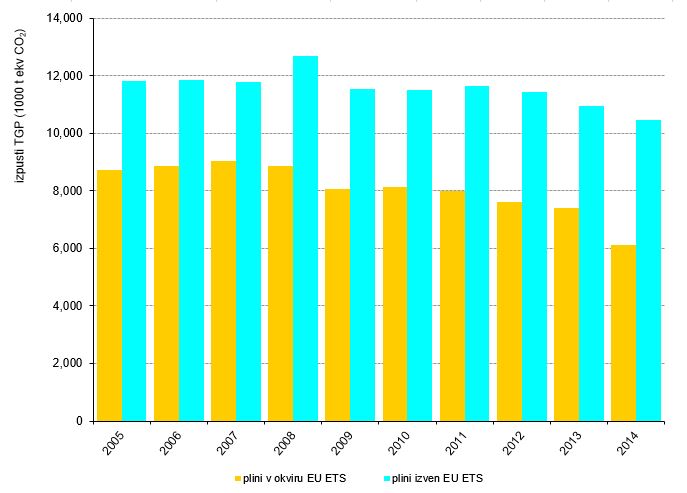
In 2014, Slovenian GHG emissions declined sharply and were 9.5% below the values in 2013. Therefore, Slovenia is on track to achieve the EU goal, as non-ETS GHG emissions in 2014 were about 15.3% below the quantities allocated for that year.
Charts
UNFCCC, The draft 'Annual European Union greenhouse gas inventory 1990-2011; Greenhouse gas database, Slovenian environment agency, 2015
| average change in emissions in period 2008-2012 | Kyoto target 2012 | target 2020 | ||
|---|---|---|---|---|
| Spain | Tg CO2 equiv. | 0 | 0 | -0 |
| Portugal | Tg CO2 equiv. | 0 | 0 | 0 |
| Greece | Tg CO2 equiv. | 0 | 0 | -0 |
| Ireland | Tg CO2 equiv. | 0 | 0 | -0 |
| Austria | Tg CO2 equiv. | 0 | -0 | / |
| Slovenia | Tg CO2 equiv. | -0 | -0 | 0 |
| Italy | Tg CO2 equiv. | -0 | -0 | -0 |
| Finland | Tg CO2 equiv. | -0 | 0 | -0 |
| Netherlands | Tg CO2 equiv. | -0 | -0 | -0 |
| Luxembourg | Tg CO2 equiv. | -0 | -0 | -0 |
| France | Tg CO2 equiv. | -0 | 0 | -0 |
| EU-15 | Tg CO2 equiv. | -0 | -0 | - |
| Denmark | Tg CO2 equiv. | -0 | -0 | -0 |
| Sweden | Tg CO2 equiv. | -0 | 0 | -0 |
| Germany | Tg CO2 equiv. | -0 | -0 | -0 |
| United Kingdom | Tg CO2 equiv. | -0 | -0 | -0 |
| Poland | Tg CO2 equiv. | -0 | -0 | 0 |
| Czech Republic | Tg CO2 equiv. | -0 | -0 | 0 |
| Slovakia | Tg CO2 equiv. | -0 | -0 | 0 |
| Hungary | Tg CO2 equiv. | -0 | -0 | 0 |
| Bulgaria | Tg CO2 equiv. | -1 | -0 | 0 |
| Romania | Tg CO2 equiv. | -1 | -0 | 0 |
| Estonia | Tg CO2 equiv. | -1 | -0 | 0 |
| Latvia | Tg CO2 equiv. | -1 | -0 | 0 |
| Lithuania | Tg CO2 equiv. | -1 | -0 | 0 |
Greenhouse gas database, Slovenian Environment Agency, April 2016.
| 1986 | 1987 | 1988 | 1989 | 1990 | 1991 | 1992 | 1993 | 1994 | 1995 | ||
|---|---|---|---|---|---|---|---|---|---|---|---|
| CO2 | 1000 t CO2 equiv. | 16663 | 16087 | 15860 | 15768 | 15088 | 14007 | 14009 | 14304 | 14649 | 15278 |
| CH4 | 1000 t CO2 equiv. | 2556 | 2533 | 2529 | 2534 | 2471 | 2384 | 2430 | 2354 | 2350 | 2379 |
| N2O | 1000 t CO2 equiv. | 933 | 936 | 896 | 855 | 839 | 781 | 833 | 809 | 866 | 928 |
| F-gases | 1000 t CO2 equiv. | 243 | 278 | 225 | 228 | 218 | 139 | 138 | 139 | 139 | 176 |
| - HFC | 1000 t CO2 equiv. | np | np | np | np | np | np | np | np | np | 36 |
| - PFC | 1000 t CO2 equiv. | 233 | 268 | 215 | 217 | 208 | 129 | 128 | 128 | 128 | 128 |
| - SF6 | 1000 t CO2 equiv. | 10 | 10 | 10 | 11 | 10 | 10 | 10 | 11 | 11 | 12 |
| total | 1000 t CO2 equiv. | 20395 | 19834 | 19510 | 19385 | 18616 | 17312 | 17410 | 17606 | 18004 | 18761 |
| 1996 | 1997 | 1998 | 1999 | 2000 | 2001 | 2002 | 2003 | 2004 | 2005 | ||
| CO2 | 1000 t CO2 equiv. | 15945 | 16276 | 15980 | 15353 | 15460 | 16385 | 16526 | 16289 | 16639 | 16938 |
| CH4 | 1000 t CO2 equiv. | 2338 | 2331 | 2371 | 2373 | 2459 | 2422 | 2516 | 2471 | 2449 | 2438 |
| N2O | 1000 t CO2 equiv. | 981 | 1005 | 991 | 986 | 1012 | 997 | 888 | 853 | 822 | 831 |
| F-gases | 1000 t CO2 equiv. | 175 | 183 | 179 | 180 | 195 | 207 | 230 | 264 | 288 | 316 |
| - HFC | 1000 t CO2 equiv. | 35 | 41 | 38 | 37 | 50 | 62 | 79 | 108 | 130 | 156 |
| - PFC | 1000 t CO2 equiv. | 128 | 128 | 128 | 128 | 130 | 129 | 135 | 139 | 141 | 142 |
| - SF6 | 1000 t CO2 equiv. | 13 | 13 | 13 | 15 | 15 | 15 | 17 | 17 | 17 | 18 |
| total | 1000 t CO2 equiv. | 19440 | 19794 | 19520 | 18893 | 19126 | 20011 | 20160 | 19878 | 20198 | 20523 |
| 2006 | 2007 | 2008 | 2009 | 2010 | 2011 | 2012 | 2013 | 2014 | |||
| CO2 | 1000 t CO2 equiv. | 17130 | 17272 | 18220 | 16328 | 16363 | 16348 | 15800 | 15149 | 13490 | |
| CH4 | 1000 t CO2 equiv. | 2392 | 2392 | 2248 | 2207 | 2188 | 2182 | 2128 | 2080 | 1979 | |
| N2O | 1000 t CO2 equiv. | 837 | 839 | 793 | 789 | 776 | 779 | 781 | 752 | 759 | |
| F-gases | 1000 t CO2 equiv. | 336 | 328 | 263 | 271 | 292 | 317 | 327 | 333 | 355 | |
| - HFC | 1000 t CO2 equiv. | 184 | 211 | 231 | 248 | 264 | 279 | 291 | 302 | 324 | |
| - PFC | 1000 t CO2 equiv. | 134 | 100 | 15 | 5 | 10 | 20 | 18 | 15 | 15 | |
| - SF6 | 1000 t CO2 equiv. | 18 | 18 | 18 | 17 | 18 | 18 | 17 | 16 | 16 | |
| total | 1000 t CO2 equiv. | 20695 | 20832 | 21524 | 19595 | 19619 | 19626 | 19035 | 18314 | 16582 |
Greenhouse gas database, Slovenian Environment Agency, April 2016.
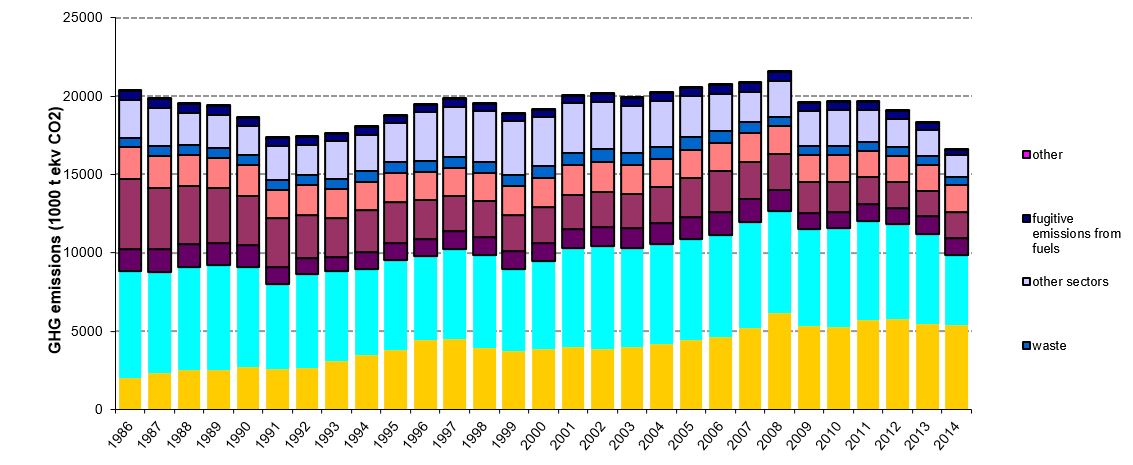
| 1986 | 1987 | 1988 | 1989 | 1990 | 1991 | 1992 | 1993 | 1994 | 1995 | ||
|---|---|---|---|---|---|---|---|---|---|---|---|
| transport | 1000 t CO2 equiv. | 2028 | 2318 | 2497 | 2528 | 2733 | 2580 | 2655 | 3098 | 3449 | 3823 |
| energy industries | 1000 t CO2 equiv. | 6841 | 6479 | 6567 | 6674 | 6375 | 5431 | 5965 | 5754 | 5537 | 5725 |
| industrial processes | 1000 t CO2 equiv. | 1405 | 1419 | 1490 | 1433 | 1390 | 1083 | 1069 | 865 | 1046 | 1086 |
| fuels in manufacturing industries and construction | 1000 t CO2 equiv. | 4458 | 3950 | 3720 | 3488 | 3150 | 3098 | 2695 | 2518 | 2689 | 2633 |
| agriculture | 1000 t CO2 equiv. | 2014 | 2023 | 1985 | 1946 | 1931 | 1815 | 1928 | 1812 | 1827 | 1850 |
| waste | 1000 t CO2 equiv. | 592 | 608 | 623 | 638 | 644 | 648 | 645 | 664 | 672 | 678 |
| other sectors | 1000 t CO2 equiv. | 2424 | 2441 | 2023 | 2073 | 1851 | 2176 | 1930 | 2416 | 2326 | 2478 |
| fugitive emissions from fuels | 1000 t CO2 equiv. | 590 | 564 | 572 | 571 | 509 | 474 | 521 | 478 | 459 | 485 |
| other | 1000 t CO2 equiv. | 41 | 32 | 32 | 32 | 32 | 7 | 1 | 1 | 1 | 1 |
| total | 1000 t CO2 equiv. | 20393 | 19834 | 19509 | 19383 | 18616 | 17312 | 17410 | 17606 | 18004 | 18761 |
| transport | % | 10 | 12 | 13 | 13 | 15 | 15 | 15 | 18 | 19 | 20 |
| energy industries | % | 34 | 33 | 34 | 34 | 34 | 31 | 34 | 33 | 31 | 31 |
| industrial processes | % | 7 | 7 | 8 | 7 | 7 | 6 | 6 | 5 | 6 | 6 |
| fuels in manufacturing industries and construction | % | 22 | 20 | 19 | 18 | 17 | 18 | 15 | 14 | 15 | 14 |
| agriculture | % | 10 | 10 | 10 | 10 | 10 | 10 | 11 | 10 | 10 | 10 |
| waste | % | 3 | 3 | 3 | 3 | 3 | 4 | 4 | 4 | 4 | 4 |
| other sectors | % | 12 | 12 | 10 | 11 | 10 | 13 | 11 | 14 | 13 | 13 |
| fugitive emissions from fuels | % | 3 | 3 | 3 | 3 | 3 | 3 | 3 | 3 | 3 | 3 |
| other | % | 0 | 0 | 0 | 0 | 0 | 0 | 0 | 0 | 0 | 0 |
| total | % | 100 | 100 | 100 | 100 | 100 | 100 | 100 | 100 | 100 | 100 |
| 1996 | 1997 | 1998 | 1999 | 2000 | 2001 | 2002 | 2003 | 2004 | 2005 | ||
| transport | 1000 t CO2 equiv. | 4459 | 4526 | 3901 | 3708 | 3857 | 3980 | 3865 | 4004 | 4153 | 4427 |
| energy industries | 1000 t CO2 equiv. | 5327 | 5749 | 5988 | 5289 | 5594 | 6312 | 6564 | 6289 | 6422 | 6448 |
| industrial processes | 1000 t CO2 equiv. | 1090 | 1127 | 1100 | 1124 | 1168 | 1213 | 1219 | 1301 | 1342 | 1425 |
| fuels in manufacturing industries and construction | 1000 t CO2 equiv. | 2498 | 2236 | 2296 | 2306 | 2276 | 2217 | 2249 | 2166 | 2286 | 2485 |
| agriculture | 1000 t CO2 equiv. | 1800 | 1769 | 1802 | 1812 | 1890 | 1865 | 1926 | 1826 | 1764 | 1782 |
| waste | 1000 t CO2 equiv. | 688 | 704 | 724 | 747 | 767 | 784 | 799 | 807 | 810 | 798 |
| other sectors | 1000 t CO2 equiv. | 3109 | 3180 | 3211 | 3427 | 3100 | 3172 | 3026 | 2946 | 2880 | 2629 |
| fugitive emissions from fuels | 1000 t CO2 equiv. | 468 | 500 | 497 | 476 | 471 | 465 | 508 | 536 | 537 | 524 |
| other | 1000 t CO2 equiv. | 1 | 1 | 3 | 3 | 3 | 3 | 3 | 3 | 3 | 3 |
| total | 1000 t CO2 equiv. | 19440 | 19794 | 19520 | 18893 | 19126 | 20011 | 20160 | 19878 | 20198 | 20523 |
| transport | % | 23 | 23 | 20 | 20 | 20 | 20 | 19 | 20 | 21 | 22 |
| energy industries | % | 27 | 29 | 31 | 28 | 29 | 32 | 33 | 32 | 32 | 31 |
| industrial processes | % | 6 | 6 | 6 | 6 | 6 | 6 | 6 | 7 | 7 | 7 |
| fuels in manufacturing industries and construction | % | 13 | 11 | 12 | 12 | 12 | 11 | 11 | 11 | 11 | 12 |
| agriculture | % | 9 | 9 | 9 | 10 | 10 | 9 | 10 | 9 | 9 | 9 |
| waste | % | 4 | 4 | 4 | 4 | 4 | 4 | 4 | 4 | 4 | 4 |
| other sectors | % | 16 | 16 | 16 | 18 | 16 | 16 | 15 | 15 | 14 | 13 |
| fugitive emissions from fuels | % | 2 | 3 | 3 | 3 | 2 | 2 | 3 | 3 | 3 | 3 |
| other | % | 0 | 0 | 0 | 0 | 0 | 0 | 0 | 0 | 0 | 0 |
| total | % | 100 | 100 | 100 | 100 | 100 | 100 | 100 | 100 | 100 | 100 |
| 2006 | 2007 | 2008 | 2009 | 2010 | 2011 | 2012 | 2013 | 2014 | |||
| transport | 1000 t CO2 equiv. | 4647 | 5228 | 6157 | 5325 | 5265 | 5698 | 5772 | 5459 | 5384 | |
| energy industries | 1000 t CO2 equiv. | 6505 | 6726 | 6499 | 6211 | 6340 | 6359 | 6053 | 5774 | 4448 | |
| industrial processes | 1000 t CO2 equiv. | 1476 | 1490 | 1351 | 1018 | 1018 | 1039 | 1043 | 1096 | 1135 | |
| fuels in manufacturing industries and construction | 1000 t CO2 equiv. | 2588 | 2345 | 2316 | 1955 | 1915 | 1716 | 1649 | 1642 | 1648 | |
| agriculture | 1000 t CO2 equiv. | 1773 | 1828 | 1741 | 1751 | 1715 | 1691 | 1670 | 1653 | 1699 | |
| waste | 1000 t CO2 equiv. | 760 | 711 | 606 | 558 | 554 | 564 | 547 | 528 | 494 | |
| other sectors | 1000 t CO2 equiv. | 2407 | 1959 | 2325 | 2256 | 2289 | 2027 | 1783 | 1702 | 1413 | |
| fugitive emissions from fuels | 1000 t CO2 equiv. | 536 | 543 | 525 | 517 | 520 | 530 | 516 | 457 | 358 | |
| other | 1000 t CO2 equiv. | 3 | 3 | 4 | 3 | 3 | 3 | 3 | 3 | 4 | |
| total | 1000 t CO2 equiv. | 20695 | 20832 | 21524 | 19595 | 19619 | 19626 | 19035 | 18314 | 16582 | |
| transport | % | 22 | 25 | 29 | 27 | 27 | 29 | 30 | 30 | 32 | |
| energy industries | % | 31 | 32 | 30 | 32 | 32 | 32 | 32 | 32 | 27 | |
| industrial processes | % | 7 | 7 | 6 | 5 | 5 | 5 | 5 | 6 | 7 | |
| fuels in manufacturing industries and construction | % | 13 | 11 | 11 | 10 | 10 | 9 | 9 | 9 | 10 | |
| agriculture | % | 9 | 9 | 8 | 9 | 9 | 9 | 9 | 9 | 10 | |
| waste | % | 4 | 3 | 3 | 3 | 3 | 3 | 3 | 3 | 3 | |
| other sectors | % | 12 | 9 | 11 | 12 | 12 | 10 | 9 | 9 | 9 | |
| fugitive emissions from fuels | % | 3 | 3 | 2 | 3 | 3 | 3 | 3 | 2 | 2 | |
| other | % | 0 | 0 | 0 | 0 | 0 | 0 | 0 | 0 | 0 | |
| total | % | 100 | 100 | 100 | 100 | 100 | 100 | 100 | 100 | 100 |
Slovenian Environment agency, Report on GHG emissions, 15.3.2016
Reports on discharge 2013-2014, REK
| 2005 | 2006 | 2007 | 2008 | 2009 | 2010 | 2011 | 2012 | 2013 | 2014 | ||
|---|---|---|---|---|---|---|---|---|---|---|---|
| EU ETS emissions | 1000 t CO2 eq | 8721 | 8842 | 9049 | 8860 | 8067 | 8130 | 7995 | 7611 | 7386 | 6115 |
| non EU ETS emissions | 1000 t CO2 eq | 11802 | 11853 | 11783 | 12663 | 11528 | 11489 | 11632 | 11425 | 10927 | 10467 |
Slovenian environment agency, Report on GHG emissions, 15.3.2016
Reports of discharge 2013-2014, REK
| 2013 | 2014 | 2015 | 2016 | 2017 | 2018 | 2019 | 2020 | ||
|---|---|---|---|---|---|---|---|---|---|
| transport | 1000 t CO2 equiv. | 5459 | 5384 | ||||||
| energy industries | 1000 t CO2 equiv. | 155 | 117 | ||||||
| industrial processes | 1000 t CO2 equiv. | 445 | 453 | ||||||
| fuels in manufacturing industries and construction | 1000 t CO2 equiv. | 605 | 595 | ||||||
| agriculture | 1000 t CO2 equiv. | 1702 | 1413 | ||||||
| waste | 1000 t CO2 equiv. | 1653 | 1699 | ||||||
| other sectors | 1000 t CO2 equiv. | 528 | 494 | ||||||
| other | 1000 t CO2 equiv. | 381 | 312 | ||||||
| total | 1000 t CO2 equiv. | 10927 | 10467 | ||||||
| allocated emissions | 1001 t CO2 equiv. | 12324 | 12354 | 12384 | 12413 | 12443 | 12473 | 12503 | 12533 |


