[EN24] Share of renewables in final energy consumption

Key message

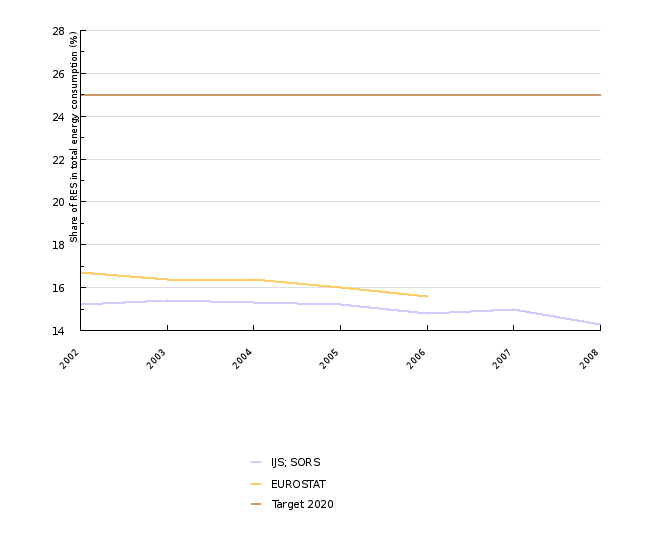
The share of renewable sources in final energy consumption has been decreasing, which is largely a result of the faster growth of final consumption. For the attainment of the 2020 target, the share would have to increase every year by 0.9 percentage points.
Definition
The indicator shows the consumption of renewable energy sources, including energy consumption from the sun, biomass (wood, biogas, biofuels) and waste, geothermal energy, water and wind, in final energy consumption.
The gross final energy consumption represents an energy product supplied for energy purposes in industry, transport, households, the service sector, including the public sector, agriculture, forestry and fishery, including the electricity and heat consumed by an energy sector for the electricity and heat production and losses of electricity and heat in distribution and transfer.
Charts
Jožef Stefan Institute, 2009.
| 2002 | 2003 | 2004 | 2005 | 2006 | 2007 | 2008 | ||
|---|---|---|---|---|---|---|---|---|
| IJS; SORS | ktoe | 15.2 | 15.4 | 15.3 | 15.2 | 14.8 | 15 | 14.3 |
| EUROSTAT | ktoe | 16.7 | 16.4 | 16.4 | 16 | 15.6 | ||
| Target 2020 | ktoe | 25 | 25 | 25 | 25 | 25 | 25 | 25 |
Jožef Stefan Institute, 2009; Statistical office of the RS, 2009.
| 2002 | 2003 | 2004 | 2005 | 2006 | 2007 | 2008 | ||
|---|---|---|---|---|---|---|---|---|
| Gross final energy consumption | index [2002 = 100] | 100 | 103 | 105 | 108 | 109 | 108 | 116 |
| Final consumption of RES | index [2002 = 100] | 100 | 105 | 106 | 107 | 106 | 107 | 109 |
Jožef Stefan Institute, 2009; Statistical office of the RS, 2009.
| 2002 | 2003 | 2004 | 2005 | 2006 | 2007 | 2008 | ||
|---|---|---|---|---|---|---|---|---|
| Share of renewable energy sources in electricity production | % | 28 | 27.7 | 26.8 | 26.3 | 26.4 | 26.5 | 28.8 |
| Share of renewable energy sources in heat and cold production | % | 17.8 | 18.2 | 18.5 | 19 | 18.6 | 20.4 | 19.3 |
| Share of renewable energy sources in transport | % | 0 | 0 | 0 | 0 | 0.1 | 0.7 | 0.8 |
| Share of renewable energy sources in gross final energy consumption | % | 15.2 | 15.4 | 15.3 | 15.2 | 14.8 | 15 | 14.3 |
Goals
- 25 % share of RES in gross final energy consumption in 2020;
- 10 % share of RES in final energy consumption in transport in 2020.
Comment
The share of RES in gross final energy consumption in 2008 amounted to 14.3 %. In comparison with the previous year, it decreased by 0.7 percentage points, and with regard to 2005 by 0.9 %. Slovenia was 10.7 percentage points away from the objective, which means that, in order to achieve the objective, it would have to increase the share in 12 years by 0.9 percentage points every year.
Figure 1 shows the share of RES in gross final energy consumption, calculated from the data of the Statistical Office of the Republic of Slovenia (SORS) and the EUROSTAT data. The difference for 2005 amounts to 0.8 percentage points. The reasons for such a difference are:
• The final energy consumption by EUROSTAT amounts to 4892 ktoe, and by SORS to 4942 ktoe. If we analyse this difference and consider that EUROSTAT does not consider the consumption of diesel fuel of tractors in agriculture and SORS in transport, we can come to the conclusion that the majority of the difference lies in the differences of final consumption of natural gas in industry, which is most likely a result of the use of different calorific values – the EUROSTAT calorific value (net calorific value) and SORS combustion heat (gross calorific value).
• Normalisation factors for electricity production in hydroelectric power plants are different (EUROSTAT 1990–2004, IJS 1996–2007). Since the water stage of rivers is decreasing, the trends in the 15-year period represent a decrease of the normalisation factor.
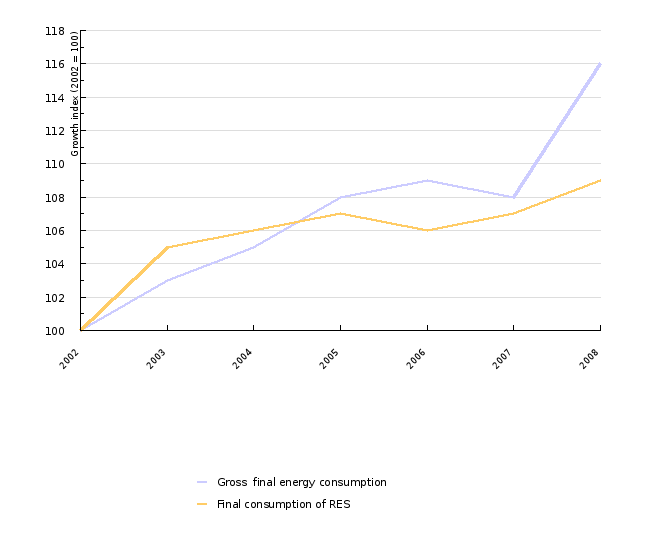
The decrease of the share in 2008 is a consequence of the higher growth of gross final energy consumption in comparison with final consumption from RES (Figure 2). The gross final energy consumption in 2008 increased by more than 7 %, while the final consumption from RES by more than 2 %. In the period 2002–2008, the gross final consumption also increased on average by 2.4 % faster than the final consumption from RES, which increased by 1.5 % annually.
The gross final energy consumption is composed of the final consumption in industry, transport, households and other consumption, which is presented in detail in the indicator EN10 – Final energy consumption by sector and consumption of power plants, consumption in the energy sector and losses in heat and electricity transfer. The final energy consumption contributed 96 % to gross consumption in 2008. In 2008, it amounted to 5549 ktoe.
Gross consumption from RES in 2008 amounted to 796 ktoe. The majority of RES were used for heat and cooling production (52 %), followed by electricity production (46 %) and transport (2 %). In the consumption of RES in electricity production, electricity production in hydroelectric power plants was normalised, which decreased the impact of river stages on the annual fluctuations in an individual year to a minimum. In normalisation, the capacity of hydroelectric power plants in an individual year was multiplied by the average number of operating hours in the 15-year period. This is also the source of the difference in data on gross consumption from RES and consumption from RES in the EN18 indicator – Renewable Energy Sources.
In accordance with Directive 2009/285/EC, Slovenia must, by 30 June 2010, prepare an Action plan for renewable energy to guarantee the attainment of the objective. The plan must define the sectoral objectives for the share of RES in transport (at least 10 %), electricity production, heat and cold production and, naturally, measures for the attainment of such objectives. The preparation of the plan is already in progress, parallel with the preparation of the new National Energy Programme.
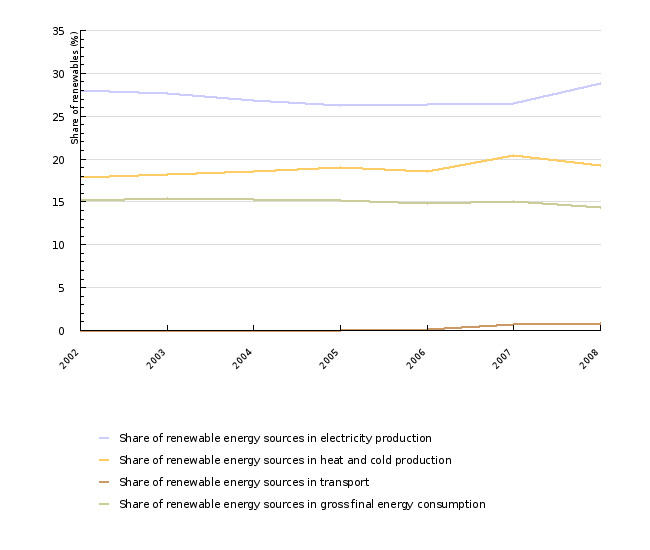
Considering that the action plan will specify sectoral objectives, it is reasonable to analyse the current situation of the share of RES by sectors. The share of RES in heat and cooling production amounted to 19.3 %; in comparison with the previous year, it decreased by 0.9 percentage points. The share of RES in electricity production was 28.8 %; in comparison with the previous year, it increased by 2.3 percentage points. The share of RES in transport amounted to 0.8 %, in comparison with 2007, it increased by 0.1 of a percentage point (Figure 3).
Methodology
Data for Slovenia:
Objectives summarised by: Resolucija o Nacionalnem energetskem programu (ReNEP) (Resolution on the National Energy Programme, Official Gazette of the RS, No. 57/04) and Directive 2009/28/EC on the promotion of the use of energy from renewable sources.
Source database or source: The data after 2002 were obtained from the SORS webpage in the SI-STAT Data Portal (Environment and natural resources > Renewables and wastes > Renewable energy and waste use, Slovenia, annual).
Data administrator: Statistical Office of the Republic of Slovenia (Jože Zalar).
Date of acquisition for this indicator: 5 December 2009.
Methodology and frequency of data collection: The data are prepared on an annual basis. The Statistical Office of the Republic of Slovenia monitors the use of water power, biomass (wood, wood waste, other renewable waste), biogas and industrial as well as municipal waste.
Data processing methodology: The share of renewable sources in final energy consumption is calculated as a quotient of the gross final consumption of renewable energy sources and gross final consumption.
The gross final consumption of renewable energy sources is calculated as the sum of the gross final consumption of electricity from renewable sources, gross final consumption of renewable energy sources for heating and cooling and final consumption of renewable energy sources in transport. The indicator is shown in relative (share of renewable energy sources) units.
The average annual growth is calculated using: [(last year/base year) ^ (1/number of years) –1]*100
For the calculation of the share of RES in total energy consumption, the gross final energy consumption was the denominator (electricity gross production in Slovenia, final energy consumption in transport, industry and other consumption (households, services, the public sector, agriculture) and the consumption of electricity and heat in the energy sector, the consumption by power plants and losses in the transfer of electricity and heat), and the final energy consumption from RES was the numerator (direct consumption from RES in final consumption, electricity gross production from RES – production in hydroelectric power plants was normalised, heat production from RES).
The annual growth for the indicator is sometimes shown in percentage points. A percentage point is a unit used for the comparison of different rates of growth. A percentage point includes an absolute comparison calculated by the formula (nthis year)-(nlast year)=16 %–15 %=1 pp (for instance: if last year the growth was 15 % and this year 16 %, then this year the growth was higher by 1 percentage point). The difference in growth can also be expressed in a relative comparison using the formula [(nthis year/nlast year)*100]–100=[(16 %/15 %)*100]–100=6.7 %, where the growth is indicated in percentages.
Information concerning data quality:
- Advantages and disadvantages of the indicator: The use of wood biomass that represents the most important renewable source is assessed every five years; therefore, it does not provide the possibility of monitoring the trend of the use of wood biomass. Furthermore, SORS also does not monitor the use of solar and geothermal energy. The data until 1999 and afterwards are not comparable due to differences in the assessment of the use of wood biomass.
- Relevance, accuracy, robustness, uncertainty:
Reliability of the indicator (archive data): The reliability of data is limited.
Uncertainty of the indicator (scenarios/projections): Scenarios and projections are not available.
- Overall assessment (1 = no major comments, 2 = data to be considered with reservation):
Relevance: 1
Accuracy: 2
Completeness over time: 1
Completeness over space: 1
References:
- DIRECTIVE 2009/28/EC of the European Parliament and of the Council on the promotion of the use of energy from renewable sources and amending and subsequently repealing Directives 2001/77/EC and 2003/30/EC.
- EUROSTAT, 2009. Energy, transport and environment indicators, 2008 edition.
- Ministry of the Economy, 2008. Letni energetski pregled za leto 2007 (Annual Energy Review for 2007).


