[KM23] Water protection areas and agriculture (latest data available in VD16)

Key message

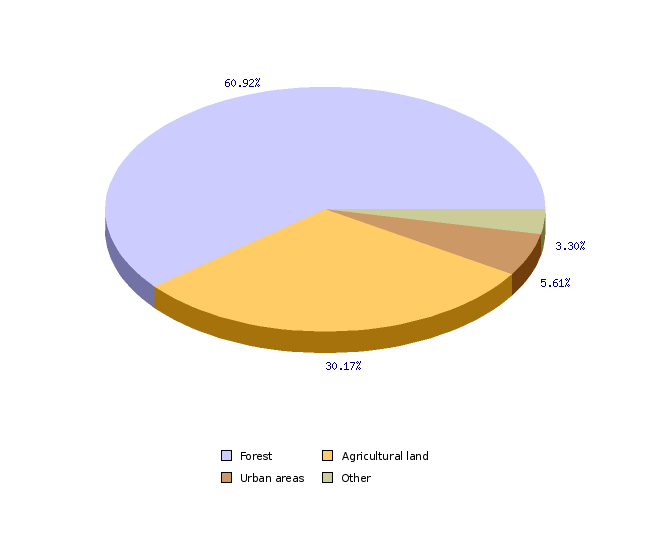
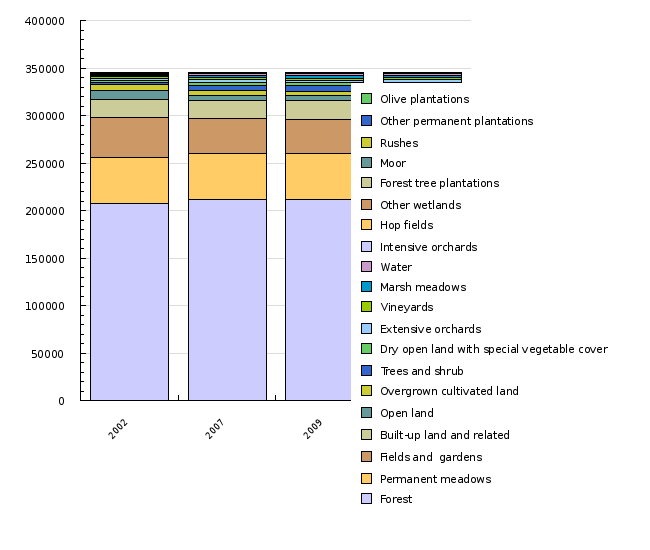
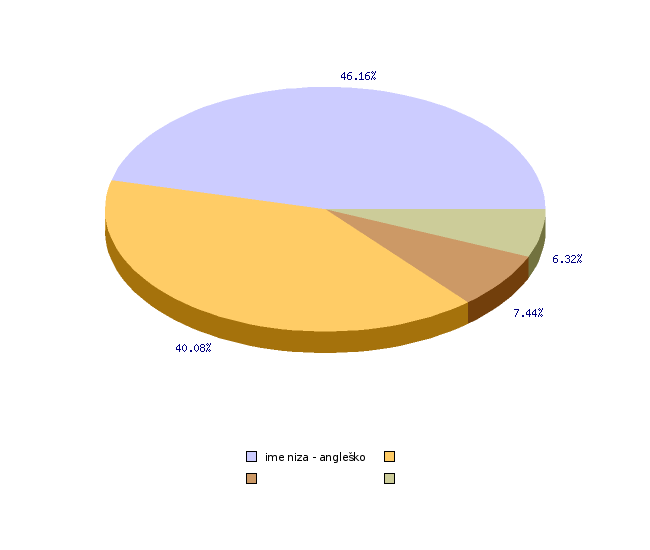
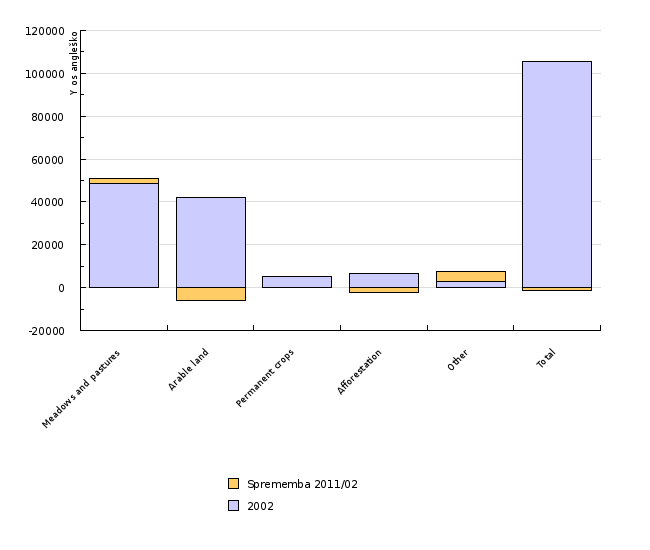
Water protection areas represent 17% of the area in Slovenia. Of this 61% is forest, 30% agricultural land, 6% urban land and 3% other surfaces. From agricultural land on the WPA, 49% is grassland, 36% arable land, and permanent crops, agricultural land in afforestation and other agricultural land by 5% each. In the period 2002-2011 have increased the forest areas (1.3%) and urban land (2.3%), and decreased agricultural land (to 1228 ha, or 1.2%). In the structure of agricultural land have increased over this period the surface of permanent grassland (4.3%) and permanent crops (1.9%), and decreased arable land (14.1%) and agricultural land in afforestation (to 31.3%).
Charts
Ministrstvo za kmetijstvo, gozdarstvo in prehrano, 2011; Agencija Republike Slovenije za okolje, 2011; obdelava Kmetijski inštitut Slovenije, 2011
| Average 2002-2011 | Sprememba 2011/02 (%) | 2002 | 2007 | 2009 | 2011 | ||
|---|---|---|---|---|---|---|---|
| Forest | ha | 210091 | 1 | 207429 | 211616 | 211242 | 210077 |
| Agricultural land | ha | 104061 | -1 | 105495 | 102946 | 103537 | 104267 |
| Urban areas | ha | 19355 | 2 | 19127 | 19466 | 19268 | 19559 |
| Other | ha | 11381 | -14 | 12766 | 10880 | 10867 | 11011 |
| Total | ha | 344888 | 344817 | 344907 | 344914 | 344915 | |
| Forest | % | 61 | 60 | 61 | 61 | 61 | |
| Agricultural land | % | 30 | 31 | 30 | 30 | 30 | |
| Urban areas | % | 6 | 6 | 6 | 6 | 6 | |
| Other | % | 3 | 4 | 3 | 3 | 3 | |
| Total | % | 100 | 100 | 100 | 100 | 100 |
Ministrstvo za kmetijsktvo, gozdarstvo in prehrano, 2011; Agencija RS za okolje, 2011; obdelava Kmetijski inštitut Slovenije, 2011
| 2002 | 2007 | 2009 | 2011 | ||
|---|---|---|---|---|---|
| Forest | ha | 207429.1 | 211615.7 | 211241.7 | 210077.2 |
| Permanent meadows | ha | 48528.8 | 48649.9 | 48687.8 | 48291.9 |
| Fields and gardens | ha | 42277.9 | 36313.5 | 36233.9 | 36306.3 |
| Built-up land and related | ha | 19127.4 | 19465.9 | 19268.3 | 19558.6 |
| Open land | ha | 8608.5 | 5107.5 | 5161.7 | 5184.1 |
| Overgrown cultivated land | ha | 6672.2 | 5306.6 | 4824.4 | 4586.2 |
| Trees and shrub | ha | 2535.1 | 4992.1 | 5935.4 | 7309.2 |
| Dry open land with special vegetable cover | ha | 1959.1 | 3779.5 | 3723.3 | 3806.5 |
| Extensive orchards | ha | 1979.3 | 2189 | 2232.2 | 2414.3 |
| Vineyards | ha | 2331.1 | 2171.1 | 2162.2 | 2030.8 |
| Marsh meadows | ha | 164.1 | 2492.8 | 2609.8 | 2502.2 |
| Water | ha | 2017.4 | 1820.2 | 1823.7 | 1864.1 |
| Intensive orchards | ha | 613.3 | 502.3 | 533.8 | 519.4 |
| Hop fields | ha | 212 | 253.1 | 252.3 | 228.8 |
| Other wetlands | ha | 67.4 | 137.2 | 125.9 | 130.1 |
| Forest tree plantations | ha | 165.8 | 38.8 | 26.2 | 24.9 |
| Moor | ha | 59.6 | 18.6 | 15.5 | 15.5 |
| Rushes | ha | 53.4 | 16.8 | 16.8 | 11.1 |
| Other permanent plantations | ha | 6.5 | 24.7 | 27.6 | 36.2 |
| Olive plantations | ha | 8.9 | 11.7 | 11.9 | 17.3 |
| Total | ha | 344817.2 | 344907.1 | 344914.4 | 344914.7 |
| % of water protection areas | % | 17 | 17 | 17 | 17 |
Ministrstvo za kmetijstvo, gozdarstvo in prehrano, 2011; Agencija Republike Slovenije za okolje, 2011; obdelava Kmetijski inštitut Slovenije, 2011
| 2002 | 2007 | 2009 | 2011 | ||
|---|---|---|---|---|---|
| ime niza - angleško | ha | 48693 | 51142.7 | 51297.6 | 50794.1 |
| ha | 42277.9 | 36313.5 | 36233.9 | 36306.3 | |
| ha | 7852.1 | 10182.8 | 11181.5 | 12580.9 | |
| ha | 6672.2 | 5306.6 | 4824.4 | 4586.2 | |
| ha | 105495.1 | 102945.7 | 103537.4 | 104267.4 |
Ministrstvo za kmetijstvo, gozdarstvo in prehrano, 2011; Agencija Republike Slovenije za okolje, 2011; obdelava Kmetijski inštitut Slovenije, 2011
| Meadows and pastures | Arable land | Permanent crops | Afforestation | Other | Total | ||
|---|---|---|---|---|---|---|---|
| 2002 | ha | 48693 | 42277.9 | 5151.2 | 6672.2 | 2700.9 | 105495.1 |
| Sprememba 2011/02 | ha | 2101.1 | -5971.6 | 95.6 | -2086 | 4633.2 | -1227.7 |
Kmetijski inštitut Slovenije, 2011


