[EN20] Energy prices
[EN20] Energy prices

Key message

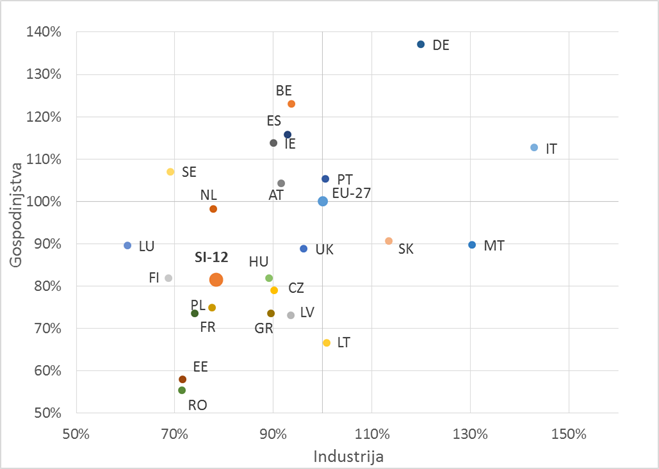
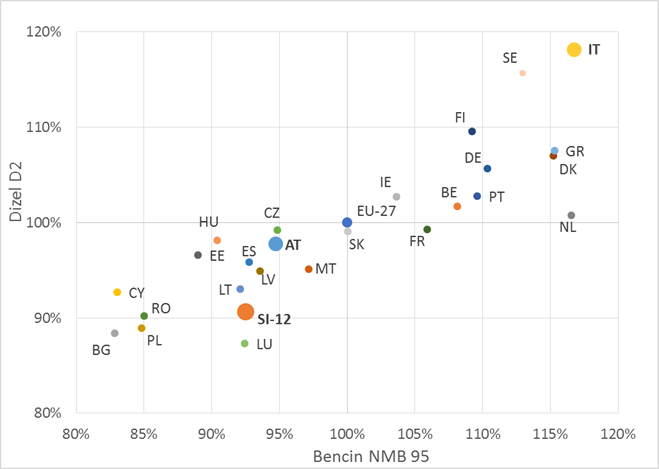
Energy prices increased in the period 2008-2012. In the same period, the most raised the price of the natural gas industry (almost 53 %), followed by price for natural gases for households by 38%, the price of heating oil, for household electricity, the price of petrol NMB 95, diesel D2, at least has raised the price of electricity for industry, for less than 6%.
Definition
Charts
Figure EN20-1: Real growth in electricity prices for industry and households (expressed in EUR 1995) for the periods of 1995-2007 and 2008-2012
Sources:
Statistical Office of the Republic of Slovenia, 2013
| electricity - households | electricity - industry | Diesel D2 - transport | fuel oil - heating | natural gas - industry | Petrol NMB 95 - transport | natural gas - households | ||
|---|---|---|---|---|---|---|---|---|
| 1995-2007 | % | 11.3 | 5.1 | 73.4 | 96.9 | 60.4 | 70.1 | 88.9 |
| 2008-2013 | % | 33.4 | 7.1 | 25.7 | 36.3 | 28.8 | 34.7 | 13.8 |
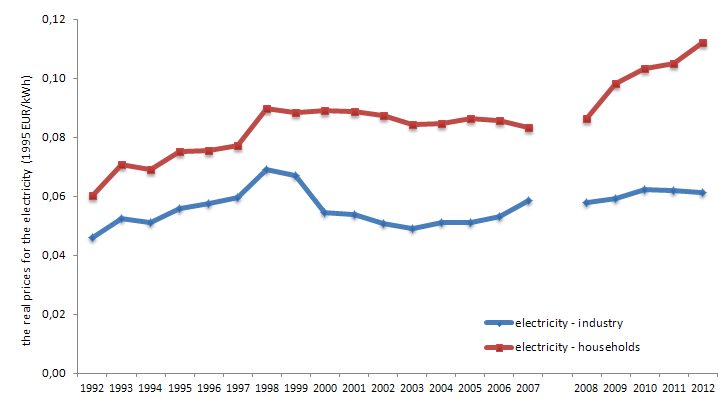
Figure EN20-2: The real price of electricity in industry and households (expressed in EUR 1995) for the period 1992-2012
Sources:
Statistical Office of the Republic of Slovenia, 2013
| 1992 | 1993 | 1994 | 1995 | 1996 | 1997 | 1998 | 1999 | 2000 | 2001 | ||
|---|---|---|---|---|---|---|---|---|---|---|---|
| electricity - industry | EUR/kWh | 0.046 | 0.052 | 0.051 | 0.056 | 0.058 | 0.06 | 0.069 | 0.067 | 0.054 | 0.054 |
| electricity - households | EUR/kWh | 0.06 | 0.071 | 0.069 | 0.075 | 0.076 | 0.077 | 0.09 | 0.088 | 0.089 | 0.089 |
| 2002 | 2003 | 2004 | 2005 | 2006 | 2007 | - | 2008 | 2009 | 2010 | ||
| electricity - industry | EUR/kWh | 0.051 | 0.049 | 0.051 | 0.051 | 0.053 | 0.059 | 0.058 | 0.059 | 0.062 | |
| electricity - households | EUR/kWh | 0.087 | 0.084 | 0.085 | 0.086 | 0.086 | 0.083 | 0.086 | 0.098 | 0.103 | |
| 2011 | 2012 | 2013 | |||||||||
| electricity - industry | EUR/kWh | 0.062 | 0.061 | 0.062 | |||||||
| electricity - households | EUR/kWh | 0.105 | 0.112 | 0.115 |
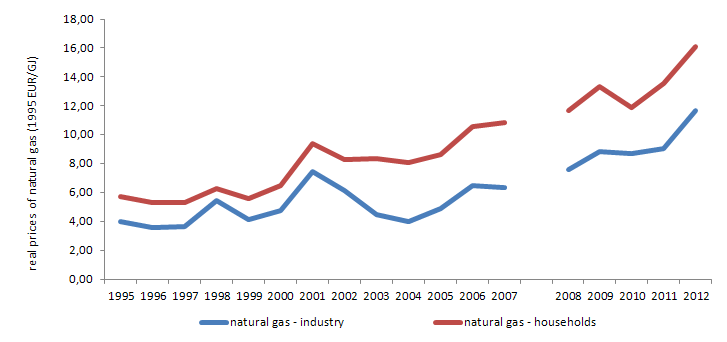
Figure EN20-3: The real price of natural gas in industry and households (expressed in EUR 1995) in the period from 1995 to 2012
Sources:
Statistical Office of the Republic of Slovenia, 2013
| 1995 | 1996 | 1997 | 1998 | 1999 | 2000 | 2001 | 2002 | 2003 | 2004 | ||
|---|---|---|---|---|---|---|---|---|---|---|---|
| natural gas - industry | EUR/GJ | 3.971 | 3.576 | 3.652 | 5.47 | 4.17 | 4.779 | 7.444 | 6.167 | 4.455 | 4.034 |
| natural gas - households | EUR/GJ | 5.754 | 5.338 | 5.335 | 6.299 | 5.598 | 6.479 | 9.403 | 8.312 | 8.325 | 8.097 |
| 2005 | 2006 | 2007 | - | 2008 | 2009 | 2010 | 2011 | 2012 | 2013 | ||
| natural gas - industry | EUR/GJ | 4.921 | 6.503 | 6.371 | 7.593 | 8.808 | 8.66 | 9.014 | 11.602 | 9.782 | |
| natural gas - households | EUR/GJ | 8.632 | 10.606 | 10.868 | 11.641 | 13.275 | 11.875 | 13.467 | 16.032 | 13.249 |
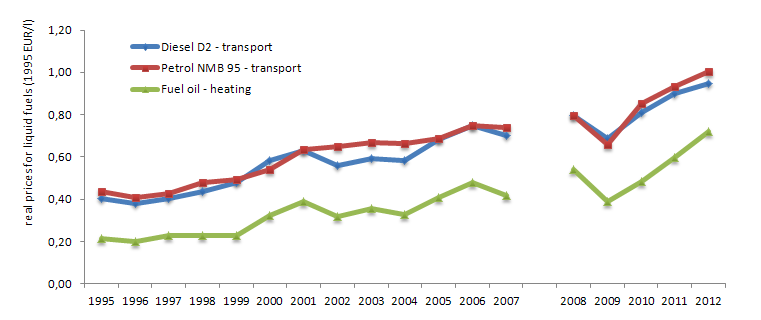
Figure EN20-4: The real price of liquid fuels (expressed in euro 1995) in the period from 1995 to 2012
Sources:
Statistical Office of the Republic of Slovenia, 2013
| 1995 | 1996 | 1997 | 1998 | 1999 | 2000 | 2001 | 2002 | 2003 | 2004 | ||
|---|---|---|---|---|---|---|---|---|---|---|---|
| Diesel D2 - transport | EUR/l | 0.404 | 0.381 | 0.405 | 0.436 | 0.477 | 0.58 | 0.632 | 0.559 | 0.591 | 0.581 |
| Petrol NMB 95 - transport | EUR/l | 0.434 | 0.409 | 0.424 | 0.477 | 0.491 | 0.54 | 0.634 | 0.649 | 0.67 | 0.662 |
| Fuel oil - heating | EUR/l | 0.212 | 0.2 | 0.226 | 0.23 | 0.23 | 0.323 | 0.39 | 0.316 | 0.355 | 0.329 |
| 2005 | 2006 | 2007 | 2008 | 2009 | 2010 | 2011 | 2012 | 2013 | |||
| Diesel D2 - transport | EUR/l | 0.682 | 0.747 | 0.7 | 0.792 | 0.685 | 0.805 | 0.898 | 0.944 | 0.995 | |
| Petrol NMB 95 - transport | EUR/l | 0.685 | 0.75 | 0.737 | 0.795 | 0.658 | 0.85 | 0.928 | 0.998 | 1.071 | |
| Fuel oil - heating | EUR/l | 0.407 | 0.477 | 0.417 | 0.54 | 0.385 | 0.481 | 0.596 | 0.715 | 0.737 |
Figure EN20-5: Growth in real prices of electricity, natural gas and petroleum products and the growth of the individual components of the final price
Sources:
Statistical Office of the Republic of Slovenia, 2013
| 1995-2007 | 1995-2000 | 2008-2013 | ||
|---|---|---|---|---|
| Electricity: households - retail price | % | 0.9 | 3.5 | 5.9 |
| Electricity: households - price before taxes | % | 0.2 | 1.9 | 4.2 |
| Electricity: households - taxes (with VAT) | % | 6.1 | 15.9 | 11.8 |
| Natural gas: households: retail price | % | 5.4 | 2.4 | 2.6 |
| Natural gas: households: price before taxes | % | 3.7 | -1.9 | 2.1 |
| Natural gas: households: taxes (with VAT) | % | 19.9 | 40.7 | 4.5 |
| Diesel D2: transport - retail price | % | 4.7 | 7.5 | 4.7 |
| Diesel D2: transport - price before taxes | % | 4.5 | 3.5 | 3.1 |
| Diesel D2: transport - taxes (with VAT) | % | 4.9 | 10.8 | 7.6 |
| Petrol NMB 95: transport - retail price | % | 4.5 | 4.5 | 6.1 |
| Petrol NMB 95: transport - price before taxes | % | 2.7 | -1.5 | 4 |
| Petrol NMB 95: transport - taxes (with VAT) | % | 6.1 | 9.4 | 8.1 |
| Fuel oil EL - retail price | % | 5.8 | 8.8 | 6.4 |
| Fuel oil EL - price before taxes | % | 4.2 | 2.7 | 4.6 |
| Fuel oil EL - taxes (with VAT) | % | 13.2 | 34.2 | 11.5 |
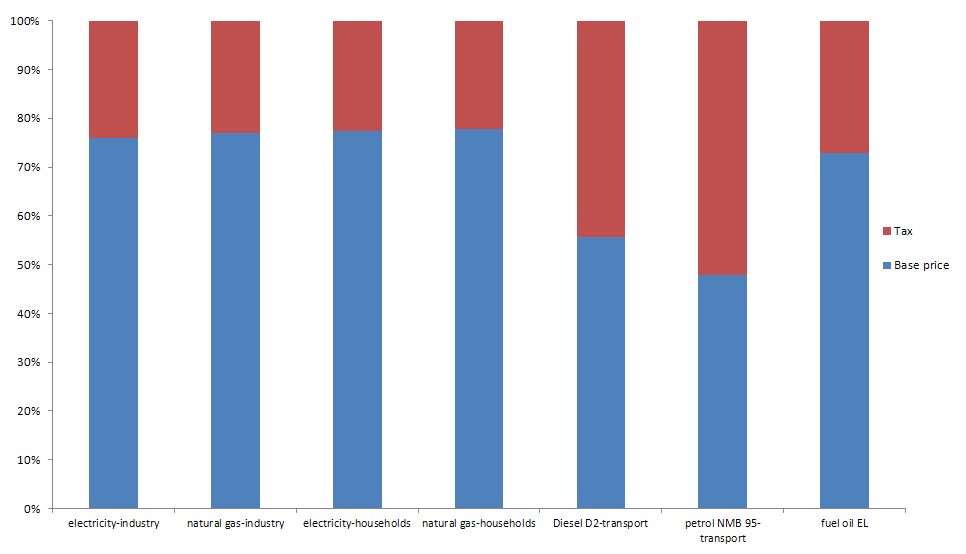
Figure EN20-6: The share of taxes and base price in the retail price of each fuel in 2012
Sources:
Statistical Office of the Republic of Slovenia, 2013
| Retail price | Taxes | ||
|---|---|---|---|
| Electricity: industry | % | 0.7 | 0.3 |
| Natural gas: industry | % | 0.8 | 0.2 |
| Electricity: households | % | 0.7 | 0.3 |
| Natural gas: households | % | 0.8 | 0.2 |
| Diesel D2: transport | % | 0.5 | 0.5 |
| Petrol NMB 95: transport | % | 0.4 | 0.6 |
| Fuel oil EL | % | 0.7 | 0.3 |
Figure EN20-7: Price comparison of electricity in Slovenia with prices in the EU-27 for 2012
Sources:
Eurostat, 2013
| EU-28 | BE | BG | CZ | DK | DE | EE | IE | EL | ES | ||
|---|---|---|---|---|---|---|---|---|---|---|---|
| industry | % | 100 | 90.075 | 59.211 | 81.441 | 167.437 | 129.3 | 79.13 | 104.759 | 95.173 | 98.844 |
| households | % | 100 | 110.254 | 43.902 | 74.316 | 146.142 | 145.396 | 68.044 | 119.711 | 84.47 | 113.141 |
| FR | HR | IT | CY | LV | LT | LU | HU | MT | NL | ||
| industry | % | 69.273 | 80.218 | 135.622 | 160.911 | 94.765 | 100.952 | 72.264 | 83.549 | 132.903 | 77.362 |
| households | % | 79.094 | 67.198 | 115.63 | 123.494 | 67.596 | 69.238 | 81.931 | 66.003 | 84.619 | 95.321 |
| AT | PL | PT | RO | SI-13 | SK | FI | SE | UK | |||
| industry | % | 90.211 | 73.351 | 94.969 | 80.557 | 78.382 | 103.535 | 63.154 | 63.494 | 97.621 | |
| households | % | 100.448 | 71.528 | 106.073 | 63.664 | 82.479 | 83.524 | 77.601 | 101.842 | 89.447 |
Figure EN20-8: Comparison of Slovenian prices of natural gases with prices in the EU-27 for 2012
Sources:
Eurostat, 2013
| EU-28 | BE | BG | CZ | DK | DE | EE | IE | EL | ES | ||
|---|---|---|---|---|---|---|---|---|---|---|---|
| industry | % | 100 | 86.228 | 87.755 | 83.436 | 177.807 | 118.413 | 88.024 | 109.281 | 118.338 | 94.835 |
| households | % | 100 | 84.611 | 163.462 | 118.558 | 100.123 | 93.799 | 92.933 | 94.992 | 143.492 | 138.049 |
| FR | CY | LV | LT | LU | HU | NL | AT | PL | PT | ||
| industry | % | 95.135 | 110.389 | 93.23 | 102.733 | 99.251 | 126.249 | 90.644 | 106.886 | 93.215 | 107.335 |
| households | % | 91.44 | 101.299 | 73.308 | 140.799 | 66.481 | 104.67 | 109.654 | 97.645 | 123.553 | 162.477 |
| RO | SI-11 | SK | SE | UK | IT | ||||||
| industry | % | 74.315 | 121.707 | 96.482 | 196.826 | 89.365 | 87.5 | ||||
| households | % | 87.875 | 124.64 | 107.903 | 133.174 | 81.089 | 133.459 |
Figure EN20-9: Comparison of Slovenian prices for petroleum products with prices in the EU-27 for 2012
Sources:
Eurostat, 2013; Oil Bulletin, 2013
| AT | BE | BG | HR | CY | CZ | DE | DK | EE | ES | ||
|---|---|---|---|---|---|---|---|---|---|---|---|
| NMB | % | 90.432 | 99.882 | 82.115 | 91.041 | 91.989 | 89.53 | 101.874 | 108.159 | 83.471 | 91.568 |
| D2 | % | 89.799 | 92.986 | 86.902 | 89.969 | 97.165 | 92.459 | 93.064 | 98.707 | 87.314 | 89.633 |
| FI | FR | EL | HU | IE | IT | LT | LU | LV | MT | ||
| NMB | % | 104.7 | 98.497 | 109.112 | 87.51 | 101.254 | 113.581 | 87.35 | 85.019 | 83.574 | 99.255 |
| D2 | % | 102.434 | 88.464 | 92.567 | 93.823 | 98.601 | 110.104 | 85.663 | 80.113 | 85.273 | 96.542 |
| NL | PL | PT | RO | SE | SI-10 | SK | UK | EU-28 | |||
| NMB | % | 112.765 | 82.028 | 100.358 | 89.659 | 101.129 | 98.635 | 97.118 | 105.691 | 100 | |
| D2 | % | 97.11 | 83.218 | 88.592 | 94.965 | 104.059 | 95.903 | 91.644 | 113.122 | 100 |


