[ZR08] Air pollution with particulate matter

Definition
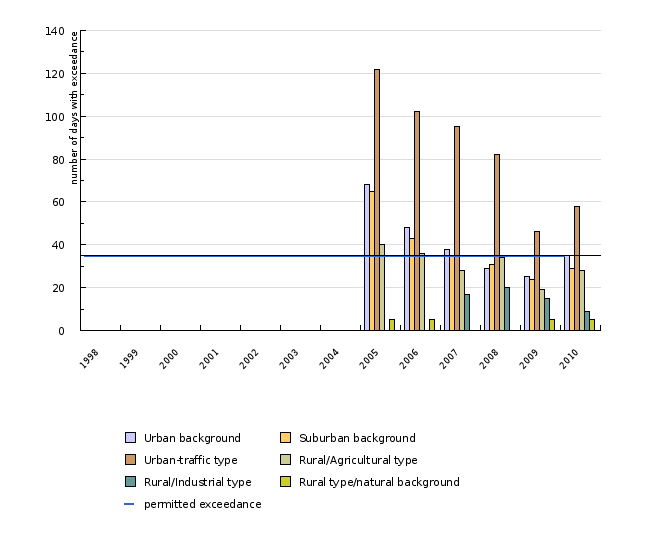
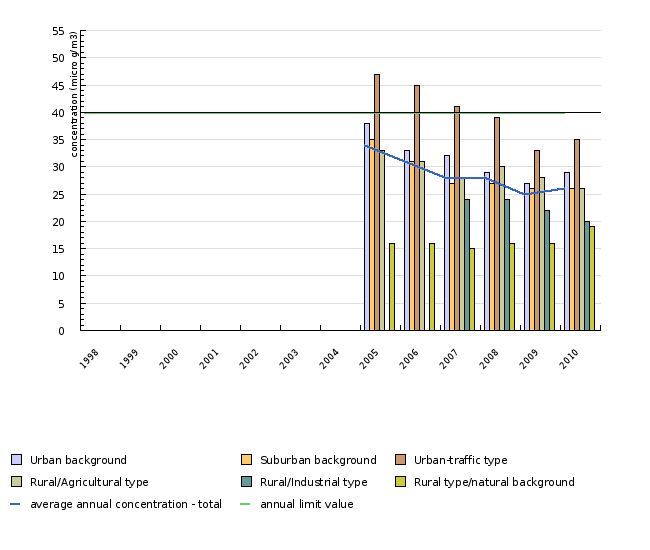
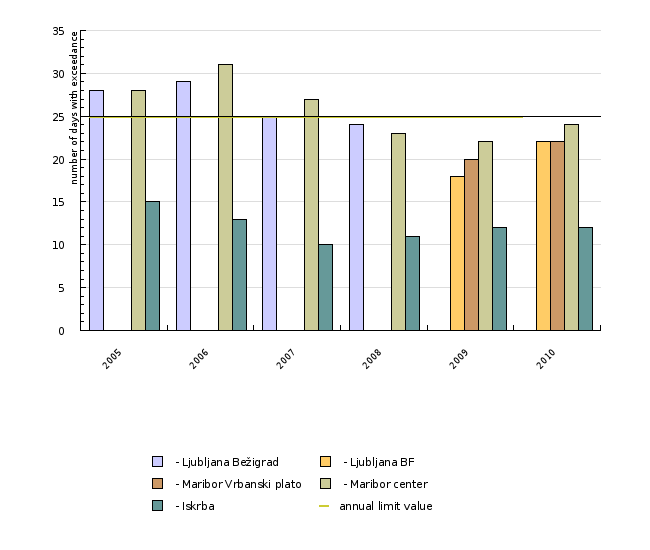
The indicator shows the number of days per year when the 24-hour limit concentration 50 µg/m3 and the annual limit value 40 µg/m3 were exceeded in the selected Slovenian urban areas that are most affected by pollution.
“Particulate matter” means a combination of finely divided solid or liquid particles suspended in the air, of various physical and chemical compositions.
A portion of airborne particles is formed as a consequence of direct emissions (primary particles), others are formed as products of various processes in the atmosphere (secondary particles).
Particle size distribution is usually described in terms of trimodal size distribution. Particles ranging between 0.01 and 0.1 µm belong in the so-called nucleation area, particles ranging between 0.1 and 1 µm belong in the accumulation area, and particles larger than 1 µm are known as coarse particles.
Charts
National authomatic measurement air quality network database, Environmental Agency of the Republic of Slovenia, 2008
| 1998 | 1999 | 2000 | 2001 | 2002 | 2003 | 2004 | 2005 | 2006 | 2007 | ||
|---|---|---|---|---|---|---|---|---|---|---|---|
| Urban background | number of days | 68 | 48 | 38 | |||||||
| - Ljubljana Bežigrad | number of days | np | np | np | np | 36 | 64 | 71 | 70 | 47 | 46 |
| - Ljubljana BF* | number of days | np | np | np | np | np | np | np | np | np | np |
| - Celje | number of days | np | 43 | 34 | 41 | 58 | 100 | 62 | 97 | 59 | 48 |
| - Koper | number of days | np | np | np | np | np | np | np | np | 40 | 19 |
| - Nova Gorica | number of days | np | np | np | np | 24 | 18 | 33 | 37 | 47 | 40 |
| Suburban background | number of days | 65 | 43 | 35 | |||||||
| - Trbovlje* | number of days | 58 | 80 | 77 | 40 | 52 | 88 | 48 | 157 | 86 | 81 |
| - Pesje | number of days | np | np | np | np | np | 17 | 11 | 23 | 24 | 14 |
| - Škale | number of days | np | np | np | np | np | 4 | 8 | 15 | 19 | 11 |
| Urban-traffic type | number of days | 122 | 102 | 95 | |||||||
| - Maribor center* | number of days | np | np | np | np | 66 | 129 | 102 | 101 | 108 | 91 |
| - Zagorje* | number of days | np | np | np | np | 48 | 79 | 82 | 143 | 106 | 99 |
| Rural/Agricultural type | number of days | 40 | 36 | 28 | |||||||
| - Vnajnarje* | number of days | np | np | np | np | np | np | np | np | 20 | 10 |
| - Prapretno | number of days | np | np | np | np | np | np | 19 | 15 | 33 | 36 |
| - Murska Sobota - Rakičan | number of days | np | np | np | np | 33 | 58 | 19 | 65 | 54 | 37 |
| Rural/Industrial type | number of days | 17 | |||||||||
| - Morsko* | number of days | np | np | np | np | np | np | np | np | np | 18 |
| - Gorenje Polje* | number of days | np | np | np | np | np | np | np | np | np | 16 |
| Rural type/natural background | number of days | 5 | 5 | 0 | |||||||
| - Iskrba* | number of days | np | np | np | np | np | np | np | 5 | 5 | 0 |
| 2008 | 2009 | 2010 | |||||||||
| Urban background | number of days | 29 | 25 | 35 | |||||||
| - Ljubljana Bežigrad | number of days | 36 | 30 | 43 | |||||||
| - Ljubljana BF* | number of days | np | 25 | 32 | |||||||
| - Celje | number of days | 37 | 42 | 58 | |||||||
| - Koper | number of days | 11 | 2 | 15 | |||||||
| - Nova Gorica | number of days | 33 | 24 | 25 | |||||||
| Suburban background | number of days | 31 | 24 | 29 | |||||||
| - Trbovlje* | number of days | 72 | 48 | 64 | |||||||
| - Pesje | number of days | 9 | 12 | 10 | |||||||
| - Škale | number of days | 12 | 13 | 12 | |||||||
| Urban-traffic type | number of days | 82 | 46 | 58 | |||||||
| - Maribor center* | number of days | 54 | 35 | 47 | |||||||
| - Zagorje* | number of days | 109 | 56 | 68 | |||||||
| Rural/Agricultural type | number of days | 34 | 19 | 28 | |||||||
| - Vnajnarje* | number of days | np | 7 | 2 | |||||||
| - Prapretno | number of days | 25 | 20 | 29 | |||||||
| - Murska Sobota - Rakičan | number of days | 42 | 30 | 52 | |||||||
| Rural/Industrial type | number of days | 20 | 15 | 9 | |||||||
| - Morsko* | number of days | 16 | 14 | 5 | |||||||
| - Gorenje Polje* | number of days | 24 | 16 | 13 | |||||||
| Rural type/natural background | number of days | 0 | 5 | 5 | |||||||
| - Iskrba* | number of days | 0 | 5 | 5 |
National authomatic measurement air quality network database, Environmental Agency of the Republic of Slovenia, 2008
| 1998 | 1999 | 2000 | 2001 | 2002 | 2003 | 2004 | 2005 | 2006 | 2007 | ||
|---|---|---|---|---|---|---|---|---|---|---|---|
| Urban background | µg/m3 | 38 | 33 | 32 | |||||||
| - Ljubljana Bežigrad | µg/m3 | np | np | np | 43 | 42 | 46 | 41 | 37 | 33 | 32 |
| - Ljubljana BF* | µg/m3 | np | np | np | np | np | np | np | np | np | np |
| - Celje | µg/m3 | 42 | 47 | 46 | 45 | 46 | 53 | 41 | 43 | 35 | 32 |
| - Koper | µg/m3 | np | np | np | np | np | np | np | np | 31 | 29 |
| - Nova Gorica | µg/m3 | np | np | np | np | 39 | 37 | 35 | 34 | 32 | 33 |
| Suburban background | µg/m3 | 35 | 31 | 27 | |||||||
| - Trbovlje* | µg/m3 | 52 | 59 | 61 | 50 | 47 | 52 | 40 | 55 | 40 | 37 |
| - Pesje | µg/m3 | np | np | np | np | np | 31 | 25 | 27 | 28 | 21 |
| - Škale | µg/m3 | np | np | np | np | np | 27 | 23 | 23 | 26 | 24 |
| Urban-traffic type | µg/m3 | 47 | 45 | 41 | |||||||
| - Maribor center* | µg/m3 | np | np | np | 48 | 50 | 58 | 48 | 43 | 43 | 40 |
| - Zagorje* | µg/m3 | np | np | np | np | 47 | 51 | 44 | 52 | 46 | 41 |
| - EIS Celje | µg/m3 | 62 | 53 | 64 | np | np | 51 | 40 | 45 | np | np |
| Rural/Agricultural type | µg/m3 | 33 | 31 | 28 | |||||||
| - Vnajnarje* | µg/m3 | np | np | np | np | np | np | np | np | 26 | 22 |
| - Prapretno | µg/m3 | np | np | np | np | np | np | 30 | 28 | 34 | 33 |
| - Murska Sobota-Rakičan | µg/m3 | np | np | np | np | 40 | 43 | 32 | 37 | 34 | 30 |
| Rural/Industrial type | µg/m3 | 24 | |||||||||
| - Morsko* | µg/m3 | np | np | np | np | np | np | np | np | np | 23 |
| - Gorenje Polje* | µg/m3 | np | np | np | np | np | np | np | np | np | 24 |
| Rural type/natural background | µg/m3 | 16 | 16 | 15 | |||||||
| - Iskrba* | µg/m3 | np | np | np | np | np | np | np | 16 | 16 | 15 |
| 2008 | 2009 | 2010 | |||||||||
| Urban background | µg/m3 | 29 | 27 | 29 | |||||||
| - Ljubljana Bežigrad | µg/m3 | 30 | 29 | 30 | |||||||
| - Ljubljana BF* | µg/m3 | np | 26 | 27 | |||||||
| - Celje | µg/m3 | 30 | 31 | 32 | |||||||
| - Koper | µg/m3 | 25 | 23 | 25 | |||||||
| - Nova Gorica | µg/m3 | 31 | 28 | 29 | |||||||
| Suburban background | µg/m3 | 27 | 26 | 26 | |||||||
| - Trbovlje* | µg/m3 | 38 | 33 | 34 | |||||||
| - Pesje | µg/m3 | 20 | 22 | 22 | |||||||
| - Škale | µg/m3 | 22 | 24 | 23 | |||||||
| Urban-traffic type | µg/m3 | 39 | 33 | 35 | |||||||
| - Maribor center* | µg/m3 | 34 | 30 | 33 | |||||||
| - Zagorje* | µg/m3 | 44 | 36 | 36 | |||||||
| - EIS Celje | µg/m3 | np | np | np | |||||||
| Rural/Agricultural type | µg/m3 | 30 | 28 | 26 | |||||||
| - Vnajnarje* | µg/m3 | np | 23 | 20 | |||||||
| - Prapretno | µg/m3 | 29 | 31 | 29 | |||||||
| - Murska Sobota-Rakičan | µg/m3 | 30 | 29 | 30 | |||||||
| Rural/Industrial type | µg/m3 | 24 | 22 | 20 | |||||||
| - Morsko* | µg/m3 | 22 | 20 | 19 | |||||||
| - Gorenje Polje* | µg/m3 | 26 | 23 | 20 | |||||||
| Rural type/natural background | µg/m3 | 16 | 16 | 19 | |||||||
| - Iskrba* | µg/m3 | 16 | 16 | 19 |
Zbirka podatkov avtomatskih meritev državne mreže za spremljanje kakovosti zraka (DMKZ), Agencija Republike Slovenije za okolje, 2009
| 2005 | 2006 | 2007 | 2008 | 2009 | 2010 | ||
|---|---|---|---|---|---|---|---|
| Urban background | |||||||
| - Ljubljana Bežigrad | µg/m3 | 28 | 29 | 25 | 24 | np | np |
| - Ljubljana BF | µg/m3 | np | np | np | np | 18 | 22 |
| - Maribor Vrbanski plato | µg/m3 | np | np | np | np | 20 | 22 |
| Urban-traffic type | |||||||
| - Maribor center | µg/m3 | 28 | 31 | 27 | 23 | 22 | 24 |
| Rural background | |||||||
| - Iskrba | µg/m3 | 15 | 13 | 10 | 11 | 12 | 12 |
Goals
In the Decree on Sulphur Dioxide, Nitrogen Oxides, Particulate Matter and Lead in Ambient Air (OJ RS No 52/02), Slovenian domestic legislation was brought in line with the provisions of the EU Directive (1999/30/EC), which determines the 24-hour limit concentration value at 50 µg/m3, which is not to be exceeded more than 35 times per calendar year, and annual limit value at 40 µg/m3.
Comment
Measurements of particlulate matter (PM10) concentration levels in several urban areas came into practice with the introduction of a new air quality monitoring network (i.e. PHARE monitoring network) in March 2001. As is clearly evident from Figure ZR8-1, particulate matter poses a serious problem not only in Slovenian urban areas but also throughout Europe. In 2002, 24-hour limit values were exceeded more than 35 times per calendar year at five monitoring sites. Since the latter are mainly placed in heavy traffic locations, emissions from traffic bear a significant influence on particulate matter concentration levels in ambient air.
Methodology
The data for Slovenia are taken from the Automatic Air Quality Measurement Database (ANAS) managed by the Monitoring Office (Environmental Agency of the Republic of Slovenia). The database is updated monthly; the data are available in their entirety upon the completion of final annual review.
Following the Guidance to member states on PM10 monitoring and intercomparisons with reference method (14 September 2004) the PM10 concentration values for 2002 include factor 1.3.


