[EN11] Total energy intensity
[EN11] Total energy intensity

Key message

Slovenia has a high degree of energy intensity, but her reduction has stopped in recent years. Due to Slovenia departs from the average EU-27. This represents a departure from the goals set.
Definition
Charts
Figure EN11-1: Trends in total energy consumption, gross domestic product and total energy intensity in period 1995-2012 according to 1995 and comparison with the intensity trend in EU-27
Sources:
The jožef Stefan Institute, Statistical Office of the RS, EUROSTAT, 2013
| 1995 | 1996 | 1997 | 1998 | 1999 | 2000 | 2001 | 2002 | 2003 | 2004 | ||
|---|---|---|---|---|---|---|---|---|---|---|---|
| Total primary energy supply | ktoe | 6060 | 6362 | 6572 | 6405 | 6347 | 6394 | 6665 | 6730 | 6823 | 7030 |
| GDP constant prices of the previous year, reference year 2005 | mio EUR | 19878 | 20577 | 21629 | 22340 | 23518 | 24496 | 25218 | 26186 | 26930 | 28102 |
| Total energy intensity - Slovenia | toe/mio EUR 2005 | 305 | 309 | 304 | 287 | 270 | 261 | 264 | 257 | 253 | 250 |
| Total energy intensity - EU28 | toe/mio EUR 2005 | 190 | 193 | 186 | 182 | 176 | 171 | 171 | 168 | 169 | 167 |
| Total primary energy supply | Index (1995 = 100) | 100 | 105 | 108 | 106 | 105 | 106 | 110 | 111 | 113 | 116 |
| GDP constant prices of the previous year, reference year 2000 | Index (1995 = 100) | 100 | 104 | 109 | 112 | 118 | 123 | 127 | 132 | 135 | 141 |
| Total energy intensity - Slovenia | Index (1995 = 100) | 100 | 101 | 100 | 94 | 89 | 86 | 87 | 84 | 83 | 82 |
| Total energy intensity - EU28 | Index (1995 = 100) | 100 | 102 | 98 | 96 | 92 | 90 | 90 | 88 | 89 | 88 |
| 2005 | 2006 | 2007 | 2008 | 2009 | 2010 | 2011 | 2012 | 2013 | |||
| Total primary energy supply | ktoe | 7207 | 7220 | 7233 | 7650 | 7012 | 7136 | 7231 | 6981 | 6797 | |
| GDP constant prices of the previous year, reference year 2005 | mio EUR | 29227 | 30880 | 33023 | 34113 | 31453 | 31837 | 32033 | 31187 | 30876 | |
| Total energy intensity - Slovenia | toe/mio EUR 2005 | 247 | 234 | 219 | 224 | 223 | 224 | 226 | 224 | 220 | |
| Total energy intensity - EU28 | toe/mio EUR 2005 | 164 | 159 | 152 | 151 | 149 | 152 | 144 | 143 | 0 | |
| Total primary energy supply | Index (1995 = 100) | 119 | 119 | 119 | 126 | 116 | 118 | 119 | 115 | 112 | |
| GDP constant prices of the previous year, reference year 2000 | Index (1995 = 100) | 147 | 155 | 166 | 172 | 158 | 160 | 161 | 157 | 155 | |
| Total energy intensity - Slovenia | Index (1995 = 100) | 81 | 77 | 72 | 74 | 73 | 74 | 74 | 73 | 72 | |
| Total energy intensity - EU28 | Index (1995 = 100) | 86 | 84 | 80 | 79 | 78 | 80 | 76 | 75 |
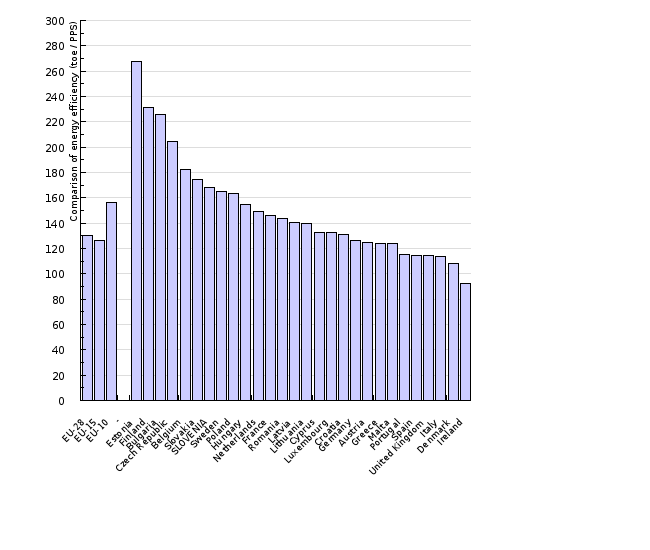
Figure EN11-2: Comparison of the energy intensity (TPES/GDP in PPS) between EU-27 countries for 2011
Sources:
Eurostat, The Jožef Stefan Institute, 2013
| EU-28 | EU-15 | EU-10 | - | Estonia | Finland | Bulgaria | Czech Republic | Belgium | Slovakia | ||
|---|---|---|---|---|---|---|---|---|---|---|---|
| Total energy intensity 2011 | toe/PPS | 130 | 126 | 156 | 268 | 231 | 226 | 205 | 182 | 174 | |
| SLOVENIA | Sweden | Poland | Hungary | Netherlands | France | Romania | Latvia | Lithuania | Cyprus | ||
| Total energy intensity 2011 | toe/PPS | 169 | 165 | 164 | 155 | 149 | 146 | 144 | 140 | 140 | 133 |
| Luxembourg | Croatia | Germany | Austria | Greece | Malta | Portugal | Spain | United Kingdom | Italy | ||
| Total energy intensity 2011 | toe/PPS | 132 | 131 | 127 | 125 | 124 | 124 | 115 | 115 | 114 | 113 |
| Denmark | Ireland | ||||||||||
| Total energy intensity 2011 | toe/PPS | 108 | 93 |
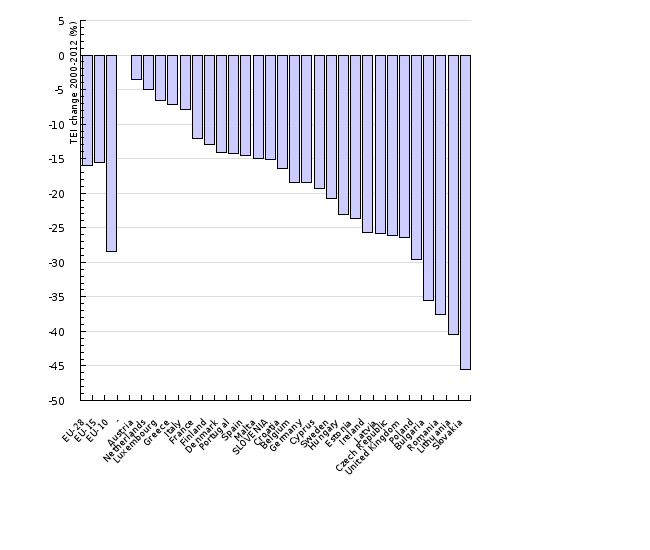
Figure EN11-3: Comparison of total energy intensity in the period 2000-2011
Sources:
EUROSTAT, The Jožef Stefan Institute, 2013
| EU-28 | EU-15 | EU-10 | - | Austria | Netherlands | Luxembourg | Greece | Italy | France | ||
|---|---|---|---|---|---|---|---|---|---|---|---|
| TEI change 2000-2012 (%) | % | -16 | -16 | -29 | -3 | -5 | -7 | -7 | -8 | -12 | |
| TEI 2000 | toe/mio EUR 2005 | 171 | 153 | 424 | 128 | 157 | 143 | 179 | 127 | 162 | |
| TEI 2011 | toe/mio EUR 2005 | 143 | 130 | 303 | 124 | 149 | 134 | 166 | 117 | 143 | |
| Finland | Denmark | Portugal | Spain | Malta | SLOVENIA | Croatia | Belgium | Germany | Cyprus | ||
| TEI change 2000-2012 (%) | % | -13 | -14 | -14 | -15 | -15 | -15 | -16 | -18 | -18 | -19 |
| TEI 2000 | toe/mio EUR 2005 | 235 | 101 | 171 | 160 | 173 | 268 | 270 | 211 | 159 | 207 |
| TEI 2011 | toe/mio EUR 2005 | 204 | 87 | 147 | 136 | 147 | 228 | 226 | 172 | 129 | 167 |
| Sweden | Hungary | Estonia | Ireland | Latvia | Czech Republic | United Kingdom | Poland | Bulgaria | Romania | ||
| TEI change 2000-2012 (%) | % | -21 | -23 | -24 | -26 | -26 | -26 | -26 | -30 | -36 | -38 |
| TEI 2000 | toe/mio EUR 2005 | 187 | 350 | 628 | 111 | 443 | 481 | 143 | 424 | 1040 | 606 |
| TEI 2011 | toe/mio EUR 2005 | 148 | 269 | 479 | 83 | 329 | 355 | 105 | 299 | 670 | 379 |
| Lithuania | Slovakia | ||||||||||
| TEI change 2000-2012 (%) | % | -40 | -45 | ||||||||
| TEI 2000 | toe/mio EUR 2005 | 490 | 604 | ||||||||
| TEI 2011 | toe/mio EUR 2005 | 292 | 329 |


