[ZD25] Reported cases of lyme borreliosis and tick-borne meningoencephalitis in Slovenia

Key message

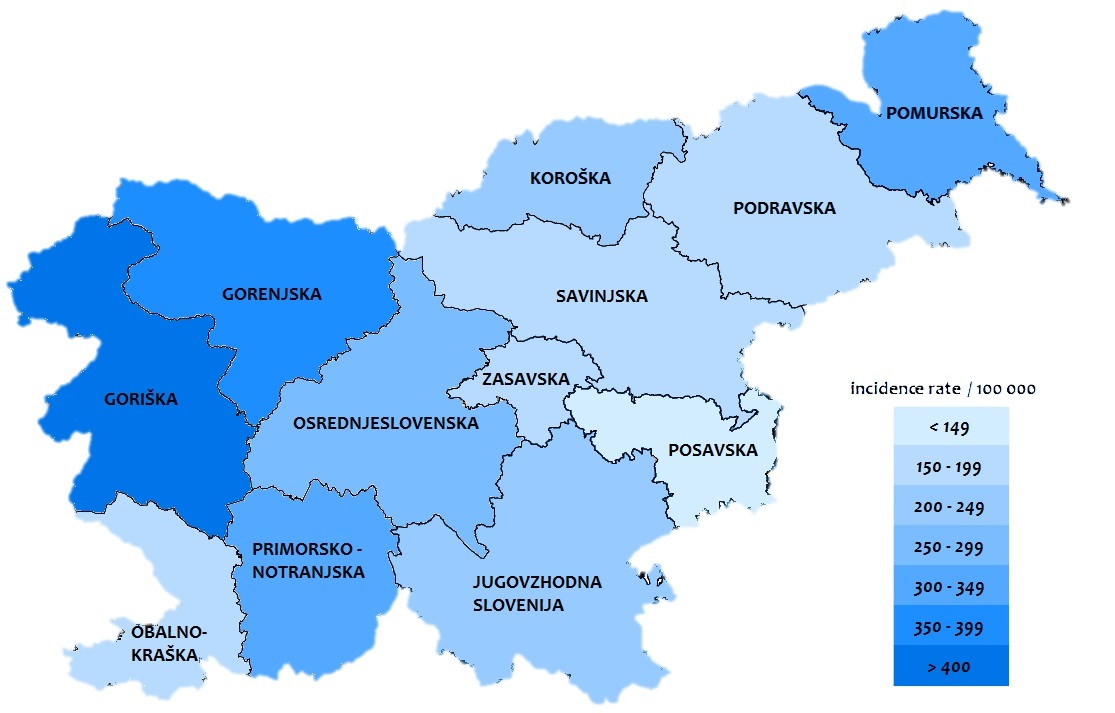
Lyme borreliosis (LB) and tick-borne meningoencephalitis (TBE) are the most common vector-borne diseases transmitted by ticks. In Slovenia, from 3,000 to over 7,000 patients with LB were registered annually, and 133 TBE cases annually in the period from 2012 to 2021 (maximum in 2013 - 309 cases, the lowest number of cases was in 2015 and 2021 - 62 cases only). Living or working in the environments where there is a potential for infection is one of the most important factors for infection with LB and TBE. Better knowledge and empowerment of population about preventive measures are key factors for reducing burden of both vector-borne diseases.
Charts
National Institute of Public Health (NIJZ), 2012–2021 (13.9.2022)
| reported cases of Lyme borreliosis[number ] | reported cases of tick-borne encephalitis[number ] | |
|---|---|---|
| 2012 | 4943 | 164 |
| 2013 | 6938 | 309 |
| 2014 | 3890 | 101 |
| 2015 | 3742 | 62 |
| 2016 | 4273 | 83 |
| 2017 | 4534 | 102 |
| 2018 | 7543 | 153 |
| 2019 | 3939 | 111 |
| 2020 | 7496 | 187 |
| 2021 | 2933 | 62 |
National Institute of Public Health (NIJZ), 2012–2021 (13.9.2022)
| Men[Incidence rate/100.000 inh.] | Women[Incidence rate/100.000 inh.] | |
|---|---|---|
| 0-4 | 275.30 | 255.48 |
| 5-9 | 328.31 | 286.96 |
| 10-14 | 170.77 | 125.78 |
| 15-19 | 114.03 | 111.46 |
| 20-24 | 142.62 | 113.25 |
| 25-29 | 139.92 | 123.38 |
| 30-34 | 148.64 | 142.73 |
| 35-39 | 174.45 | 176.02 |
| 40-44 | 208.75 | 224.26 |
| 45-49 | 237.46 | 300.29 |
| 50-54 | 257.16 | 392.11 |
| 55-59 | 280.72 | 454.24 |
| 60-64 | 290.71 | 481.96 |
| 65-69 | 303.78 | 458.39 |
| 70-74 | 247.15 | 373.99 |
| 75-79 | 203.97 | 237.08 |
| 80-84 | 129.98 | 134.16 |
| 85+ | 70.77 | 51.00 |
| Starost - SKUPAJ | 217.30 | 263.93 |
National Institute of Public Health (NIJZ), 2012–2021 (13.9.2022)
| Men[Incidence rate/100.000 inh.] | Women[Incidence rate/100.000 inh.] | |
|---|---|---|
| 0-4 | 2.02 | 1.19 |
| 5-9 | 6.53 | 4.62 |
| 10-14 | 6.42 | 3.28 |
| 15-19 | 6.52 | 2.41 |
| 20-24 | 6.16 | 2.34 |
| 25-29 | 7.00 | 3.17 |
| 30-34 | 5.91 | 3.62 |
| 35-39 | 3.45 | 4.69 |
| 40-44 | 6.14 | 4.41 |
| 45-49 | 7.07 | 6.77 |
| 50-54 | 8.87 | 8.82 |
| 55-59 | 10.71 | 10.03 |
| 60-64 | 11.32 | 9.28 |
| 65-69 | 12.29 | 9.96 |
| 70-74 | 9.96 | 6.99 |
| 75-79 | 7.98 | 5.83 |
| 80-84 | 12.43 | 3.01 |
| 85+ | 5.77 | 1.17 |
| Starost - SKUPAJ | 7.43 | 5.45 |
National Institute of Public Health (NIJZ), 2021 (13.9.2022)
| reported cases of Lyme disease [number ] | reported cases of tick-borne encephalitis[number ] | |
|---|---|---|
| January | 90 | 0 |
| February | 60 | 2 |
| March | 116 | 3 |
| April | 189 | 4 |
| May | 394 | 7 |
| June | 611 | 12 |
| July | 499 | 10 |
| August | 316 | 5 |
| September | 226 | 2 |
| October | 151 | 10 |
| November | 155 | 6 |
| December | 126 | 1 |
National Institute of Public Health (NIJZ), 2017-2021 (13.9.2022)
| reported cases of Lyme borreliosis[Incidence rate/100.000 inh.] | |
|---|---|
| 01-Pomurska | 348.78 |
| 02-Podravska | 194.44 |
| 03-Koroška | 237.82 |
| 04-Savinjska | 181.91 |
| 05-Zasavska | 153.76 |
| 06-Posavska | 136.48 |
| 07-Jugovzhodna Slovenija | 209.18 |
| 08-Osrednjeslovenska | 253.76 |
| 09-Gorenjska | 358.14 |
| 10-Primorsko-notranjska | 310.31 |
| 11-Goriška | 423.04 |
| 12-Obalno-kraška | 180.56 |
National Institute of Public Health (NIJZ), 2012–2021, (13. 09. 2022)
| reported cases of tick-borne encephalitis [Incidence rate/100.000 inh.] | |
|---|---|
| 01-Pomurska | 4.36 |
| 02-Podravska | 3.58 |
| 03-Koroška | 17.24 |
| 04-Savinjska | 3.66 |
| 05-Zasavska | 1.75 |
| 06-Posavska | 1.06 |
| 07-Jugovzhodna Slovenija | 5.11 |
| 08-Osrednjeslovenska | 5.83 |
| 09-Gorenjska | 13.31 |
| 10-Primorsko-notranjska | 18.54 |
| 11-Goriška | 4.74 |
| 12-Obalno-kraška | 0.69 |
Comment


