[KM01] Pesticide consumption

Key message

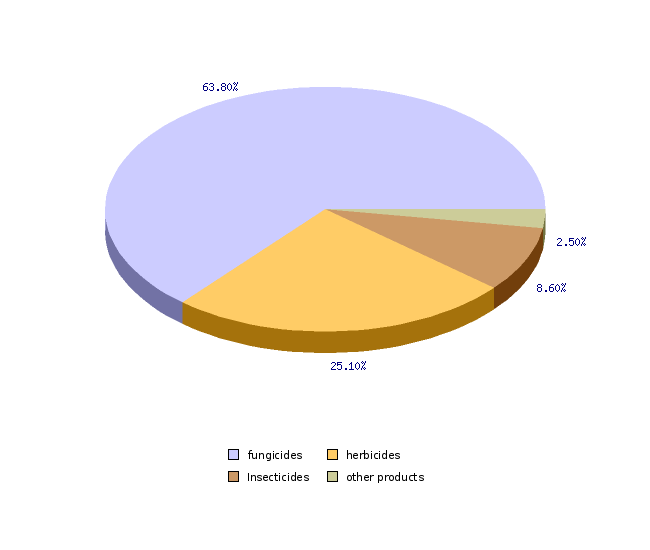
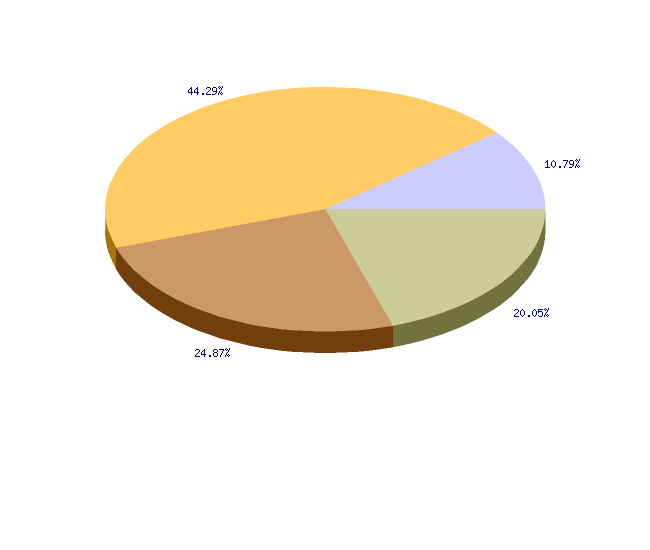
In the last ten years, the consumption of Plant Protection Products (PPPs) in Slovenia has been relatively constant and has experienced only minor fluctuations. After 2004, the consumption of PPPs unexpectedly increased on account of fungicides, and decreased again in 2005 by more than 8%. The decrease in the consumption of PPPs is mostly due to the decrease in the consumption of fungicides, which fell by 15 % in comparison with 2004. In spite of that, fungicides still represent more than 68 % of all consumed PPPs in Slovenia. Among them prevail inorganic fungicides based on sulphur and copper (59 %), which are less problematic from the environmental aspect. The annual consumption of fungicides depends to a large degree on climatic conditions which dictate the consumption of fungicides and thus the consumption of PPPs, which accounts for constant minor fluctuations in their consumption. In 2005, the consumption of herbicides slightly increased in comparison with 2004, but it was still considerably lower than between 2000 and 2004. Insecticides are rarely used in Slovenia, representing less than 7 % of all PPPs. In the last six years, their consumption has been relatively constant and, much like fungicides, depended on weather conditions within individual years. The consumption of PPPs per hectare of cultivated land in Slovenia exceeds the average consumption in the EU-15 countries mostly due to the insufficient accuracy of the data on cultivated land. In spite of this, the consumption of PPPs is quite comparable with the consumption in the countries with a similar structure of crops and similar production conditions.
Definition
Pesticides (also called Plant Protection Products) are active substances or their preparations intended for the protection of plants or plant products. These active substances have either a general or specific effect on harmful organisms or plants, parts of plants or plant products.
The use of pesticides to protect plants from diseases, pests and weeds is one of the elementary technological measures in the production of crops to improve growth and increase the quantity and quality of the produce.
The indicator presents the sale of active substances for the protection of plants (for the sake of clarity hereinafter referred to as pesticides) in the period between 2000 and 2005. We presented the total quantity of products sold and the sales of individual groups of pesticides (fungicides, herbicides, insecticides). Hereinafter, sales are presented as consumption. We calculated the consumption of pesticides per hectare of cultivated land (arable land and permanent crops) and compared the data with the EU countries (EU-15).
In its current form, the indicator should be considered only temporary due to the unreliable data and in the future, it will have to be upgraded with more reliable data on the actual surface area of cultivated land and the data on the consumption of pesticides on this land. Here, the Statistical Office of the Republic of Slovenia only considers the agricultural land in the scope of agricultural holdings, while the sales also include pesticides used outside the agricultural holdings. According to some estimates, this category of land covers more than 50,000 hectares. These are mostly permanent crops and gardens where protection measures are applied with the use of pesticides.
Charts
Statistical Office of the Republic of Slovenia, 2008.
| 1992 | 1993 | 1994 | 1995 | 1996 | 1997 | 1998 | 1999 | 2000 | 2001 | ||
|---|---|---|---|---|---|---|---|---|---|---|---|
| Fungicides and bactericides | t | 916 | 917 | 731 | 693 | 656 | 694 | 839 | 886 | 842.6 | 932.7 |
| Herbicides | t | 655 | 576 | 526 | 418 | 425 | 478 | 428 | 432 | 408.5 | 365.9 |
| Insecticides | t | 353 | 324 | 296 | 260 | 243 | 180 | 154 | 192 | 98 | 80.9 |
| Other products | t | 107 | 109 | 119 | 124 | 117 | 100 | 105 | 92 | 119 | 18.8 |
| Total | t | 2031 | 1962 | 1672 | 1495 | 1444 | 1452 | 1526 | 1602 | 1468.1 | 1398.3 |
| 2002 | 2003 | 2004 | 2005 | 2006 | |||||||
| Fungicides and bactericides | t | 936.7 | 844.1 | 1114.5 | 968 | 817 | |||||
| Herbicides | t | 385 | 400.5 | 291.2 | 320 | 322 | |||||
| Insecticides | t | 109.5 | 122.9 | 99.9 | 97 | 110 | |||||
| Other products | t | 40.8 | 67 | 25.2 | 29 | 32 | |||||
| Total | t | 1471.9 | 1434.5 | 1530.7 | 1414 | 1281 |
Statistical Office of the Republic of Slovenia, 2008; Phytosanitary Administration of the Republic of Slovenia, 2008.
| 2006 | ||
|---|---|---|
| fungicides | kg | 817280.548832 |
| herbicides | kg | 321887 |
| Insecticides | kg | 109990 |
| other products | kg | 31822 |
| total | kg | 1280980 |
| fungicides | % | 63.8 |
| herbicides | % | 25.1 |
| Insecticides | % | 8.6 |
| other products | % | 2.5 |
| total | % | 100 |
Statistical Office of the Republic of Slovenia, 2008; Phytosanitary Administration of the Republic of Slovenia, 2008.
| 2006 | ||
|---|---|---|
| inorganic fungicides based on copper compounds | kg | 88193.4 |
| other inorganic fungicides (mainly on the basis of sulfur) | kg | 361957.9 |
| fungicides based on dithiocarbamates | kg | 203261 |
| other fungicides | kg | 163868.2 |
| total | kg | 817280.5 |
| inorganic fungicides based on copper compounds | % | 10.8 |
| other inorganic fungicides (mainly on the basis of sulfur) | % | 44.3 |
| fungicides based on dithiocarbamates | % | 24.9 |
| other fungicides | % | 20.1 |
| total | % | 100 |
Statistical Office of the Republic of Slovenia, 2007; Ministry of Agriculture, Forestry and Food, 2005; Phytosanitary Administration of the Republic of Slovenia, 2007.
| 2000 | 2001 | 2002-SURS | 2002 - MKGP | 2003 | 2004 | 2005 | 2006 | ||
|---|---|---|---|---|---|---|---|---|---|
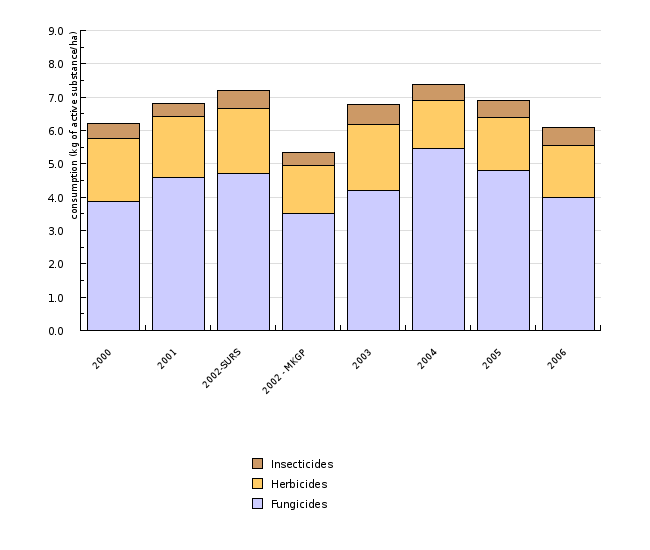
| Fungicides | kg/ha | 3.9 | 4.6 | 4.7 | 3.5 | 4.2 | 5.5 | 4.8 | 4 |
| Herbicides | kg/ha | 1.9 | 1.8 | 1.9 | 1.4 | 2 | 1.4 | 1.6 | 1.6 |
| Insecticides | kg/ha | 0.5 | 0.4 | 0.6 | 0.4 | 0.6 | 0.5 | 0.5 | 0.5 |
| Total | kg/ha | 6.8 | 6.9 | 7.4 | 5.5 | 7.1 | 7.5 | 6.9 | 6.2 |
Eurostat, 2002; European Crop Protection Association; Statistical Office of the Republic of Slovenia, 2005; Phytosanitary Administration of the Republic of Slovenia, 2005.
| IT | EL | PT | FR | NL | EU-15 | BE+LU | ES | AT | UK | ||
|---|---|---|---|---|---|---|---|---|---|---|---|
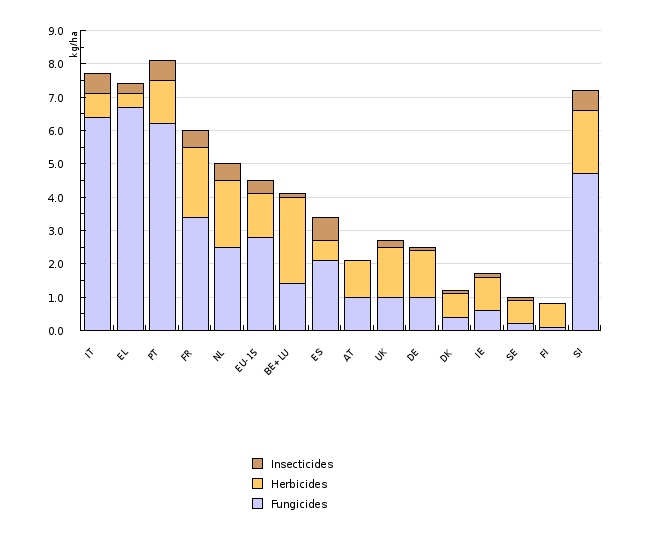
| Fungicides | kg/ha | 6.4 | 6.7 | 6.2 | 3.4 | 2.5 | 2.8 | 1.4 | 2.1 | 1 | 1 |
| Herbicides | kg/ha | 0.7 | 0.4 | 1.3 | 2.1 | 2 | 1.3 | 2.6 | 0.6 | 1.1 | 1.5 |
| Insecticides | kg/ha | 0.6 | 0.3 | 0.6 | 0.5 | 0.5 | 0.4 | 0.1 | 0.7 | 0 | 0.2 |
| Total | kg/ha | 7.7 | 7.4 | 8.1 | 6 | 5 | 4.5 | 4.1 | 3.4 | 2.1 | 2.7 |
| DE | DK | IE | SE | FI | SI | ||||||
| Fungicides | kg/ha | 1 | 0.4 | 0.6 | 0.2 | 0.1 | 4.7 | ||||
| Herbicides | kg/ha | 1.4 | 0.7 | 1 | 0.7 | 0.7 | 1.9 | ||||
| Insecticides | kg/ha | 0.1 | 0.1 | 0.1 | 0.1 | 0 | 0.6 | ||||
| Total | kg/ha | 2.5 | 1.2 | 1.7 | 1 | 0.8 | 7.4 |
Goals
The goal of the Environmental Protection Act is to prevent and lessen the burdening of the environment and preserve and improve the quality of the environment. Improving the condition of groundwater and achieving the threshold values for pesticides and their decomposition products in drinking water and drinking water resources in accordance with the Rules on Drinking Water is a very important task. The Resolution on National Environmental Action Plan anticipates a decrease in pesticide consumption, introduction of organic and other environmentally friendly types of farming, and prevention of further burdening from point and non-point sources. The traffic, supervision and consumption of pesticides are defined in detail in the Provision and Consumption of Plant Protection Products Act in order to prevent their harmful effect on the people and environment in general.
The prevention of harmful effects of pesticides is also defined in a number of regulation acts with descriptive and quantitative goals for the prevention of the pollution of the environment with these products. Among others, the Rules concerning good agricultural practice in the protection of plants define the implementation of the protective measures in order to prevent the environment from pollution. With the aim to protect the environment, particularly groundwater and drinking water, from pollution with pesticides, the consumption of certain plant protection products was banned in individual endangered areas of aquifers and in their drainage basins by a decree of the Government of the Republic of Slovenia, when it was established that their values or the values of their decomposition products exceeded the threshold (Official Gazette of the Republic of Slovenia, No. 97/02).
The protection of agricultural land and waters from pollution is one of the key goals of the Rural Development Programme for the Republic of Slovenia 2007–2013.
Comment
Since 2000, the consumption of pesticides in Slovenia has been relatively stable with only minor annual fluctuations. The situation was very stable in the 2000–2003 period. In 2004, the consumption increased by 6.7 % in comparison with 2003, and in 2005, it decreased by more than 8 % in comparison with 2004. The cause for the fluctuation is a significantly higher consumption of fungicides in 2004, which increased by 32 % in comparison with 2003. The increased consumption of fungicides in 2004 was due to favourable conditions for the development of diseases in comparison with the very dry 2003, when significantly fewer measures for the suppression of diseases were taken. This was confirmed by the data for 2005 when the consumption of fungicides decreased by more than 15 % in comparison with 2004, and the total consumption of the products for the protection of plants decreased by more than 8 %.
In the 2000-2005 period, the consumption of pesticides per hectare of cultivated land increased from 6.8 kg of active substances per hectare in 2000 to 7.5 kg of active substances per hectare in 2004, and dropped to below 7 kg of active substances per hectare in 2005. Among the pesticides, the consumption of fungicides decreased the most, from 5.5 kg of active substances per hectare to 4.8 kg of active substances per hectare, or by 15 %. In contrast to fungicides, the consumption of herbicides in 2005 was slightly higher than in 2004, but still considerably lower than in the 2000-2003 period. In 2005, the consumption of herbicides was 1.6 kg of active substances per hectare, and in 2000, it was only 1.9 kg of active substances per hectare. In the last six years, the consumption of insecticides changed the least, from 0.45 kg of active substances per hectare in 2000 to 0.48 kg of active substances per hectare in 2005.
The presented consumption of pesticides per hectare is slightly overestimated, since the official information from the Statistical Office of the Republic of Slovenia does not include all the land where the pesticides are used. In Slovenia, major fragmentation is characteristic of parcels and ownership of cultivated land. Many parcels are owned by non-farmers, which prevents more detailed data processing.
On average, the consumption of pesticides per hectare in Slovenia is higher compared to the EU-15 countries, but it is similar to the consumption in comparable countries with similar types of crops and similar production conditions. A high percentage of permanent crops – orchards, vineyards and hop fields - is characteristic of Slovenia; in these areas, the consumption of pesticides (mostly fungicides) per hectare is considerably higher than the consumption of such products in cereals and the majority of root crops.
Methodology
Data for Slovenia
In Slovenia, data on the production and sales of pesticides are collected by the Phytosanitary Administration of the Republic of Slovenia, and the data on the utilised agricultural area and cultivated land are collected by the Statistical Office of the Republic of Slovenia. The data are annually published in the Statistical Yearbook of the Republic of Slovenia. The data on agricultural land are also periodically prepared and edited by the Ministry of Agriculture, Forestry and Food (for 2002 and 2005). These data, however, are considerably different from the data prepared by the Statistical Office of the Republic of Slovenia.
Data for Europe
Data on the production, sales and consumption of pesticides are collected by a number of organisations, such as Eurostat, OECD and ECPA (European Crop Protection Association). Data used by these organisations have been acquired in different ways and for different periods and thus they differ considerably.


