[PR07] Impacts of transport on air quality in urban areas

Key message

Data on air pollution shows that Slovenian cities are overpolluted, primarily with NO2 and PM10. Transport is one of the main causes of this pollution. In general, air quality is improving, especially since the economic downturn in 2008 after which the volume of passenger traffic was reduced.
Definition
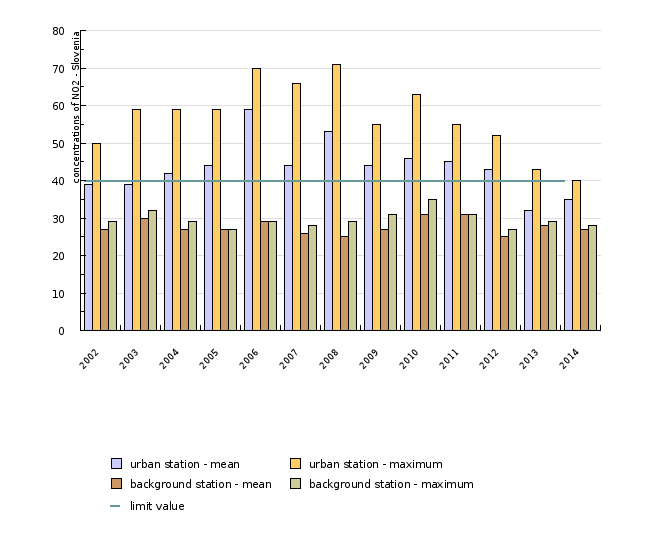
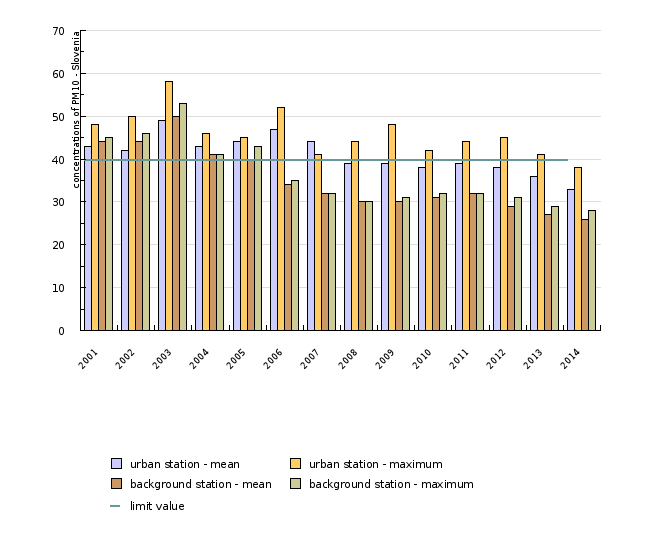
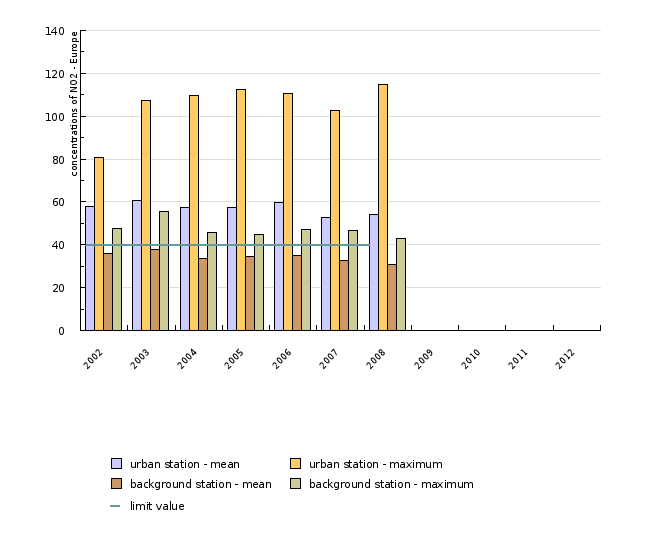
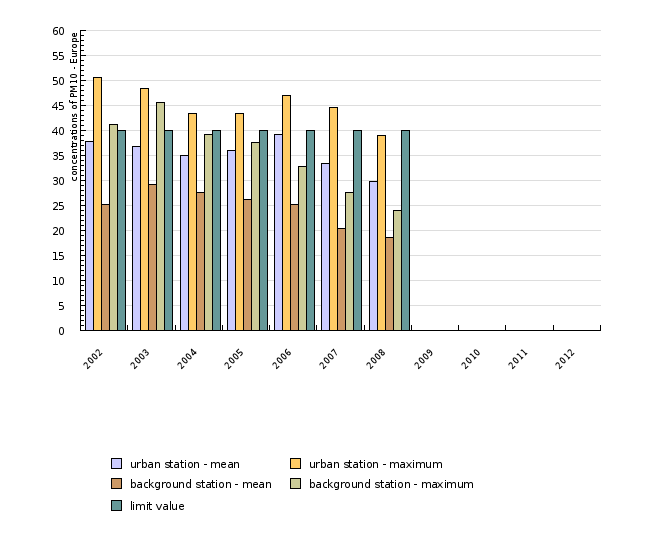
This indicator shows the impact of transport on air quality in urban areas, expressed as air concentration of nitrogen dioxide (NO2) and particulate matter (PM10) in the period 2002–2014 for Slovenia and in the period 2002–2008 for Europe. The calculation is based on the comparison of average annual and average maximum annual values of pollutants measured at monitoring locations that are exposed to a direct (city traffic stations) and indirect (city background stations) burden of traffic. The indicator also shows the number of times that limit values for PM10 particulates were exceeded in the period 2005–2014 in Slovenia.
Charts
Database of automatic readings from the national network for monitoring air quality (DMKZ). Hydrology and State of the Environment office, Slovenian Environment Agency, 2015.
| 2002 | 2003 | 2004 | 2005 | 2006 | 2007 | 2008 | 2009 | 2010 | 2011 | ||
|---|---|---|---|---|---|---|---|---|---|---|---|
| Maribor (DMKZ) | µg/m3 | 36 | 37 | 31 | 33 | 39 | 37 | 34 | 32 | 34 | 34 |
| Ljubljana center (OMS Ljubljana) | µg/m3 | 50 | 59 | 59 | 59 | 70 | 66 | 71 | 55 | 63 | 55 |
| Celje (EIS Celje) | µg/m3 | 30 | 22 | 36 | 40 | 67 | 29 | np | np | np | np |
| urban station - mean | µg/m3 | 39 | 39 | 42 | 44 | 59 | 44 | 53 | 44 | 46 | 45 |
| urban station - maximum | µg/m3 | 50 | 59 | 59 | 59 | 70 | 66 | 71 | 55 | 63 | 55 |
| Ljubljana Bežigrad (DMKZ) | µg/m3 | 29 | 32 | 29 | 27 | 29 | 28 | 29 | 31 | 35 | 31 |
| Celje (DMKZ) | µg/m3 | 24 | 27 | 24 | 26 | 28 | 23 | 21 | 22 | 26 | |
| background station - mean | µg/m3 | 27 | 30 | 27 | 27 | 29 | 26 | 25 | 27 | 31 | 31 |
| background station - maximum | µg/m3 | 29 | 32 | 29 | 27 | 29 | 28 | 29 | 31 | 35 | 31 |
| 2012 | 2013 | 2014 | |||||||||
| Maribor (DMKZ) | µg/m3 | 33 | 32 | 30 | |||||||
| Ljubljana center (OMS Ljubljana) | µg/m3 | 52 | 43 | 40 | |||||||
| Celje (EIS Celje) | µg/m3 | np | 20 | np | |||||||
| urban station - mean | µg/m3 | 43 | 32 | 35 | |||||||
| urban station - maximum | µg/m3 | 52 | 43 | 40 | |||||||
| Ljubljana Bežigrad (DMKZ) | µg/m3 | 22 | 29 | 26 | |||||||
| Celje (DMKZ) | µg/m3 | 27 | 26 | 28 | |||||||
| background station - mean | µg/m3 | 25 | 28 | 27 | |||||||
| background station - maximum | µg/m3 | 27 | 29 | 28 |
Database of automatic readings from the national network for monitoring air quality (DMKZ). Hydrology and State of the Environment office, Slovenian Environment Agency, 2015.
| 2001 | 2002 | 2003 | 2004 | 2005 | 2006 | 2007 | 2008 | 2009 | 2010 | ||
|---|---|---|---|---|---|---|---|---|---|---|---|
| Maribor (DMKZ) | µg/m3 | 48 | 50 | 58 | 48 | 43 | 43 | 40 | 34 | 30 | 33 |
| Celje (EIS Celje) | µg/m3 | 37 | 34 | 39 | 40 | 45 | 47 | 41 | np | np | np |
| Ljubljana center (OMS Ljubljana) | µg/m3 | np | np | np | no | np | 52 | 51 | 43 | 48 | 42 |
| urban station - mean | µg/m3 | 43 | 42 | 49 | 43 | 44 | 47 | 44 | 39 | 39 | 38 |
| urban station - maximum | µg/m3 | 48 | 50 | 58 | 46 | 45 | 52 | 41 | 44 | 48 | 42 |
| Ljubljana Bežigrad (DMKZ) | µg/m3 | 43 | 42 | 46 | 41 | 37 | 33 | 32 | 30 | 29 | 30 |
| Celje (DMKZ) | µg/m3 | 45 | 46 | 53 | 41 | 43 | 35 | 32 | 30 | 31 | 32 |
| background station - mean | µg/m3 | 44 | 44 | 50 | 41 | 40 | 34 | 32 | 30 | 30 | 31 |
| background station - maximum | µg/m3 | 45 | 46 | 53 | 41 | 43 | 35 | 32 | 30 | 31 | 32 |
| 2011 | 2012 | 2013 | 2014 | ||||||||
| Maribor (DMKZ) | µg/m3 | 34 | 30 | 30 | 27 | ||||||
| Celje (EIS Celje) | µg/m3 | np | np | np | np | ||||||
| Ljubljana center (OMS Ljubljana) | µg/m3 | 44 | 45 | 41 | 38 | ||||||
| urban station - mean | µg/m3 | 39 | 38 | 36 | 33 | ||||||
| urban station - maximum | µg/m3 | 44 | 45 | 41 | 38 | ||||||
| Ljubljana Bežigrad (DMKZ) | µg/m3 | 32 | 26 | 24 | 23 | ||||||
| Celje (DMKZ) | µg/m3 | - | 31 | 29 | 28 | ||||||
| background station - mean | µg/m3 | 32 | 29 | 27 | 26 | ||||||
| background station - maximum | µg/m3 | 32 | 31 | 29 | 28 |
Database of automatic readings from the national network for monitoring air quality (DMKZ). Hydrology and State of the Environment office, Slovenian Environment Agency, 2015.
| 2005 | 2006 | 2007 | 2008 | 2009 | 2010 | 2011 | 2012 | 2013 | 2014 | ||
|---|---|---|---|---|---|---|---|---|---|---|---|
| Maribor (DMKZ) | number | 101 | 108 | 91 | 54 | 35 | 47 | 64 | 34 | 36 | 25 |
| Ljubljana center (OMS Ljubljana) | number | 101 | 112 | 74 | 94 | 107 | 74 | 55 | |||
| Celje (EIS Celje) | number | 89 | 92 | ||||||||
| Celje (DMKZ) | number | 97 | 59 | 48 | 37 | 42 | 58 | 55 | 51 | 41 | |
| Ljubljana Bežigrad (DMKZ) - background station | number | 70 | 47 | 46 | 36 | 30 | 43 | 63 | 27 | 22 | 19 |
EEA, Exceedances of air quality objectives due to traffic, 2011.
| 2002 | 2003 | 2004 | 2005 | 2006 | 2007 | 2008 | 2009 | 2010 | 2011 | ||
|---|---|---|---|---|---|---|---|---|---|---|---|
| urban station - mean | µg/m3 | 58 | 60.7 | 57.3 | 57.5 | 59.7 | 52.9 | 54 | |||
| urban station - maximum | µg/m3 | 80.6 | 107.2 | 109.7 | 112.4 | 110.7 | 102.7 | 115 | |||
| background station - mean | µg/m3 | 36 | 37.7 | 33.6 | 34.3 | 34.9 | 32.8 | 31 | |||
| background station - maximum | µg/m3 | 47.7 | 55.7 | 45.7 | 44.8 | 47.1 | 46.4 | 43 | |||
| 2012 | |||||||||||
| urban station - mean | µg/m3 | ||||||||||
| urban station - maximum | µg/m3 | ||||||||||
| background station - mean | µg/m3 | ||||||||||
| background station - maximum | µg/m3 |
EEA, Exceedances of air quality objectives due to traffic, 2011.
| 2002 | 2003 | 2004 | 2005 | 2006 | 2007 | 2008 | 2009 | 2010 | 2011 | ||
|---|---|---|---|---|---|---|---|---|---|---|---|
| urban station - mean | µg/m3 | 37.8 | 36.8 | 34.9 | 36.1 | 39.2 | 33.5 | 29.7 | |||
| urban station - maximum | µg/m3 | 50.5 | 48.3 | 43.3 | 43.4 | 46.9 | 44.7 | 39.1 | |||
| background station - mean | µg/m3 | 25.2 | 29.1 | 27.6 | 26.1 | 25.2 | 20.4 | 18.6 | |||
| background station - maximum | µg/m3 | 41.2 | 45.7 | 39.2 | 37.6 | 32.9 | 27.6 | 23.9 | |||
| 2012 | |||||||||||
| urban station - mean | µg/m3 | ||||||||||
| urban station - maximum | µg/m3 | ||||||||||
| background station - mean | µg/m3 | ||||||||||
| background station - maximum | µg/m3 |
Goals
To comply with the following limit values for ambient air concentrations of nitrogen oxides in order to protect human health and vegetation:
- hourly NO2 concentration limit value for human health protection: 200 µg/m3 (allowed exceedance: 18 times within a calendar year);
- annual NO2 concentration limit value for human health protection (to be met by 1 January 2010): 40 µg/m3;
- annual critical value for plant protection: 30 µg NOx/m3. Critical value for NO2 measured in three consecutive hours at places that are representative for air quality in areas of at least 100 km2, in the entire area or in agglomerations must not exceed 400 µg/m3.
- Limit values for ambient air concentration of PM10 particulates for protection of human health:
- daily PM10 concentration limit value: 50 µg/m3 (allowed exceedance: 35 times within a calendar year);
- annual PM10 concentration limit value: 40 µg/m3.
Comment
Despite a considerable reduction in emissions from transport, air quality continues to remain a serious environmental and health problem, especially in urban areas. Measurements show that many European and Slovenian cities fail to approach the limit values defined in European legislation as regards the quality of ambient air. In particular, nitrogen dioxide (NO2) represents a problem, as fuel quality regulations, which are mostly intended to reduce sulphur content in fuels, have significantly contributed to the reduction of pollution caused by sulphur dioxide (SO2). In addition to being the main source of NO2 emissions, transport is usually the prevailing source of particulates (PM10) in cities.
Although air pollution has long been known as having harmful effects on human health, new findings and evidence keep piling up. Short-term exposure to NO2 is connected with reduced lung function, increased susceptibility of respiratory tract to infection and responsiveness to natural allergens. Long-term exposure is related to increased risk of respiratory tract infections, especially in more vulnerable groups, i.e. children. Nitrogen oxides are an important cause of environmental problems, such as acidification and eutrophication as well as the formation of photochemical smog and tropospheric ozone (O3). Particulates affect the respiratory tract as well. There is an increasing amount of evidence that fine particulates tend to be more hazardous than larger ones. According to estimates, air polluted with particulates cause 350,000 premature deaths in Europe each year (EEA, 2009).
The Decree on ambient air quality and the Rules on the assessment of ambient air quality define limit air pollution values for individual pollutants in order to protect human health and the environment. The limit value for particulates (PM10) defines an annual average PM10 value at 40 μg/m3 and a daily mean PM10 concentration at 50 μg/m3 that is not to be exceeded more than 35 times per year. The annual limit value of 40 μg/m3 has been in force since 1 January 2010. In most EU cities, mean annual concentrations of particulates and NO2 exceed the limit values. According to NOx projections for 2011, the situation will not improve. Emissions from transport are seen as the main cause of these problems.
In many places in Slovenia, air quality fails to meet standards prescribed by legislation. The data on ambient air pollution with NO2 in the period 2002–2014 shows rather stable concentrations of this pollutant in the air. Nevertheless, there is a considerable variation in measured values between areas exposed to a direct (traffic stations) and indirect (background stations) burden of traffic. In this period, average maximum concentrations at traffic stations greatly exceeded the limit values prescribed for the protection of human health. In the period 2004–2008, air pollution with NO2 at traffic stations slightly increased, exceeding the limit values constantly. Since 2008, the values in these locations have been decreasing due to the reduced volume of transport. This is partly a consequence of recession and partly a result of restrictive transport policy measures in certain cities (especially Ljubljana). Air pollution at background stations decreased slightly after 2004. During the entire monitoring period, it was below the limit value.
According to the monitoring data, concentrations of PM10 particulates (as well as NO2 concentrations) were rather stable in the period 2001–2014. Differences between both types of monitoring stations were not so significant, but became more evident in the last five years of the monitoring period, when PM10 concentrations at background stations fell below the permitted annual concentration, while at roadside monitoring stations, this target has finally been met only in recent years. More significant differences between both types of stations in the period 2005–2014 were observed in the number of exceedances of the daily limit value for PM10 concentration (50 ug/m3), which is not to be exceeded more than 35 times per year. In this case, higher pollution values were measured at monitoring locations that measure the impact of traffic (traffic stations), although exceedances occurred at all other city stations as well (except in Nova Gorica and Koper). Over the course of the monitoring period, pollution with PM10 decreased at both types of monitoring stations, while the number of exceedances stayed above the permitted level. The most problematic is the Ljubljana centre monitoring station (traffic station), where daily limit concentration was exceeded 107 times in 2012. Excessive pollution with PM10 particulates in cities is one of the most serious environmental problems in Slovenia, which is why the European Commission launched infringement proceeding against Slovenia before the EU Court of Justice in 2010 for failing to comply with environmental legislation.
The level of air pollution with NO2 and PM10 in Slovenia as well as in Europe is higher in areas with a higher volume of traffic, which is proven by the measurements carried out at traffic monitoring stations. A comparison between Slovenia and the EU shows that transport-related ambient air pollution in higher in Europe, where the air is much more polluted with NO2 and considerably less with PM10 particulates. In the period 2002–2008, NO2 concentrations constantly exceeded the annual limit value, while in the case of PM10 concentrations, only average maximum values measured at roadside monitoring stations were exceeded, which, however, have since fallen below the limit value after 2008.


