[PR07] Exceedances of air quality objectives due to traffic

Key message

Data on air pollution in some parts of urban areas in Slovenia shown, that they are excessively contaminated with NO2 and PM10. The transport sector is one of the major contributors of these pollutants.
Excessive contamination of PM10 in Slovenian urban areas is one of the most pressing environmental problems. Slovenia has already been referred to the European Court of Justice for its levels of PM10.
Definition
Charts
Database of automatic readings from the national network for monitoring air quality (DMKZ). Hydrology and State of the Environment office, Slovenian Environment Agency, 2011.
| 2002 | 2003 | 2004 | 2005 | 2006 | 2007 | 2008 | 2009 | 2010 | ||
|---|---|---|---|---|---|---|---|---|---|---|
| Maribor (DMKZ) | µg/m3 | 36 | 37 | 31 | 33 | 39 | 37 | 34 | 32 | 34 |
| Ljubljana center (OMS Ljubljana) | µg/m3 | 50 | 59 | 59 | 59 | 70 | 66 | 71 | 55 | 63 |
| Celje (EIS Celje) | µg/m3 | 30 | 22 | 36 | 40 | 67 | 29 | np | np | np |
| urban station - mean | µg/m3 | 39 | 39 | 42 | 44 | 59 | 44 | 53 | 44 | 46 |
| urban station - maximum | µg/m3 | 50 | 59 | 59 | 59 | 70 | 66 | 71 | 55 | 63 |
| Ljubljana Bežigrad (DMKZ) | µg/m3 | 29 | 32 | 29 | 27 | 29 | 28 | 29 | 31 | 35 |
| Celje (DMKZ) | µg/m3 | 24 | 27 | 24 | 26 | 28 | 23 | 21 | 22 | 26 |
| background station - mean | µg/m3 | 27 | 30 | 27 | 27 | 29 | 26 | 25 | 27 | 31 |
| background station - maximum | µg/m3 | 29 | 32 | 29 | 27 | 29 | 28 | 29 | 31 | 35 |
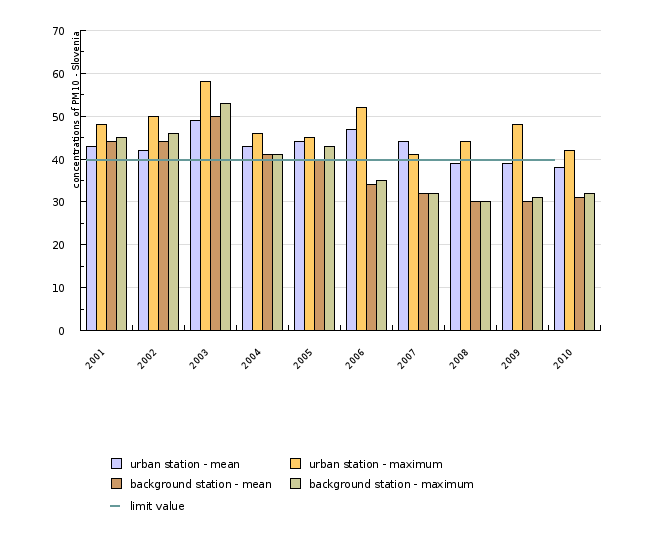
Database of automatic readings from the national network for monitoring air quality (DMKZ). Hydrology and State of the Environment office, Slovenian Environment Agency, 2011.
| 2001 | 2002 | 2003 | 2004 | 2005 | 2006 | 2007 | 2008 | 2009 | 2010 | ||
|---|---|---|---|---|---|---|---|---|---|---|---|
| Maribor (DMKZ) | µg/m3 | 48 | 50 | 58 | 48 | 43 | 43 | 40 | 34 | 30 | 33 |
| Celje (EIS Celje) | µg/m3 | 37 | 34 | 39 | 40 | 45 | 47 | 41 | np | np | np |
| Ljubljana center (OMS Ljubljana) | µg/m3 | np | np | np | no | np | 52 | 51 | 43 | 48 | 42 |
| urban station - mean | µg/m3 | 43 | 42 | 49 | 43 | 44 | 47 | 44 | 39 | 39 | 38 |
| urban station - maximum | µg/m3 | 48 | 50 | 58 | 46 | 45 | 52 | 41 | 44 | 48 | 42 |
| Ljubljana Bežigrad (DMKZ) | µg/m3 | 43 | 42 | 46 | 41 | 37 | 33 | 32 | 30 | 29 | 30 |
| Celje (DMKZ) | µg/m3 | 45 | 46 | 53 | 41 | 43 | 35 | 32 | 30 | 31 | 32 |
| background station - mean | µg/m3 | 44 | 44 | 50 | 41 | 40 | 34 | 32 | 30 | 30 | 31 |
| background station - maximum | µg/m3 | 45 | 46 | 53 | 41 | 43 | 35 | 32 | 30 | 31 | 32 |
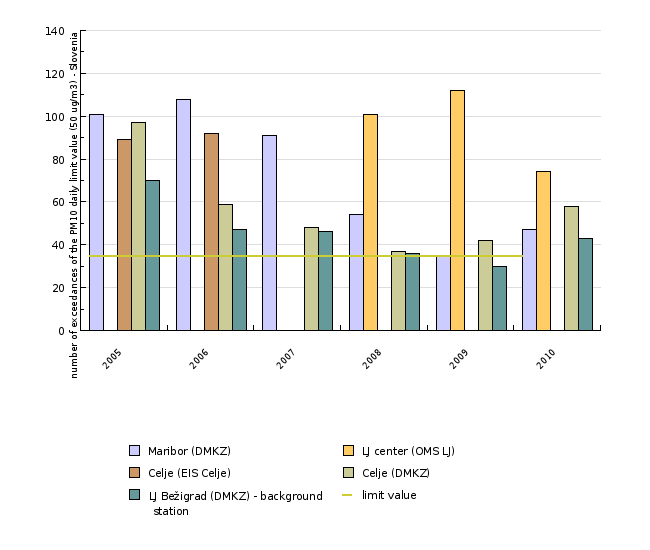
Database of automatic readings from the national network for monitoring air quality (DMKZ). Hydrology and State of the Environment office, Slovenian Environment Agency, 2011.
| 2005 | 2006 | 2007 | 2008 | 2009 | 2010 | ||
|---|---|---|---|---|---|---|---|
| Maribor (DMKZ) | number | 101 | 108 | 91 | 54 | 35 | 47 |
| LJ center (OMS LJ) | number | 101 | 112 | 74 | |||
| Celje (EIS Celje) | number | 89 | 92 | ||||
| Celje (DMKZ) | number | 97 | 59 | 48 | 37 | 42 | 58 |
| LJ Bežigrad (DMKZ) - background station |
number | 70 | 47 | 46 | 36 | 30 | 43 |
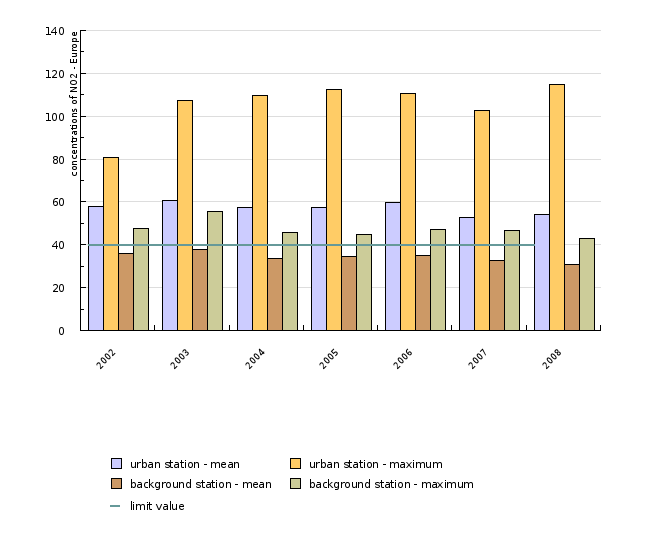
EEA, Exceedances of air quality objectives due to traffic, 2011
| 2002 | 2003 | 2004 | 2005 | 2006 | 2007 | 2008 | ||
|---|---|---|---|---|---|---|---|---|
| urban station - mean | µg/m3 | 58 | 60.7 | 57.3 | 57.5 | 59.7 | 52.9 | 54 |
| urban station - maximum | µg/m3 | 80.6 | 107.2 | 109.7 | 112.4 | 110.7 | 102.7 | 115 |
| background station - mean | µg/m3 | 36 | 37.7 | 33.6 | 34.3 | 34.9 | 32.8 | 31 |
| background station - maximum | µg/m3 | 47.7 | 55.7 | 45.7 | 44.8 | 47.1 | 46.4 | 43 |
EEA, Exceedances of air quality objectives due to traffic,2011
| 2002 | 2003 | 2004 | 2005 | 2006 | 2007 | 2008 | ||
|---|---|---|---|---|---|---|---|---|
| urban station - mean | µg/m3 | 37.8 | 36.8 | 34.9 | 36.1 | 39.2 | 33.5 | 29.7 |
| urban station - maximum | µg/m3 | 50.5 | 48.3 | 43.3 | 43.4 | 46.9 | 44.7 | 39.1 |
| background station - mean | µg/m3 | 25.2 | 29.1 | 27.6 | 26.1 | 25.2 | 20.4 | 18.6 |
| background station - maximum | µg/m3 | 41.2 | 45.7 | 39.2 | 37.6 | 32.9 | 27.6 | 23.9 |


