[PR02] Freight transport demand

Key message

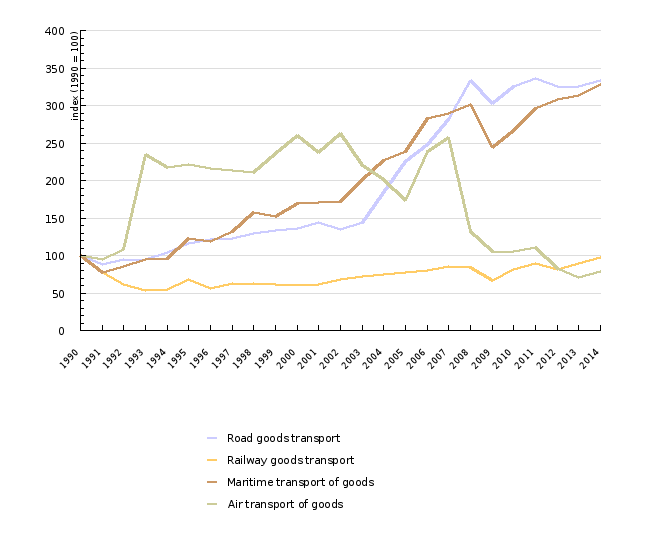
Road transport has increased dramatically after Slovenia joined the EU, as the volume of tonne-kilometers of Slovenian transport in the period 2004-2011 increased by 83%. Its growth in Slovenia has continued despite the economic problems in the EU, except in aviation transport. Particularly alarming is the growth of road freight transit through Slovenia.
Definition
Charts
Statistical Office of the Republic of Slovenia: Statistical Yearbook of the Republic of Slovenia 1996-2012 and SI-STAT Data portal, 2013.
| 1990 | 1991 | 1992 | 1993 | 1994 | 1995 | 1996 | 1997 | 1998 | 1999 | ||
|---|---|---|---|---|---|---|---|---|---|---|---|
| Road goods transport | index (1990=100) | 100 | 88.4 | 94.9 | 94 | 104.6 | 116.3 | 121.7 | 123.1 | 129.4 | 133 |
| Railway goods transport | index (1990=100) | 100 | 77.1 | 61.1 | 53.7 | 54.6 | 68.4 | 55.7 | 62.3 | 62.6 | 61.2 |
| Maritime transport of goods | index (1990=100) | 100 | 77.6 | 84.8 | 94.1 | 95.8 | 122.4 | 119.3 | 132.6 | 157 | 152 |
| Air transport of goods | index (1990=100) | 100 | 95.2 | 107.4 | 234.7 | 217 | 220.9 | 215.7 | 213.4 | 211.1 | 236.3 |
| Road goods transport | tkm (mio) | 4887 | 4322 | 4639 | 4596 | 5114 | 5683 | 5948 | 6015 | 6324 | 6500 |
| Railway goods transport | net tkm | 4209 | 3246 | 2573 | 2262 | 2298 | 2881 | 2343 | 2623 | 2635 | 2576 |
| Maritime transport of goods | received and shipped goods (1000 t) | 5484 | 4253 | 4652 | 5159 | 5252 | 6712 | 6543 | 7270 | 8608 | 8337 |
| Air transport of goods | prepeljano blago (t) | 1755 | 1670 | 1885 | 4119 | 3808 | 3877 | 3785 | 3745 | 3705 | 4147 |
| 2000 | 2001 | 2002 | 2003 | 2004 | 2005 | 2006 | 2007 | 2008 | 2009 | ||
| Road goods transport | index (1990=100) | 136.2 | 144 | 135.2 | 144.1 | 184.3 | 225.7 | 247.8 | 281 | 332.7 | 302.1 |
| Railway goods transport | index (1990=100) | 61.8 | 61.9 | 67.5 | 71.7 | 74.8 | 77.1 | 80.1 | 85.6 | 83.6 | 66.9 |
| Maritime transport of goods | index (1990=100) | 170 | 170.6 | 172 | 201.2 | 226.2 | 238.3 | 282.3 | 289.1 | 301.9 | 243.5 |
| Air transport of goods | index (1990=100) | 259.6 | 237.8 | 263.2 | 219.6 | 201.1 | 172.9 | 238.9 | 257 | 132.3 | 105.6 |
| Road goods transport | tkm (mio) | 6654 | 7035 | 6609 | 7040 | 9007 | 11032 | 12112 | 13734 | 16261 | 14762 |
| Railway goods transport | net tkm | 2600 | 2605 | 2839 | 3018 | 3149 | 3245 | 3373 | 3603 | 3520 | 2817 |
| Maritime transport of goods | received and shipped goods (1000 t) | 9322 | 9354 | 9431 | 11036 | 12403 | 13066 | 15483 | 15853 | 16554 | 13356 |
| Air transport of goods | prepeljano blago (t) | 4556 | 4173 | 4620 | 3854 | 3530 | 3035 | 4193 | 4510 | 2321 | 1854 |
| 2010 | 2011 | 2012 | 2013 | 2014 | |||||||
| Road goods transport | index (1990=100) | 326 | 336.4 | 325 | 325 | 333 | |||||
| Railway goods transport | index (1990=100) | 81.3 | 89.1 | 82 | 90 | 97 | |||||
| Maritime transport of goods | index (1990=100) | 266.1 | 295.4 | 308.3 | 313.3 | 328.4 | |||||
| Air transport of goods | index (1990=100) | 105.5 | 110.4 | 83 | 71 | 79 | |||||
| Road goods transport | tkm (mio) | 15931 | 16439 | 15888 | 15905 | 16273 | |||||
| Railway goods transport | net tkm | 3421 | 3752 | 3470 | 3799 | 4110 | |||||
| Maritime transport of goods | received and shipped goods (1000 t) | 14591 | 16198 | 16907 | 17184 | 18012 | |||||
| Air transport of goods | prepeljano blago (t) | 1851 | 1937 | 1474 | 1257 | 1392 |
EUROSTAT, Modal split of freight transport, 2013.
| 2000 | 2001 | 2002 | 2003 | 2004 | 2005 | 2006 | 2007 | 2008 | 2009 | ||
|---|---|---|---|---|---|---|---|---|---|---|---|
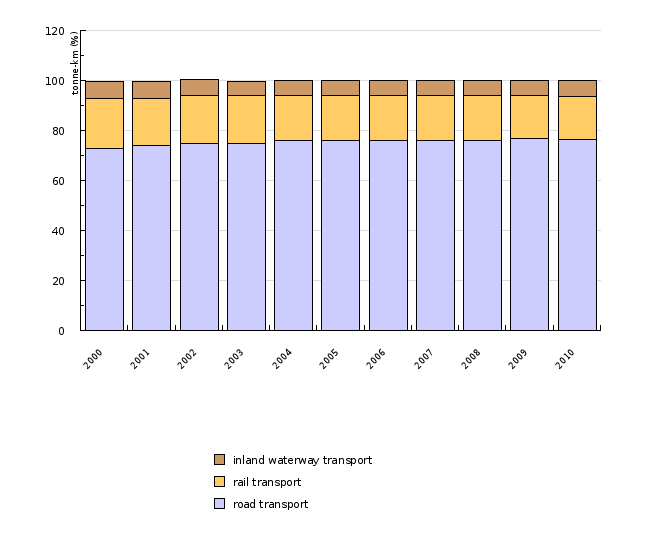
| road transport | % | 73 | 74 | 75 | 75 | 76 | 76 | 76 | 76 | 76 | 77 |
| rail transport | % | 20 | 19 | 19 | 19 | 18 | 18 | 18 | 18 | 18 | 17 |
| inland waterway transport | % | 6.6 | 6.5 | 6.3 | 5.8 | 5.9 | 6 | 6 | 6 | 6 | 6 |
| 2010 | |||||||||||
| road transport | % | 76.4 | |||||||||
| rail transport | % | 17.1 | |||||||||
| inland waterway transport | % | 6.5 |
EUROSTAT, Modal split of freight transport, 2013.
| Latvia | Estonia | Romania | Austria | Lithuania | Sweden | The Netherlands | Germany | Bulgaria | Belgium | ||
|---|---|---|---|---|---|---|---|---|---|---|---|
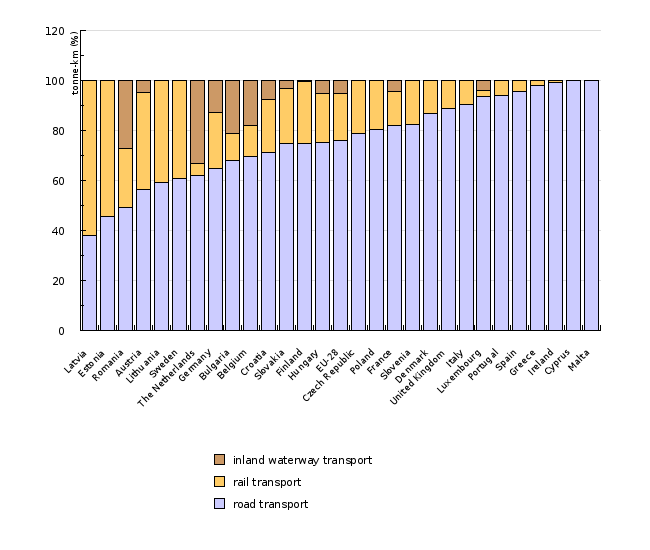
| road transport | % | 38.1 | 45.8 | 49.2 | 56.3 | 59.1 | 60.7 | 62.1 | 64.9 | 68.1 | 69.5 |
| rail transport | % | 61.9 | 54.2 | 23.5 | 39 | 40.9 | 39.3 | 4.9 | 22.2 | 10.7 | 12.5 |
| inland waterway transport | % | x | x | 27.2 | 4.7 | 0 | x | 33 | 12.9 | 21.2 | 18 |
| Croatia | Slovakia | Finland | Hungary | EU-28 | Czech Republic | Poland | France | Slovenia | Denmark | ||
| road transport | % | 71.2 | 74.8 | 75 | 75.1 | 76 | 79 | 80.6 | 82.2 | 82.3 | 87 |
| rail transport | % | 21.2 | 22 | 24.8 | 19.6 | 19 | 21 | 19.4 | 13.5 | 17.7 | 13 |
| inland waterway transport | % | 7.6 | 3.2 | 0.2 | 5.3 | 5 | x | 0.1 | 4.3 | x | x |
| United Kingdom | Italy | Luxembourg | Portugal | Spain | Greece | Ireland | Cyprus | Malta | |||
| road transport | % | 88.7 | 90.4 | 93.5 | 93.9 | 95.8 | 98 | 99.2 | 100 | 100 | |
| rail transport | % | 11.2 | 9.6 | 2.7 | 6.1 | 4.2 | 2 | 0.8 | x | x | |
| inland waterway transport | % | 0.1 | 0.1 | 3.9 | x | x | x | x | x | x |
European Commission, Statistical pocketbook 2013, Performance of freight transport (tkm), 2013.
European Commission, Statistical pocketbook 2015, Performance of freight transport (tkm), 2015; Eurostat, Annual national accounts; SISTAT, Ekonomsko področje, Bruto domači proizvod
| 2003 | 2004 | 2005 | 2006 | 2007 | 2008 | 2009 | 2010 | 2011 | 2012 | ||
|---|---|---|---|---|---|---|---|---|---|---|---|
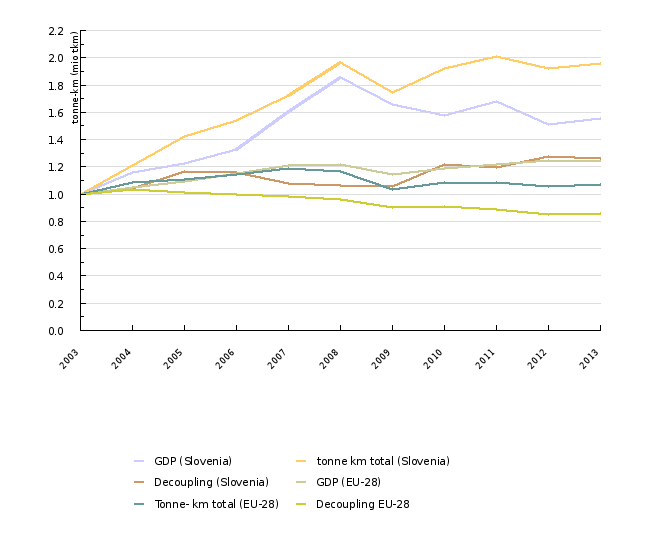
| GDP (Slovenia) | index | 1 | 1.2 | 1.2 | 1.3 | 1.6 | 1.9 | 1.7 | 1.6 | 1.7 | 1.5 |
| tonne km total (Slovenia) | index | 1 | 1.2 | 1.4 | 1.5 | 1.7 | 2 | 1.7 | 1.9 | 2 | 1.9 |
| Decoupling (Slovenia) | / | 1 | 1 | 1.2 | 1.2 | 1.1 | 1.1 | 1.1 | 1.2 | 1.2 | 1.3 |
| GDP (EU-28) | index | 1 | 1 | 1.1 | 1.2 | 1.2 | 1.2 | 1.1 | 1.2 | 1.2 | 1.2 |
| Tonne- km total (EU-28) | index | 1 | 1.1 | 1.1 | 1.1 | 1.2 | 1.2 | 1 | 1.1 | 1.1 | 1.1 |
| Decoupling EU-28 | / | 1 | 1 | 1 | 1 | 1 | 1 | 0.9 | 0.9 | 0.9 | 0.9 |
| 2013 | |||||||||||
| GDP (Slovenia) | index | 1.6 | |||||||||
| tonne km total (Slovenia) | index | 2 | |||||||||
| Decoupling (Slovenia) | / | 1.3 | |||||||||
| GDP (EU-28) | index | 1.2 | |||||||||
| Tonne- km total (EU-28) | index | 1.1 | |||||||||
| Decoupling EU-28 | / | 0.9 |


