[EN09] Emissions of air pollutants from energy sources

Key message

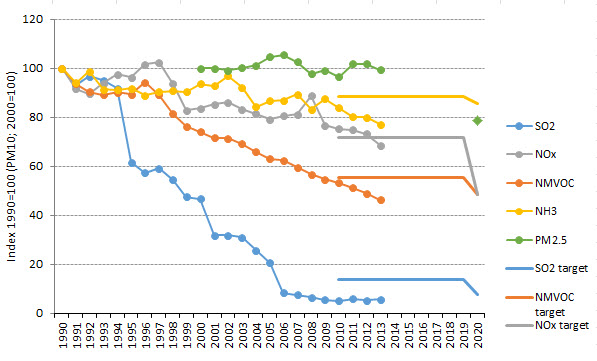
In the period 1990–2013, the most notable reduction was recorded in SO2 emissions, followed by NMVOC emissions, while the slightest reduction was recorded in NOx, NH3 and PM2.5 emissions. The overall reduction in emissions resulted in the reduction of acidifying substance emissions, ozone precursors and particulate matter. NOx is the only substance present in substantial concentrations in those three groups. The main source of NOx emissions is transport, followed by electricity and heat production.
In 2013, SO2, NOx, NMVOC and NH3 emissions were below the target values. To achieve the goals set for 2020, it will be necessary to strengthen the implementation of measures for the reduction of NOx and PM2.5 emissions.
Definition
The indicator presents past emissions of air pollutants from energy sources – individual substances and total emissions of ozone precursors, acidifying substances and particulate matter.
An ozone precursor is a substance that contributes to the formation of tropospheric ozone. Ozone precursors include nitrogen oxides (NOx), carbon monoxide (CO), methane (CH4) and non-methane volatile organic compounds (NMVOC). Tropospheric (ground-level) ozone has a harmful effect on human health and ecosystems. High concentrations of tropospheric ozone affect the human respiratory system, particularly the lungs, while, in ecosystems, they contribute to reduced crops, cause harm to foliage and decrease disease resistance. Ozone also causes damage to plastic and rubber.
Acidifying substances include sulphur dioxide (SO2), nitrogen oxides (NOx) and ammonia (NH3). Acidification has a harmful effect on ecosystems, buildings and materials (corrosion). NOx and NH3 also cause excessive accumulation of nitrogen in soils and water bodies (eutrophication). Particulate matter is divided into primary PM10 particulate matter (containing particles with a diameter of 10 μm or less), which is directly released into the atmosphere, and secondary particulate matter or PM10 precursors (part of NOx, SO2 and NH3 emissions that are, as a result photochemical reactions, transformed into particulate matter with a diameter of 10 μm or less). PM2.5 is particulate matter containing particles with a diameter of 2.5 μm or less, which is directly released into the atmosphere. Inhaling particulate matter may cause increased frequency and severity of respiratory disease, which increases the risk of premature death. Smaller particles, which can penetrate deeper into the lungs, are especially harmful.
Charts
National Emission Database, Slovenian Environment Agency, 2015
| 1990 | 1991 | 1992 | 1993 | 1994 | 1995 | 1996 | 1997 | 1998 | 1999 | ||
|---|---|---|---|---|---|---|---|---|---|---|---|
| SO2 | index (1990 = 100) | 100 | 92.891 | 96.533 | 94.968 | 91.738 | 61.468 | 57.207 | 59.001 | 54.484 | 47.539 |
| NOx | index (1990 = 100) | 100 | 91.512 | 89.514 | 93.797 | 97.406 | 96.206 | 101.575 | 102.254 | 93.643 | 82.706 |
| NMVOC | index (1990 = 100) | 100 | 93.59 | 90.376 | 89.029 | 90.112 | 89.382 | 94.19 | 89.066 | 81.364 | 76.226 |
| NH3 | index (1990 = 100) | 100 | 94.005 | 98.744 | 91.362 | 91.044 | 91.823 | 88.917 | 90.273 | 90.794 | 90.308 |
| PM2.5 | index (2000 = 100) | ||||||||||
| SO2 target | index (1990 = 100) | ||||||||||
| NOx target | index (1990 = 100) | ||||||||||
| NMVOC target | index (1990 = 100) | ||||||||||
| NH3 target | index (1990 = 100) | ||||||||||
| PM2.5 target | index (2000 = 100) | ||||||||||
| 2000 | 2001 | 2002 | 2003 | 2004 | 2005 | 2006 | 2007 | 2008 | 2009 | ||
| SO2 | index (1990 = 100) | 46.625 | 31.727 | 31.797 | 30.99 | 25.669 | 20.518 | 8.304 | 7.37 | 6.499 | 5.33 |
| NOx | index (1990 = 100) | 83.671 | 85.132 | 86.028 | 83.154 | 81.27 | 79.037 | 80.427 | 81.12 | 88.595 | 76.6 |
| NMVOC | index (1990 = 100) | 74.074 | 71.536 | 71.356 | 69.066 | 65.788 | 62.96 | 62.428 | 59.554 | 56.644 | 54.664 |
| NH3 | index (1990 = 100) | 93.637 | 92.772 | 96.881 | 92.11 | 84.265 | 86.571 | 86.937 | 89.298 | 83.069 | 87.357 |
| PM2.5 | index (2000 = 100) | 100 | 99.838 | 99.147 | 100.151 | 101.084 | 104.502 | 105.349 | 102.571 | 97.604 | 98.998 |
| SO2 target | index (1990 = 100) | ||||||||||
| NOx target | index (1990 = 100) | ||||||||||
| NMVOC target | index (1990 = 100) | ||||||||||
| NH3 target | index (1990 = 100) | ||||||||||
| PM2.5 target | index (2000 = 100) | ||||||||||
| 2010 | 2011 | 2012 | 2013 | 2014 | 2015 | 2016 | 2017 | 2018 | 2019 | ||
| SO2 | index (1990 = 100) | 4.957 | 5.836 | 5.293 | 5.683 | ||||||
| NOx | index (1990 = 100) | 75.186 | 74.807 | 73.201 | 68.423 | ||||||
| NMVOC | index (1990 = 100) | 53.186 | 51.201 | 48.981 | 46.162 | ||||||
| NH3 | index (1990 = 100) | 83.878 | 80.068 | 79.926 | 77.062 | ||||||
| PM2.5 | index (2000 = 100) | 96.376 | 101.668 | 101.653 | 99.364 | ||||||
| SO2 target | index (1990 = 100) | 13.586 | 13.586 | 13.586 | 13.586 | 13.586 | 13.586 | 13.586 | 13.586 | 13.586 | 13.586 |
| NOx target | index (1990 = 100) | 71.784 | 71.784 | 71.784 | 71.784 | 71.784 | 71.784 | 71.784 | 71.784 | 71.784 | 71.784 |
| NMVOC target | index (1990 = 100) | 55.411 | 55.411 | 55.411 | 55.411 | 55.411 | 55.411 | 55.411 | 55.411 | 55.411 | 55.411 |
| NH3 target | index (1990 = 100) | 88.32 | 88.32 | 88.32 | 88.32 | 88.32 | 88.32 | 88.32 | 88.32 | 88.32 | 88.32 |
| PM2.5 target | index (2000 = 100) | ||||||||||
| 2020 | |||||||||||
| SO2 | index (1990 = 100) | ||||||||||
| NOx | index (1990 = 100) | ||||||||||
| NMVOC | index (1990 = 100) | ||||||||||
| NH3 | index (1990 = 100) | ||||||||||
| PM2.5 | index (2000 = 100) | ||||||||||
| SO2 target | index (1990 = 100) | 7.592 | |||||||||
| NOx target | index (1990 = 100) | 48.213 | |||||||||
| NMVOC target | index (1990 = 100) | 48.479 | |||||||||
| NH3 target | index (1990 = 100) | 85.706 | |||||||||
| PM2.5 target | index (2000 = 100) | 78.376 |
National Emission Database, Slovenian Environment Agency, 2015
| SO2 | NOx | NH3 | NMVOC | PM2.5 | ||
|---|---|---|---|---|---|---|
| Energy supply | kt | 7.36 | 9.31 | 0 | 4.21 | 0.15 |
| Industry | kt | 2.28 | 3.26 | 0 | 1.03 | 0.86 |
| Transport | kt | 0.06 | 25.89 | 0.44 | 5.3 | 1.5 |
| Wide use | kt | 0.51 | 2.91 | 0 | 7.67 | 8.99 |
| Nonenergy sectors | kt | 1.09 | 1.53 | 17.01 | 15.11 | 0.67 |
| TOTAL | kt | 11.29 | 42.89 | 17.45 | 33.32 | 12.16 |
National Emission Database, Slovenian Environment Agency, 2015
| 1990 | 1991 | 1992 | 1993 | 1994 | 1995 | 1996 | 1997 | 1998 | 1999 | ||
|---|---|---|---|---|---|---|---|---|---|---|---|
| Ozone precursors | Index (2000 = 100) | 131.6 | 123 | 117.9 | 120.4 | 122.3 | 121.2 | 127.5 | 123 | 111.5 | 100.9 |
| Acidifying substances | Index (2000 = 100) | 168.6 | 156.5 | 161.5 | 158.9 | 155.9 | 120.2 | 115.9 | 118.5 | 111.1 | 100 |
| Particulate matter | Index (2000 = 100) | ||||||||||
| Ozone precursors | [kt] | 187.2 | 175 | 167.8 | 171.2 | 174 | 172.5 | 181.4 | 175 | 158.6 | 143.6 |
| Acidifying substances | [kt] | 8.9 | 8.3 | 8.5 | 8.4 | 8.2 | 6.4 | 6.1 | 6.3 | 5.9 | 5.3 |
| Particulate matter | [kt] | ||||||||||
| 2000 | 2001 | 2002 | 2003 | 2004 | 2005 | 2006 | 2007 | 2008 | 2009 | ||
| Ozone precursors | Index (2000 = 100) | 100 | 99 | 99 | 96 | 92.4 | 89.4 | 89.1 | 87.3 | 89.6 | 81.8 |
| Acidifying substances | Index (2000 = 100) | 100 | 82.6 | 84 | 81.1 | 72.4 | 66.3 | 52.4 | 52.1 | 51.4 | 48 |
| Particulate matter | Index (2000 = 100) | 100 | 87.8 | 88.4 | 85.8 | 79.9 | 75.3 | 65.6 | 65 | 65.4 | 59.8 |
| Ozone precursors | [kt] | 142.3 | 140.8 | 140.8 | 136.6 | 131.4 | 127.2 | 126.7 | 124.3 | 127.4 | 116.4 |
| Acidifying substances | [kt] | 5.3 | 4.4 | 4.4 | 4.3 | 3.8 | 3.5 | 2.8 | 2.8 | 2.7 | 2.5 |
| Particulate matter | [kt] | 127 | 111.5 | 112.3 | 109 | 101.5 | 95.7 | 83.3 | 82.6 | 83.1 | 75.9 |
| 2010 | 2011 | 2012 | 2013 | ||||||||
| Ozone precursors | Index (2000 = 100) | 80 | 79.4 | 77.3 | 73 | ||||||
| Acidifying substances | Index (2000 = 100) | 46.4 | 46.3 | 45.3 | 43.8 | ||||||
| Particulate matter | Index (2000 = 100) | 58.1 | 58.9 | 57.6 | 55 | ||||||
| Ozone precursors | [kt] | 113.9 | 112.9 | 109.9 | 103.8 | ||||||
| Acidifying substances | [kt] | 2.4 | 2.4 | 2.4 | 2.3 | ||||||
| Particulate matter | [kt] | 73.9 | 74.8 | 73.2 | 69.9 |
National Emission Database, National Greenhouse Gas Emissions, Slovenian Environment Agency, 2015
| Acidifying | Ground-level ozone | Particulate matter | ||
|---|---|---|---|---|
| PM_10 - en | kt | 0 | 0 | 12.23 |
| PM_10 - non-en | kt | 0 | 0 | 2.62 |
| SO2 - en | kt | 0.32 | 0 | 5.51 |
| SO2 - non-en | kt | 0.03 | 0 | 0.59 |
| NOx - en | kt | 0.9 | 50.47 | 36.4 |
| NOx - non-en | kt | 0.03 | 1.86 | 1.34 |
| NH3 - en | kt | 0.03 | 0 | 0.28 |
| NH3 - non-en | kt | 1 | 0 | 10.89 |
| NMVOC - en | kt | 0 | 18.21 | 0 |
| NMVOC - non-en | kt | 0 | 15.11 | 0 |
| CO - en | kt | 0 | 16.34 | 0 |
| CO - non-en | kt | 0 | 0.76 | 0 |
| CH4 - en | kt | 0 | 0.19 | 0 |
| CH4 - non-en | kt | 0 | 0.9 | 0 |
| TOTAL | kt | 2.31 | 103.84 | 69.86 |
| PM_10 - en | % | 17.51 | ||
| PM_10 - non-en | % | 3.75 | ||
| SO2 - en | % | 13.8 | 7.89 | |
| SO2 - non-en | % | 1.47 | 0.84 | |
| NOx - en | % | 38.9 | 48.6 | 52.11 |
| NOx - ne-en | % | 1.43 | 1.79 | 1.92 |
| NH3 - en | % | 1.13 | 0.41 | |
| NH3 - non-en | % | 43.28 | 15.58 | |
| NMVOC - en | % | 17.54 | ||
| NMVOC - non-en | % | 14.55 | ||
| CO - en | % | 15.73 | ||
| CO - ne-en | % | 0.74 | ||
| CH4 - en | % | 0.18 | ||
| CH4 - non-en | % | 0.87 | ||
| TOTAL | % | 100 | 100 | 100 |
National Emission Database, National Greenhouse Gas Emissions Database, Slovenian Environment Agency, 2015
| Acidifying | Ground-level ozone | Particulate matter | ||
|---|---|---|---|---|
| Energy supply | kt | 0.43 | 15.93 | 12.44 |
| Industry | kt | 0.14 | 5.91 | 5 |
| Transport | kt | 0.59 | 40.52 | 24.94 |
| Wide use | kt | 0.08 | 22.84 | 12.06 |
| Non-energy sector | kt | 1.07 | 18.64 | 15.43 |
| TOTAL | kt | 2.31 | 103.84 | 69.86 |
| TOTAL - ENERGY SECTOR | kt | 1.24 | 85.2 | 54.43 |
| Energy supply | % | 18.7 | 15.34 | 17.8 |
| Industry | % | 6.14 | 5.69 | 7.15 |
| Transport | % | 25.55 | 39.02 | 35.7 |
| Wide use | % | 3.43 | 22 | 17.26 |
| Non-energy sector | % | 46.18 | 17.95 | 22.09 |
| TOTAL | % | 100 | 100 | 100 |
| TOTAL - ENERGY SECTOR | % | 53.82 | 82.05 | 77.91 |
National Emission Database, National Greenhouse Gas Emission Database, Slovenian Environment Agency, 2015
| Acidifying | Ground-level ozone | Particulate matter | ||
|---|---|---|---|---|
| Energy supply | % | -84.8 | -30.5 | -78.1 |
| Industry | % | -32.4 | -29.2 | -25.8 |
| Transport | % | -17.4 | -37.6 | -9.8 |
| Wide use | % | -64.2 | 12.2 | -12 |
| Non-energy sector | % | -18 | -27.6 | -30 |
| TOTAL | % | -56.2 | -27 | -45 |
| TOTAL - ENERGY SECTOR | % | -68.8 | -26.9 | -48.1 |
| Energy supply | kt | 2.8 | 22.9 | 56.9 |
| Industry | kt | 0.2 | 8.4 | 6.7 |
| Transport | kt | 0.7 | 64.9 | 27.6 |
| Wide use | kt | 0.2 | 20.4 | 13.7 |
| Non-energy sector | kt | 1.3 | 25.7 | 22.1 |
| TOTAL | kt | 5.3 | 142.3 | 127 |
| TOTAL - ENERGY SECTOR | kt | 4 | 116.5 | 105 |
| Energy supply | kt | 0.4 | 15.9 | 12.4 |
| Industry | kt | 0.1 | 5.9 | 5 |
| Transport | kt | 0.6 | 40.5 | 24.9 |
| Wide use | kt | 0.1 | 22.8 | 12.1 |
| Non-energy sector | kt | 1.1 | 18.6 | 15.4 |
| TOTAL | kt | 2.3 | 103.8 | 69.9 |
| TOTAL - ENERGY SECTOR | kt | 1.2 | 85.2 | 54.4 |
Goals
From 2010 (inclusive) onwards, emissions of air pollutants may not exceed the following target values:
- SO2: 27,000 tonnes,
- NOx: 45,000 tonnes,
- NMVOC: 40,000 tonnes,
- NH3: 20,000 tonnes.
CH4 emissions are limited within the national goal for greenhouse gas emissions. The goal refers to emissions from sources not included in the EU Emissions Trading Scheme. Their increase in the period 2005–2020 may not exceed 4%.
A quantitative goal for CO and PM10 has not been set.
According to the revised Gothenburg Protocol, Slovenia is obliged to reduce emissions of SO2 by 63%, NOx by 39%, NH3 by 1%, NMVOC by 23% and PM2.5 by 25% until 2020 compared to 2005. A revision of Directive 2001/81/EC on national emission limits for certain air pollutants is also under way. The revised directive will set additional goals for emissions of SO2, NOx, NH3, NMVOC and PM2.5 for the years 2025 and 2030.
Comment
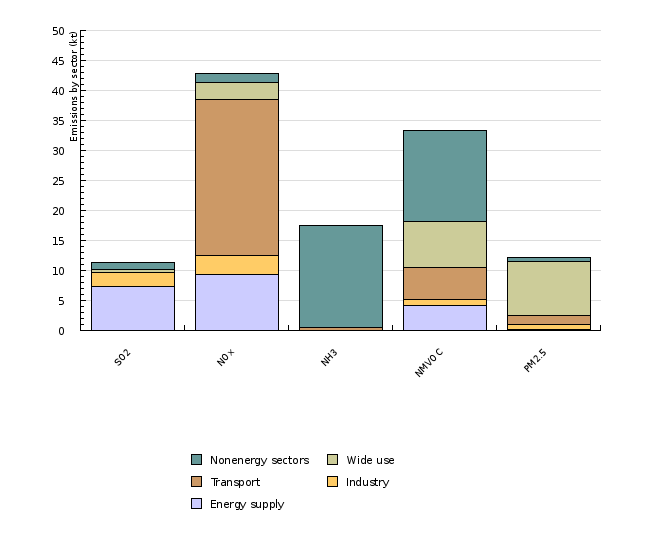
Emissions of all air pollutants from energy sources, except particulate matter, were reduced in the observed period. The greatest reductions were achieved in SO2 emissions due to the installation of desulphurisation systems on thermal power plants as well as a cement plant. This was also due to the increased use of fuels with lower sulphur content. Emissions of SO2 in 2013 were 94% below the 1990 levels. Records indicate that emissions increased by 7% in 2013 with regard to the preceding year. In 2013, energy sources contributed 90% of total SO2 emissions, with the main sources being energy supply (generation of electricity and heat), with 65%, and industry, with 20% of total emissions.
Emissions of non-methane volatile organic compounds (NMVOC) were reduced substantially as well. In 2013, they were 54% below the 1990 levels. This reduction is largely a consequence of the use of catalytic converters in motor vehicles for exhaust gas purification and a substantial increase in the share of diesel in the total consumption of motor fuels. A reduction in industry due to the fuel switch is also significant. In 2013, emissions were reduced by 6%, particularly due to the decrease in coal production (fugitive emissions) and reduced gasoline consumption in transport. In 2013, the share of energy sources in total NMVOC emissions was 55%. The main energy source was fuel combustion in households, the service sector, agriculture and forestry (due to high emissions in wood combustion in old, inefficient wood-burning boilers), contributing 25% to total NMVOC emissions.
In the observed period, NOx emissions were reduced by 32%. Here, too, the prevailing source of emissions was energy use. The main source, contributing 60% of total NOx emissions, was transport, followed by electricity production (22%). An important source of non-energy-related NOx emissions is agriculture. Compared to 2000, emissions were 18% lower. The reduction is largely a consequence of the introduction of European standards for NOx content in vehicle exhaust gases and the reduction of emissions from large combustion plants. Lower emissions from industry, which are largely a consequence of the economic crisis, significantly contributed to overall reduction of NOx emissions. In 2013, NOx emissions were reduced by 7% due to the decline of electricity production in thermal power plants and the reduced sales of motor fuels.
In 2013, the main source of ammonia (NH3) emissions was agriculture (97%), while the rest originated from transport. Emissions from transport had been increasing until 2000, while, since then, they have been decreasing due to improvements in catalytic converters. After 2000, NH3 emissions from transport were reduced by 31%.
In 2013, emissions of PM2.5 (particles with the diameter of 2.5 μm or less) from energy sources represented 95% of total PM2.5 emissions, with their share still increasing. By far the most important source (74%) is wood combustion in households, the service sector, agriculture and forestry, followed by transport (12%). Although the emissions of PM2.5 from energy sources in 2013 increased by 15% compared to 2000, they have decreased slightly in the last couple of years. The trend in recent years depends on the use of wood biomass in households, which is closely related to weather conditions in particular years and the dynamics of the replacement of fossil fuels with wood biomass in households and the service sector.
In 2013, carbon monoxide (CO) emissions, which almost entirely (96%) derive from energy sources, were substantially below the 1990 levels (reduction by 54%). This is the consequence of a rapid decrease in emissions from transport after 1996 (due to European standards), which was by far their largest source (68%). In 2013, total CO emissions amounted to 155.5 kt.
In 2013, total air pollutant emissions (from energy and non-energy sources) were as follows: SO2 11.3 kt (58.1% below the 2010–2019 target); NOx 42.9 kt (4.7% below the target); NMVOC 33.3 kt (16.7% below the 2010–2019 target) and NH3 17.5 kt (12.7% below the target). Therefore, all emissions in 2013 were below the target values.
In the revised Gothenburg protocol that was adopted in May 2012, targets have been set for the year 2020. Slovenia must reduce its emissions of SO2 by 63%, NOx by 39%, NMVOC by 23%, NH3 by 1% and PM2.5 by 25% (UNECE, 2012). The base year for all of the targets is 2005. In 2013, SO2 emissions has been reduced by 72%, NOx by 13%, NMVOC by 27%, NH3 by 11% and PM2.5 by 5%, all compared to 2005. Thus, the 2020 targets had already been met in 2013 for SO2, NMVOC and NH3 emissions, while emissions of NOx and PM2.5 are still being reduced, but at a pace that is much too slow to meet the targets.
Toward the end of 2013, the European Commission proposed a Clean Air Policy Package, which included the proposal of a new directive on national emission ceilings with proposed 2030 targets for Member States for air pollutant emissions. The proposed targets are very ambitious, e.g. reduction of NOx emissions by 71% compared to 2005 (European Commission, 2013).
Harmful effects of air pollutants on the environment can be divided into three groups: acidification and eutrophication indirectly affect human health by damaging ecosystems, while tropospheric ozone and particulate matter directly affect human health.
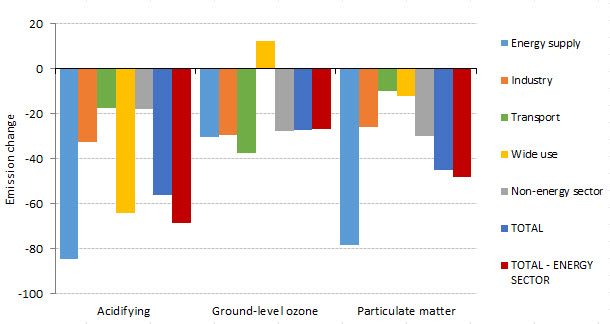
Emissions of acidifying substances decreased by 41% in the period 1990–2000, while emissions of ozone precursors decreased by 24% in the same period. The reduction of emissions further continued after 2000: in 2013, emissions of acidifying substances and ozone precursors were 56% and 27% below the levels in 2000, respectively. In the same period, emissions of (primary and secondary) particulate matter were reduced by 45%.
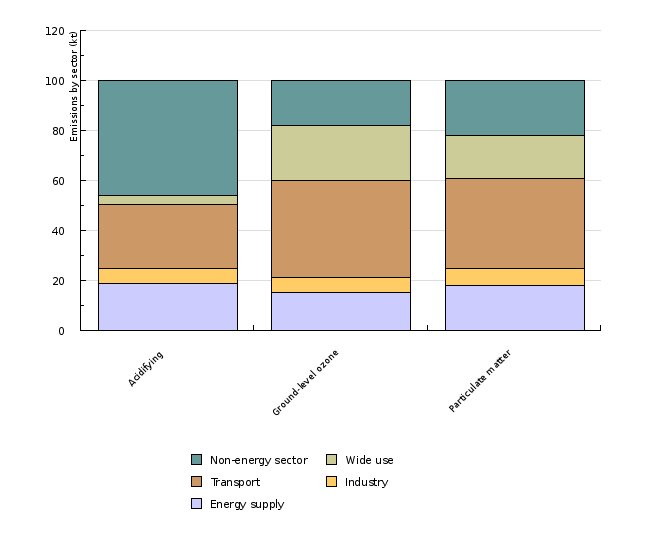
In 2013, ammonia (44.4%), NOx (40.3%) and SO2 (15.3%) were the largest contributors to total emissions of acidifying substances. Combined, energy sources contributed 54% of acidifying emissions. The most important energy source was transport, which represented 23% of total emissions, followed by energy supply (19%).
In 2013, NOx contributed slightly over 50% to total emissions of ozone precursors. It was followed by NMVOC (32%), CO (16%) and CH4 (1%). Combined, energy sources contributed 82% of ozone precursor emissions. The most important energy source was transport, which represented 34% of total emissions in 2013, followed by energy use in households, the service sector, agriculture and forestry (27%). In the period 2000–2013, emissions decreased by 27%, which is largely the consequence of reduced emissions in industry and transport.
The pollutants SO2, NOx and NH3, which are the source of secondary particulate matter, and PM10[1] contribute most significantly to emissions of particulate matter. Thus, the share of NOx in total emissions, as in ozone precursors, is by far the highest (54%). It is followed by PM10 (21%), NH3 (16%) and SO2 (9%). The largest contributor to total emissions of particulate matter is transport (36%). The decrease of emissions by 45% in the period 2000–2013 is largely the result of the reduction of SO2 emissions.
The common point of all groups of emissions as regards environmental impacts is NOx. Its share in emissions of ozone precursors and particulate matter is by far the highest, while it is only slightly behind NH3 when it comes to emissions of acidifying substances. Accordingly, it can be assumed that all of the above mentioned negative impacts on the environment can be very efficiently reduced by reducing NOx emissions.
--------
[1] Emissions of PM2.5 contribute as much as 81% to PM10 emissions, which means that only 19% of PM10 emissions are represented by dust particles with a diameter between 2.5 and 10 μm, while other emissions are represented by particles with a diameter of 2.5 μm or smaller. Their share in emissions from energy sources is even higher (94%).


