[PR11] Size of the vehicle fleet

Key message

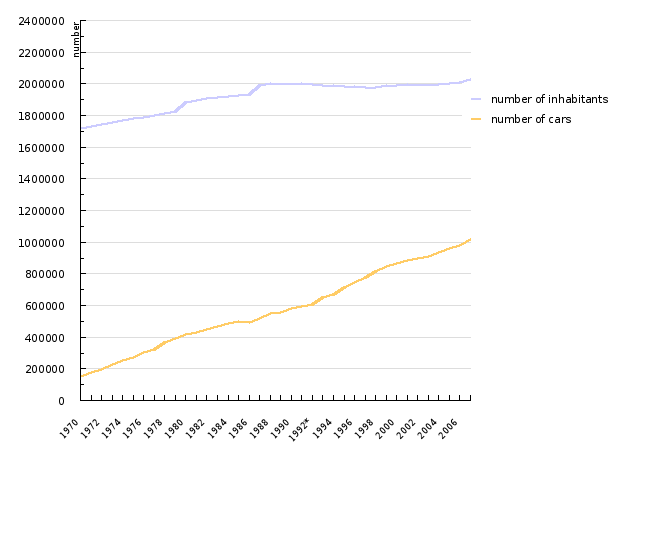
Passenger car ownership, which is closely connected to the use of passenger cars, has been strongly increasing in Slovenia – in the last 20 years it has almost doubled. The motorisation level is exceeding the situation in numerous economically more developed EU countries.
Definition
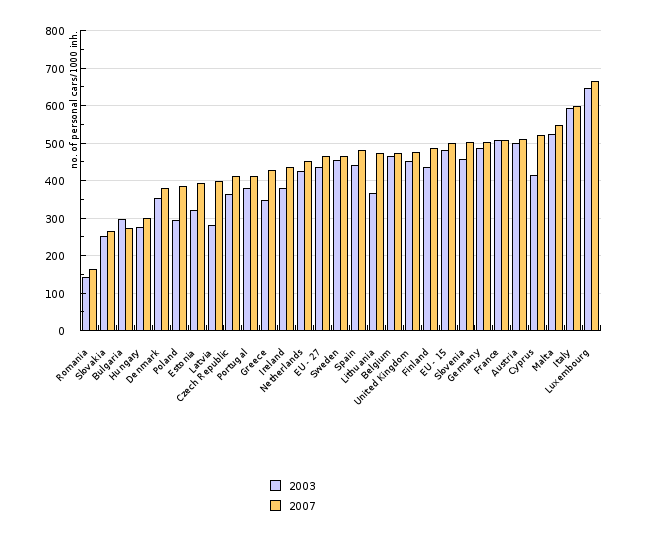
The passenger car ownership or motorisation level is regularly expressed as the number of passenger cars per 1000 residents (EEA, 2006). Road motor vehicle, other than a motorcycle, intended for the carriage of passengers and designed to seat no more than nine persons (including the driver). The number of passenger cars is defined as vehicles, which were registered in the country on a specific day and may use the roads open for public transport (SORS, 2004). The indicator shows the development of the motorisation level in the period 1970-2007 in Slovenia and the motorisation level for 2003 and 2007 in EU countries.
Charts
Research - Statistics, Council for Prevention and Road Safety, 2008, Statistical Yearbooks of the Republic of Slovenia 1993-2008, Statistical Office.
| 1970 | 1971 | 1972 | 1973 | 1974 | 1975 | 1976 | 1977 | 1978 | 1979 | ||
|---|---|---|---|---|---|---|---|---|---|---|---|
| number of inhabitants | število | 1717995 | 1729941 | 1741343 | 1753296 | 1766040 | 1778454 | 1786977 | 1799384 | 1810997 | 1824001 |
| number of cars | število | 150807 | 177284 | 198493 | 227981 | 251110 | 270732 | 306015 | 323554 | 366394 | 389192 |
| motorization level | število osebnih avtomobilov/1000 prebivalcev | 88 | 102 | 114 | 130 | 142 | 152 | 171 | 180 | 202 | 213 |
| 1980 | 1981 | 1982 | 1983 | 1984 | 1985 | 1986 | 1987 | 1988 | 1989 | ||
| number of inhabitants | število | 1884477 | 1895264 | 1904805 | 1912374 | 1918482 | 1925022 | 1930506 | 1989462 | 1999988 | 1999404 |
| number of cars | število | 416448 | 430132 | 448315 | 466003 | 489373 | 501538 | 490828 | 514850 | 548539 | 554592 |
| motorization level | število osebnih avtomobilov/1000 prebivalcev | 221 | 227 | 235 | 244 | 255 | 261 | 254 | 259 | 274 | 277 |
| 1990 | 1991 | 1992* | 1993 | 1994 | 1995 | 1996 | 1997 | 1998 | 1999 | ||
| number of inhabitants | število | 1999945 | 2001768 | 1994084 | 1989408 | 1989477 | 1983012 | 1981297 | 1979811 | 1978334 | 1987755 |
| number of cars | število | 578268 | 594289 | 606245 | 650344 | 668307 | 711364 | 743057 | 776798 | 811671 | 846109 |
| motorization level | število osebnih avtomobilov/1000 prebivalcev | 289 | 297 | 304 | 327 | 336 | 359 | 375 | 392 | 410 | 426 |
| 2000 | 2001 | 2002 | 2003 | 2004 | 2005 | 2006 | 2007 | ||||
| number of inhabitants | število | 1990094 | 1994026 | 1995033 | 1996433 | 1997590 | 2003358 | 2010377 | 2025866 | ||
| number of cars | število | 866096 | 881487 | 894521 | 910429 | 933941 | 960213 | 980261 | 1014122 | ||
| motorization level | število osebnih avtomobilov/1000 prebivalcev | 435 | 442 | 448 | 456 | 468 | 479 | 488 | 501 |
EU energy and transport in figures 2009, European Commission, Directorate-General for Energy and Transport, 2009.
| Romania | Slovakia | Bulgaria | Hungary | Denmark | Poland | Estonia | Latvia | Czech Republic | Portugal | ||
|---|---|---|---|---|---|---|---|---|---|---|---|
| 2003 | number per 1000 inh. | 142 | 252 | 296 | 275 | 351 | 294 | 321 | 280 | 363 | 379 |
| 2007 | number per 1000 inh. | 164 | 265 | 272 | 300 | 378 | 383 | 391 | 398 | 412 | 412 |
| Greece | Ireland | Netherlands | EU - 27 | Sweden | Spain | Lithuania | Belgium | United Kingdom | Finland | ||
| 2003 | number per 1000 inh. | 348 | 379 | 425 | 436 | 454 | 441 | 365 | 464 | 452 | 436 |
| 2007 | number per 1000 inh. | 428 | 434 | 451 | 464 | 464 | 481 | 472 | 473 | 476 | 485 |
| EU - 15 | Slovenia | Germany | France | Austria | Cyprus | Malta | Italy | Luxembourg | |||
| 2003 | number per 1000 inh. | 481 | 456 | 485 | 506 | 498 | 414 | 522 | 593 | 645 | |
| 2007 | number per 1000 inh. | 500 | 501 | 501 | 508 | 510 | 521 | 548 | 598 | 665 |
Goals
In Slovenia as well as in the EU and its Member States, objectives or target values regarding car ownership are not set. Countries consider car ownership in different ways – in the Scandinavian countries, where the public transport system provides the basic form of mobility, the passenger car is subject to a higher tax than in countries with a different transport policy.
Comment
The objectives regarding motorisation in the EU are, as a general rule, connected not only to the size of the vehicle fleet, but also to its structure – fuel consumption and emission standards of vehicles. However, certain Scandinavian countries consider a passenger car as a luxury product, since the basic form of mobility is provided by the public transport system. Therefore, the indicator indirectly also shows the transport policy of a country or region, since in some regions quality mobility is also successfully provided without passenger cars, which is why the vehicle fleet of these countries is significantly smaller.
Passenger car ownership is an indicator that is closely related to car use (and thus the volume of mobility) and - especially in urban areas - also to traffic congestion. The highest motorisation level is indicated normally in the most economically developed countries, such as Luxembourg and Italy, while in some of the wealthiest European countries (especially in Scandinavia) the motorisation level is much lower than the European average. The lowest motorisation level is indicated in countries that are economically least developed and have joined the EU in the recent period (for example, Romania, Slovakia and Bulgaria). In the period 2003-2007, the motorisation level increased in all of the EU-27 countries (excluding Bulgaria). The largest increase was recorded in some countries which entered the EU in 2004; this especially applies to the Baltic countries, Cyprus and Poland. Some of these countries have in this sector already overtaken the economically more developed countries (for example, Belgium, Sweden, Holland).
Slovenia, which has been strongly exceeding the average of all new Member States and EU candidates (excluding Malta and Cyprus), also belongs to the countries with the highest increase of passenger car ownership in the considered period. Despite the high level of growth in the past, the market of passenger cars in Slovenia does not show signs of saturation, since the number of registered vehicles has again increased in recent years after the extreme peak in 1999 (due to the introduction of VAT) and later decrease. Due to the transport policy of the state and urban areas, favourable to passenger cars, which is noticeable in accelerated investments in road infrastructure, non-competitive services of public transport and changes in the spatial planning of Slovenia (sub-urbanisation, based on the accessibility with passenger cars), a large share of the population decides to satisfy their needs of transport by passenger cars. In 2002, an average Slovenian household (2.8 members) had more than one car (in 2002, 1.25, and in 1991 0.94) (SORS, 2009a).
Methodology
Data for Slovenia:
Objectives summarised by: /
Source database or source:
- Research - statistics (7 August 2008)
- Statistical Yearbooks of the Republic of Slovenia 1993–2008 (20 July 2009)
Data administrator:
- Road Safety Council (SPVCP)
- Statistical Office of the Republic of Slovenia (SORS)
Date of acquisition for this indicator: 20 July 2009
Methodology and frequency of data collection for the indicator: Until 1991, the indicator considers the data of the Road Safety Council, the source of which is the Ministry of the Interior. Since 1991, the indicator is based on the data of the Statistical Office of the Republic of Slovenia, which publishes data in its regular annual publication the Statistical Yearbook of the Republic of Slovenia.
Data processing methodology: In the data of the Road Safety Council, a passenger car is defined as a motor vehicle, intended for the carriage of passengers and designed to seat no more than eight persons (including the driver) (Road Traffic Safety Act, 2004); the data of the Statistical Office of the Republic of Slovenia includes in the category of passenger cars also vehicles from the category of M1 vehicles (motor vehicles with at least four wheels, intended for the carriage of passengers and designed to seat no more than eight persons (including the driver)) without special personal vehicles (personal vehicles designed for special purposes and not for the transport of passengers; for example, fire-fighting vehicles, ambulances, funeral vehicles, etc.) (SORS, 2009b).
Information concerning data quality:
- Advantages and disadvantages(at data level): The indicator shows the data series for more decades, which is a rarity for this type of data; however, with a data break in 1992.
- Relevance, accuracy, robustness, uncertainty: The data is considered as fairly reliable and accurate.
Reliability of the indicator (archive data): The data refers to a longer time period.
Uncertainty of the indicator (scenarios/projections): Projections have not been prepared.
- Overall assessment (1 = no major comments, 3 = data to be considered with reservation): 1
Relevance: 1
Accuracy: 1
Completeness over time: 2 (data break in 1992)
Completeness over space: 1
Data for other countries:
Source database or source: EU Energy and Transport in figures 2009 (17 July 2009)
Data administrator: European Commission, Directorate-General for Energy and Transport
Date of acquisition for this indicator: 17 July 2009
Methodology and frequency of data collection for the indicator: The indicator for other European countries shows the data published by the European Commission, Directorate-General for Energy and Transport in the regular annual serial publication EU Energy and Transport in figures.
Data processing methodology: /
Geographical coverage: The EU-27 includes the EU Member States: Austria, Belgium, Bulgaria, the Czech Republic, Cyprus, Denmark, Estonia, Finland, France, Germany, Greece, Hungary, Ireland, Italy, Latvia, Lithuania, Luxembourg, Malta, the Netherlands, Poland, Portugal, Romania, Slovenia, Slovakia, Spain, Sweden and the United Kingdom. The EU-15 is composed of the older EU Member States: Austria, Belgium, Denmark, Finland, France, Germany, Greece, Ireland, Italy, Luxembourg, the Netherlands, Portugal, Spain, Sweden and the United Kingdom.
Data processing methodology:/
Information concerning data quality:
The publication does not contain any detailed information on the quality of the data.
- Advantages and disadvantages (at data level): /
- Relevance, accuracy, robustness, uncertainty: /
Reliability of the indicator (archive data): The data refers to a longer time period.
Uncertainty of the indicator (scenarios/projections): Projections have not been prepared.
- Overall assessment (1 = no major comments, 3 = data to be considered with reservation): /
Relevance: /
Accuracy: /
Completeness over time: /
Completeness over space: /
Other sources and literature:
- EEA, 2006. TERM 2006 32 – Size and composition of the vehicle fleet. Indicator fact sheet. European Environment Agency.
- SORS, 2004. Glossary for transport statistics. (UNECE, ECMT and EUROSTAT). Ljubljana, Statistical Office of the Republic of Slovenia (20 July 2009).
- SORS, 2009a. Data from the survey 2002 and survey 1991 (20 September 2009).
- SORS, 2009b. Registered road vehicles. Methodological explanations (20 September 2009).
- Road Traffic Safety Act. OG RS, no. 84/2004.


