[ZD18] Mortality due to respiratory diseases 
[ZD18] Mortality due to respiratory diseases

Key message

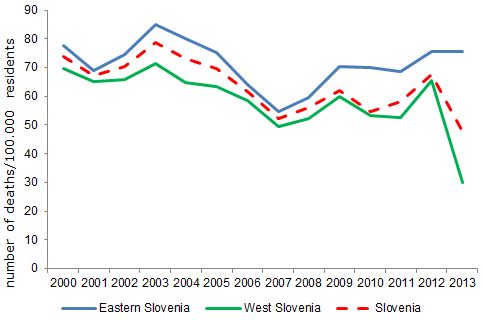
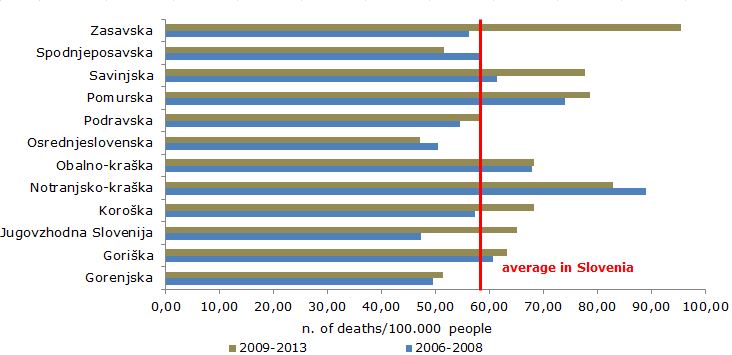
One of the main reasons of mortality in our country due to respiratory diseases is chronic pulmonary disease (COPD). The highest mortality due to respiratory diseases in Slovenia is in Zasavje region and the lowest in Central-Slovenian region (2009-2013). Mortality due to respiratory diseases is decreasing; in the year 1999 it was 74/100 000 of all population as in the year 2013 it was 64/ 100 000 of all population..
Definition
Charts
Figure ZD18-1: The mortality rate (number of deaths/ 100 000 inhabitants) for respiratory diseases in Slovenia, in the periode 1999-2013.
Sources:
NIJZ, 2000-2013, SURS, 2000-2013
| 1999 | 2000 | 2001 | 2002 | 2003 | 2004 | 2005 | 2006 | 2007 | 2008 | ||
|---|---|---|---|---|---|---|---|---|---|---|---|
| Eastern Slovenia | number of deaths/100.000 residents | 88.7 | 77.5 | 69 | 74.5 | 84.8 | 80.1 | 75.3 | 64.2 | 54.8 | 59.7 |
| West Slovenia | number of deaths/100.000 residents | 66.6 | 69.6 | 65 | 65.8 | 71.4 | 64.9 | 63.5 | 58.5 | 49.6 | 52.3 |
| Slovenia | number of deaths/100.000 residents | 78.6 | 73.9 | 67.2 | 70.5 | 78.6 | 73.1 | 69.8 | 61.6 | 52.4 | 56.2 |
| 2009 | 2010 | 2011 | 2012 | 2013 | |||||||
| Eastern Slovenia | number of deaths/100.000 residents | 70.4 | 69.9 | 68.4 | 75.6 | 75.6 | |||||
| West Slovenia | number of deaths/100.000 residents | 59.9 | 53.3 | 52.6 | 65.5 | 30 | |||||
| Slovenia | number of deaths/100.000 residents | 61.8 | 54.6 | 58.3 | 67.4 | 47.6 |
Figure ZD18-2: The mortality rate (number of deaths/ 100 000 inhabitants) for respiratory diseases in Slovenia in statistical regions, in the periode 2006-2008 and 2009-2013
Sources:
NIJZ, 2007-2013
| average | ||
|---|---|---|
| Goriška | number of deaths/100.000 residents | 60.6 |
| Jugovzhodna Slovenija | number of deaths/100.000 residents | 47.23 |
| Koroška | number of deaths/100.000 residents | 57.33 |
| Notranjsko-kraška | number of deaths/100.000 residents | 88.9 |
| Obalno-kraška | number of deaths/100.000 residents | 67.83 |
| Osrednjeslovenska | number of deaths/100.000 residents | 50.33 |
| Podravska | number of deaths/100.000 residents | 54.57 |
| Pomurska | number of deaths/100.000 residents | 74 |
| Savinjska | number of deaths/100.000 residents | 61.3 |
| Spodnjeposavska | number of deaths/100.000 residents | 58.47 |
| Zasavska | number of deaths/100.000 residents | 56.2 |
| Slovenia | number of deaths/100.000 residents | 56.73 |
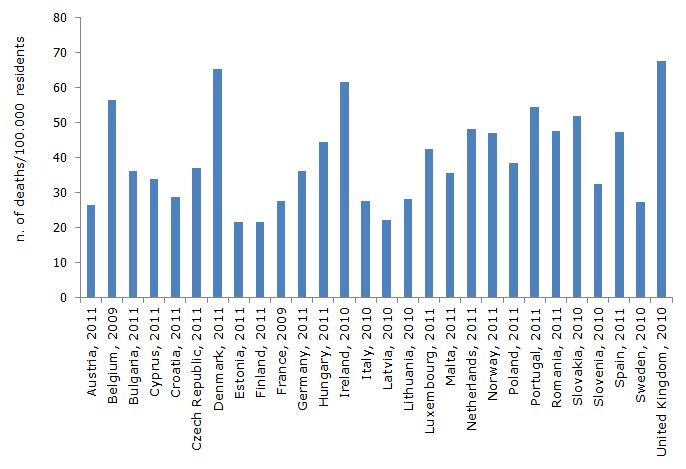
Figure ZD18-3: The mortality rate (number of deaths/ 100 000 inhabitants) for respiratory diseases in selected European countries.
Sources:
WHO, 2009
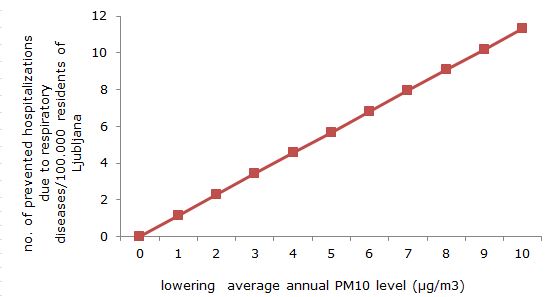
Figure ZD18-4: Number of prevented hospitalizations in one year per 100 000 population, if the average level of PM10 would decrease for 10µg/m3; Ljubljana, in the year 2007
Sources:
APHECOM, 2010
| no. of prevented hospitalizations due to respiratory diseases | prevented hospitalizations due to respiratory diseases, 100.000 inhabitants of Ljubljana | ||
|---|---|---|---|
| change in PM10 conc. - 1 µg/m3 | µg/m3 | 3 | 1.1 |
| change in PM10 conc. - 2 µg/m3 | µg/m3 | 6.1 | 2.3 |
| change in PM10 conc. - 3 µg/m3 | µg/m3 | 9.1 | 3.4 |
| change in PM10 conc. - 4 µg/m3 | µg/m3 | 12.1 | 4.5 |
| change in PM10 conc. - 5 µg/m3 | µg/m3 | 15.2 | 5.7 |
| change in PM10 conc. - 6 µg/m3 | µg/m3 | 18.2 | 6.8 |
| change in PM10 conc. - 7 µg/m3 | µg/m3 | 21.2 | 7.9 |
| change in PM10 conc. - 8 µg/m3 | µg/m3 | 24.2 | 9.1 |
| change in PM10 conc. - 9 µg/m3 | µg/m3 | 27.2 | 10.2 |
| change in PM10 conc. - 10 µg/m3 | µg/m3 | 30.3 | 11.3 |
| change in PM10 conc. - 15 µg/m3 | µg/m3 | 45.3 | 17 |
| change in PM10 conc. -20 µg/m3 | µg/m3 | 60.2 | 22.5 |
| change in PM10 conc. - 25 µg/m3 | µg/m3 | 75 | 28.1 |


