[ZD21] Incidence of foodborne diseases

Key message

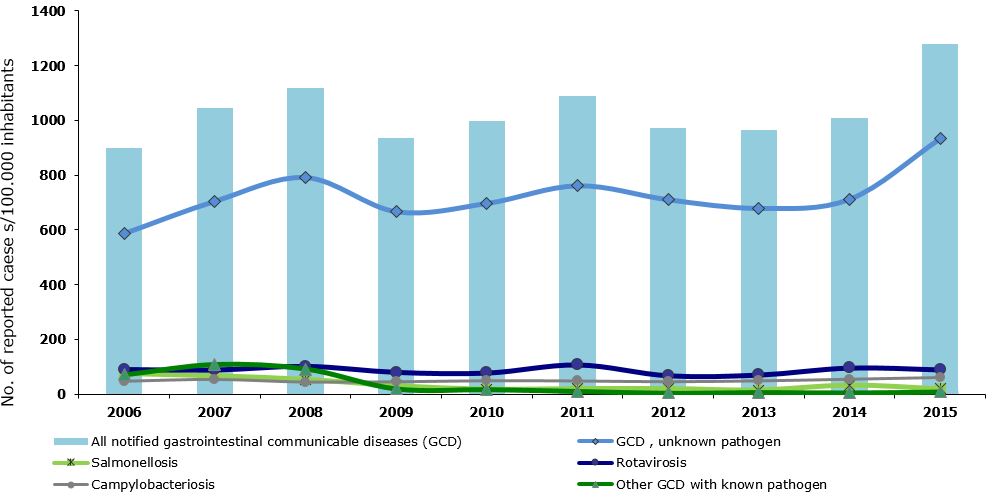
The incidence of intestinal infectious diseases (IID) and foodborne diseases remains high and increased in 2015. The most frequent is gastroenterocolitis of unknown aetiology, followed by viral infections of the gut, which are becoming increasingly important to monitor. Among bacterial infections, Campylobacter infections prevail, followed by infections caused by Salmonella, Clostridium difficile, adenoviruses and pathogenic E.coli. The actual burden of the IID and foodborne diseases can be assessed only through research.
Definition
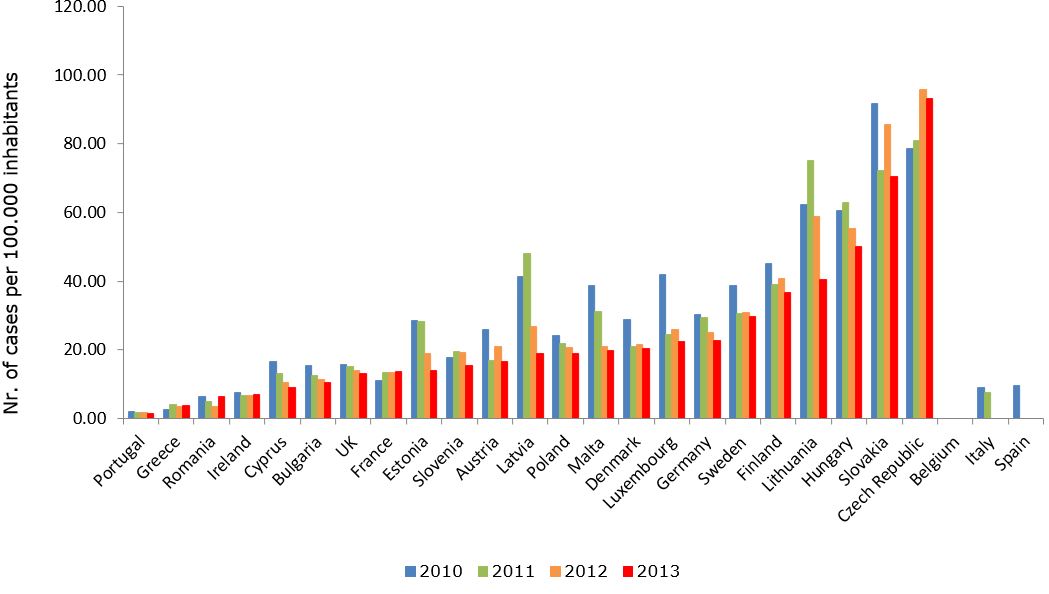
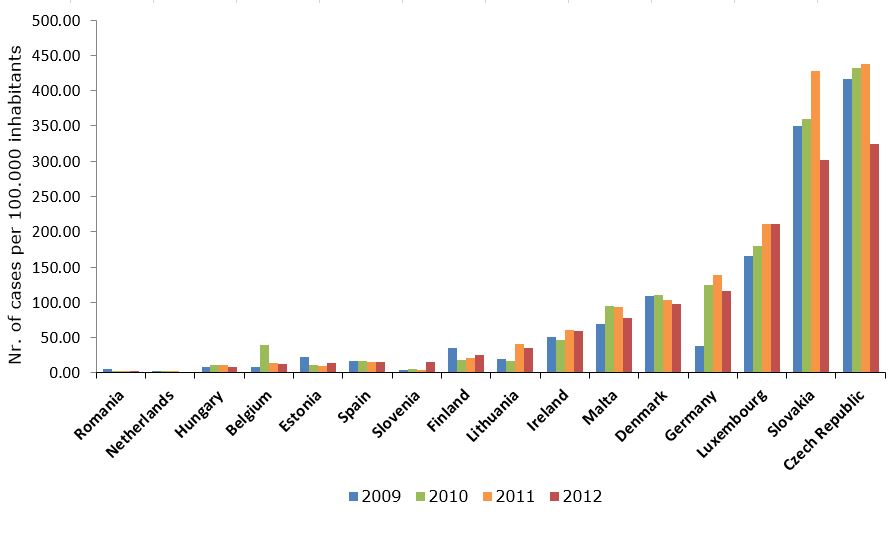
This indicator shows the number of reported (i.e. the incidence of) intestinal infectious diseases (IID) and foodborne diseases in Slovenia and some EU countries in the selected period.
Intestinal infectious diseases are diseases caused by various agents: viruses, bacteria, fungi and parasites. They are transmitted faecally-orally (from faeces to mouth); usually through ingested food, water or unclean hands. Pursuant to the International Classification of Diseases ICD-10, they are classified among diagnoses A00 through A09, B15 and B17.2.
Incidence means the number of all newly determined cases of a certain illness in a defined population within a calendar year and is therefore a basic indicator of a phenomenon's dynamics (growth, decline, stagnation). Although incidence can be expressed in absolute numbers, it is usually expressed as a rate, calculated in relation to a certain population.
A person suffering from an intestinal infectious disease or a foodborne disease has digestion problems due to an infected gastro-intestinal tract, which is manifested by nausea, vomiting, abdominal cramps, elevated body temperature and diarrhoea. Intestinal infectious diseases represent a particular hazard to the elderly, people with chronic diseases, infants, children and pregnant women.
Charts
National Institute of Public Health, 2005–2016.
| 2002 | 2003 | 2004 | 2005 | 2006 | 2007 | 2008 | 2009 | 2010 | 2011 | ||
|---|---|---|---|---|---|---|---|---|---|---|---|
| All notified gastrointestinal communicable diseases (GCD) | No.of reported cases/100.000 inh. | 1001.9 | 947.3 | 943.8 | 814.2 | 899.3 | 1046.5 | 1118.2 | 936.3 | 997.5 | 1087.6 |
| GCD , unknown pathogen | No.of reported cases/100.000 inh. | 556.3 | 493.1 | 546.2 | 489.1 | 586.2 | 704.1 | 790.6 | 665.5 | 696.1 | 760.6 |
| Salmonellosis | No.of reported cases/100.000 inh. | 136.6 | 200.6 | 165.5 | 75.8 | 75.8 | 67.2 | 54 | 30.1 | 17 | 19.5 |
| Rotavirosis | No.of reported cases/100.000 inh. | 102 | 97 | 91.1 | 83.4 | 91.1 | 89.1 | 102.5 | 80.5 | 78 | 107.5 |
| Campylobacteriosis | No.of reported cases/100.000 inh. | 60.1 | 43.6 | 52 | 54.3 | 47.1 | 53.7 | 44 | 45.1 | 48.9 | 48 |
| Other GCD with known pathogen | No.of reported cases/100.000 inh. | 91.8 | 75 | 57.7 | 85.5 | 70 | 107 | 91 | 19.7 | 17.5 | 10.9 |
| 2012 | 2013 | 2014 | 2015 | ||||||||
| All notified gastrointestinal communicable diseases (GCD) | No.of reported cases/100.000 inh. | 972.5 | 964.8 | 1008.9 | 1280.9 | ||||||
| GCD , unknown pathogen | No.of reported cases/100.000 inh. | 709.4 | 678 | 711.3 | 933.4 | ||||||
| Salmonellosis | No.of reported cases/100.000 inh. | 19.5 | 14.2 | 32.4 | 18.6 | ||||||
| Rotavirosis | No.of reported cases/100.000 inh. | 68.1 | 70.7 | 96.2 | 89.5 | ||||||
| Campylobacteriosis | No.of reported cases/100.000 inh. | 45.4 | 48.4 | 54.3 | 60.5 | ||||||
| Other GCD with known pathogen | No.of reported cases/100.000 inh. | 4.3 | 7 | 5.6 | 8.8 |
National Institute of Public Health, 2016.
| No. of aplications | No of cases/100.000 residents | ||
|---|---|---|---|
| All reported GCD | No. of aplications | 3651 | 177.1 |
| GCD, unknown pathogen | No. of aplications | 963 | 46.7 |
| rotaviruses | No. of aplications | 1027 | 49.8 |
| campylobacters | No. of aplications | 495 | 24 |
| noroviruses | No. of aplications | 357 | 17.3 |
| Salmonella spp; typhus and paratyphus | No. of aplications | 294 | 14.3 |
| E.coli | No. of aplications | 69 | 3.3 |
| Cl difficile | No. of aplications | 259 | 12.6 |
| adenoviruses | No. of aplications | 98 | 4.8 |
| shigellas | No. of aplications | 6 | 0.3 |
| Y. enterocolitica | No. of aplications | 9 | 0.4 |
| hepatitis A virus | No. of aplications | 6 | 0.3 |
| hepatitis E virus | No. of aplications | 0 | 0 |
| parasites | No. of aplications | 4 | 0.2 |
| other GCD with known pathogen | No. of aplications | 56 | 2.7 |
WHO, 2015.
| No. of aplications | No of cases/100.000 residents | ||
|---|---|---|---|
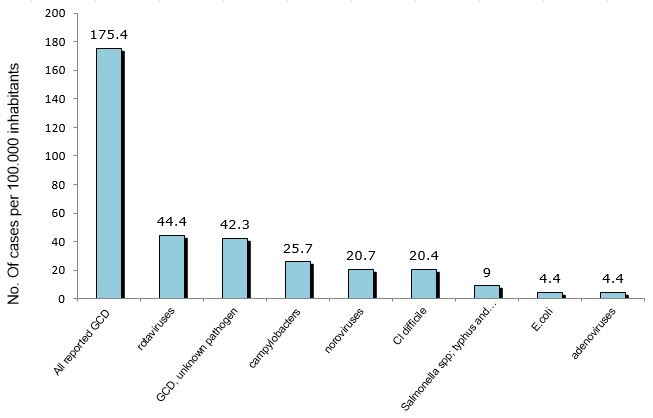
| All reported GCD | No. of aplications | 3618 | 175.4 |
| rotaviruses | No. of aplications | 917 | 44.4 |
| GCD, unknown pathogen | No. of aplications | 872 | 42.3 |
| campylobacters | No. of aplications | 530 | 25.7 |
| noroviruses | No. of aplications | 427 | 20.7 |
| Cl difficile | No. of aplications | 421 | 20.4 |
| Salmonella spp; typhus and paratyphus | No. of aplications | 185 | 9 |
| E.coli | No. of aplications | 90 | 4.4 |
| adenoviruses | No. of aplications | 90 | 4.4 |
| shigellas | No. of aplications | 3 | 0.1 |
| Y. enterocolitica | No. of aplications | 4 | 0.2 |
| hepatitis A virus | No. of aplications | 1 | 0.1 |
| hepatitis E virus | No. of aplications | 0 | 0 |
| parasites | No. of aplications | 3 | 0.1 |
| other GCD with known pathogen | No. of aplications | 69 | 3.3 |
WHO, 2015.
| 2006 | 2007 | 2008 | 2009 | 2010 | 2011 | 2012 | ||
|---|---|---|---|---|---|---|---|---|
| Austria | No. of cases/100.000 inh. | NP | NP | NP | NP | NP | NP | NP |
| Belgium | No. of cases/100.000 inh. | 9.8 | 8 | 7.9 | 8.5 | 38.9 | 13.9 | 12.4 |
| Bulgaria | No. of cases/100.000 inh. | NP | NP | NP | NP | NP | NP | NP |
| Cyprus | No. of cases/100.000 inh. | NP | NP | NP | NP | NP | NP | NP |
| Czech Republic | No. of cases/100.000 inh. | 574.7 | 534.4 | 426 | 416 | 432.1 | 437.6 | 324.9 |
| Denmark | No. of cases/100.000 inh. | 98.5 | 110.8 | 139.9 | 109 | 109.9 | 103.4 | 98.1 |
| Estonia | No. of cases/100.000 inh. | 8.3 | 2.1 | 9.9 | 23.2 | 11 | 9.8 | 13.6 |
| Finland | No. of cases/100.000 inh. | 35.3 | 181.9 | 18.8 | 35 | 17.7 | 21.3 | 26 |
| France | No. of cases/100.000 inh. | NP | NP | 20.1 | 22.2 | 15.7 | 15.3 | NP |
| Germany | No. of cases/100.000 inh. | 63.9 | 67.4 | 52.3 | 38.4 | 31 | 138.3 | 116.7 |
| Greece | No. of cases/100.000 inh. | NP | NP | NP | NP | NP | NP | NP |
| Hungary | No. of cases/100.000 inh. | 68.1 | 11.5 | 19.8 | 8.4 | 11 | 10.8 | 9.9 |
| Ireland | No. of cases/100.000 inh. | 54.2 | 55.8 | 52 | 50.2 | 46.9 | 61.1 | 59.8 |
| Italy | No. of cases/100.000 inh. | NP | NP | NP | NP | NP | NP | NP |
| Latvia | No. of cases/100.000 inh. | NP | NP | NP | NP | NP | NP | NP |
| Lithuania | No. of cases/100.000 inh. | 29.9 | 22.9 | 25.8 | 19.6 | 16.4 | 40.6 | 34.7 |
| Luxembourg | No. of cases/100.000 inh. | 131.4 | 150.4 | 179.3 | 165.7 | 179.9 | 210.7 | 211.1 |
| Malta | No. of cases/100.000 inh. | 43.3 | 60.9 | 55.3 | 68.8 | 82.5 | 93.1 | 78.2 |
| Netherlands | No. of cases/100.000 inh. | 2.9 | 4.6 | 4.2 | 2.1 | 2.1 | 2.2 | NP |
| Poland | No. of cases/100.000 inh. | NP | NP | NP | NP | NP | NP | NP |
| Portugal | No. of cases/100.000 inh. | NP | NP | NP | NP | NP | NP | NP |
| Romania | No. of cases/100.000 inh. | 11.1 | 10.9 | 8.3 | 5 | 2.5 | 3.4 | 2.1 |
| Slovakia | No. of cases/100.000 inh. | 380 | 407.1 | 374 | 349.6 | 360.2 | 427.2 | 301.6 |
| Slovenia | No. of cases/100.000 inh. | 24.8 | 36.6 | 33.9 | 4.1 | 5.9 | 4.6 | 15.5 |
| Spain | No. of cases/100.000 inh. | 23.9 | 18.6 | 16.4 | 16.2 | 16.9 | 16.1 | 15.2 |
| Sweden | No. of cases/100.000 inh. | NP | NP | NP | NP | NP | NP | NP |
| UK | No. of cases/100.000 inh. | NP | NP | NP | NP | NP | NP | NP |
Goals
The incidence of foodborne diseases in Slovenia is high and is an important public health issue.
Within a broader framework, guidelines have been set at the European level by the Global Foodborne Infections Network programme (GFN 2013) that includes Slovenia as a member state and that is committed to enhancing the capacity of countries to detect, respond and prevent foodborne and other enteric infections.
The goals of in-depth monitoring of the indicator ‘Incidence of foodborne diseases or intestinal infectious diseases’ are as follows:
- to assess trends as regards the incidence of acute gastroenterocolitis and individual agents of IID or foodborne diseases;
- to estimate the seriousness of an outbreak as regards the number of hospitalisations and deaths due to IID or foodborne diseases;
- to assess risk to human health;
- to make informed decisions as regards public health measures;
- based on the obtained data, inform and educate the general and professional public in order to reduce the incidence of IID or foodborne diseases.
Comment
Intestinal infectious diseases or foodborne diseases remain the most common cause of morbidity and mortality and therefore represent an important public health challenge. It has been estimated that each inhabitant of Slovenia has an acute intestinal infection once a year. These infections are classified among zoonosis, i.e. diseases transmitted from animals to humans.
Intestinal infectious diseases are caused by various agents. Animals or people excrete them with faeces and vomit, they are transmitted through unclean hands (dirty hands diseases) to food (foodborne infections), water (waterborne infections), objects or other people (contact infections). Agents find their way into the mouth of a human who gets infected. The described route is called the ‘faecal-oral transmission route’. An epidemiological basin for intestinal infectious diseases includes various animals as well as humans, with or without symptoms.
Diarrhoea and vomiting are the leading clinical symptoms of the majority of IID. Diarrhoea is characterised by passing loose or watery bowel movements 3 or more times in a day (or more frequently than usual). Common clinical symptoms also include increased body temperature and abdominal pain and cramps. Food intoxication is a term that describes indigestion caused by various toxins. Toxins produced by bacteria may already be present in food or are produced by bacteria in the intestines after food has been ingested. Food intoxication is most often characterised by nausea and vomiting, and to a lesser degree by abdominal pain and diarrhoea.
In 2015, 26,426 cases of IDD were reported, which was 27% more than a year earlier. The highest percentage of reported IID (73%) is represented by IDDs of unknown aetiology. Among the identified IID agents, norovirus or rotavirus infections were the most common. Compared to 2014, the number of norovirus infections increased by 77% and the number of rotavirus infections decreased by 7%.
The most common among the bacterial agents are Campylobacters, followed by infections with Clostridium difficile, Salmonellas, adenoviruses and pathogenic E.coli. In recent years, the number of reported infections with Clostridium difficile has been increasing rapidly. In 2014, a considerable increase in the number of Salmonella infections was recorded, both sporadic as well as outbreaks, while in 2015, the incidence decreased again.
In 2015, the number of hospitalisations due to IID decreased by 0.9% compared to 2014. The highest number of hospitalisations was due to rotavirus infections (25%), IID of unknown aetiology (24%) and Campylobacter infections (15%).
The actual incidence of IID or foodborne infections is unknown. It is probably considerably higher than what is reported . Namely, reports cover only the infected and diseased population that seeks medical attention. In this way, the actual burden of IDD is underestimated. The factor by which the number of received reports would need to be multiplied in order to reveal the actual incidence in Slovenia is unknown. According to an estimate made by the CDC (Centres for Disease Control and Prevention), the factor is at least 5, but it may be higher, depending on the IID agent and the population size.
According to the European Food Safety Authority (EFSA) and the European Centre for Disease Prevention and Control (ECDC), campylobacteriosis has been the most common bacterial zoonosis or intestinal infectious disease in European countries in recent years.
The association between poor microbiological quality of drinking water and a disease can easily be established during waterborne outbreaks. The impact of water samples that were obtained during regular monitoring and were non-compliant due to the presence of E. coli on the incidence of acute gastroenterocolitis has not been studied so far. Research conducted at the National Institute of Public Health in 2010 analysed the geographic distribution of reported cases of the acute gastroenterocolitis illness (AGI) in Slovenia and determined the locations of their concentration. It was established that a correlation exists between faecal contamination of water sources and the distribution of reported AGI cases. A spatial analysis conducted using geoinformation technology and other methods revealed a correlation between the frequency of reported AGI cases and non-compliant drinking water samples obtained during drinking water monitoring. Places with the highest percentage of reported AGI cases are located in areas with small water supply systems. The risk of developing AGI through drinking water contaminated with E.coli was 1.25 in water supply areas supplying 50–1,000 users, thus significantly exceeding the value of 1 (Grilc et al., 2015).


