[PP13] Hydrological droughts of groundwater 
[PP13] Hydrological droughts of groundwater

Key message

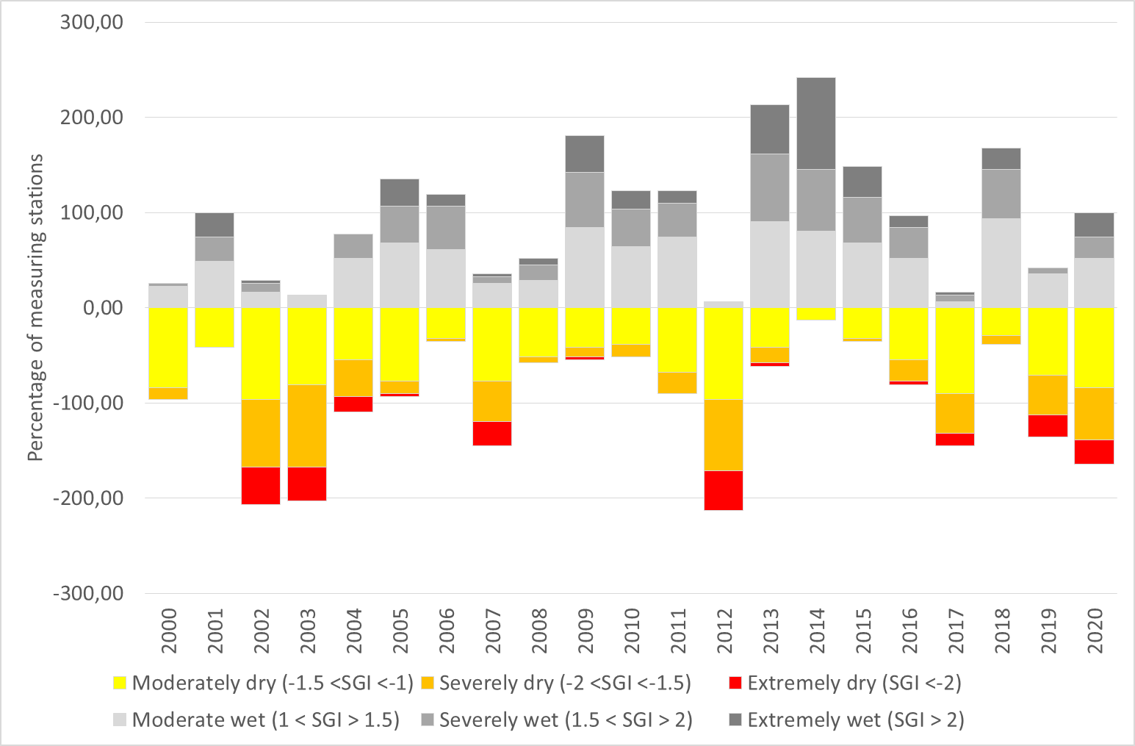
Frequency and intensity of groundwater droughts is increasing in recent decades. 7 out of 10 years with highest annual intensity of phenomenon is classified in the period after year 2000. The highest intensity of groundwater drought was recorded in years 2012, 2002 and 2003. Regarding the duration of groundwater drought the period between years 2002 and 2004 stands out. Extreme groundwater drought most frequently occur in winter and spring while severe drought is most commonly observed in spring and summer.
Charts
Figure PP13-1: Annual average of standardized groundwater level index (SGI) on selected measuring stations
Sources:
Source: Hydrologic database ARSO, Slovenian Environment Agency (February, 2022)
| 1982 | 1983 | 1984 | 1985 | 1986 | 1987 | 1988 | 1989 | 1990 | 1991 | 1992 | 1993 | 1994 | 1995 | 1996 | 1997 | 1998 | 1999 | 2000 | 2001 | 2002 | 2003 | 2004 | 2005 | 2006 | 2007 | 2008 | 2009 | 2010 | 2011 | 2012 | 2013 | 2014 | 2015 | 2016 | 2017 | 2018 | 2019 | 2020 | ||
| Letno povprečje standardiziranega indeksa gladine podzemne vode (SGI) | Annual average of standardized groundwater level index (SGI) | -0,14781 | 0,133332 | 0,228866 | 0,24421 | 0,461023 | 0,27045 | 0,507732 | -0,28902 | -0,36949 | 0,344909 | -0,20437 | -0,64069 | 0,263823 | 0,598722 | 0,606727 | -0,12729 | -0,33932 | 0,783914 | -0,62311 | 0,14468 | -1,00309 | -0,90449 | -0,23253 | 0,025355 | 0,364777 | -0,68941 | -0,17623 | 0,349287 | 0,183296 | -0,11217 | -1,20768 | 0,591969 | 0,774399 | 0,308199 | -0,17238 | -0,64323 | 0,641359 | -0,44917 | -0,29835 |
Table PP13-2: Percentage of measuring stations regarding intensity of groundwater drought in intergranular aquifers
Sources:
Hydrologic database ARSO, Slovenian Environment Agency, 2021 (May, 2021)
| Extremely dry (SGI <-2)[%] | Severely dry (-2 <SGI <-1.5)[%] | Moderately dry (-1.5 <SGI <-1)[%] | Moderate wet (1 < SGI > 1.5)[%] | Severely wet (1.5 < SGI > 2)[%] | Extremely wet (SGI > 2)[%] | |
|---|---|---|---|---|---|---|
| 1982 | -3.57 | -17.86 | -42.86 | 46.43 | 21.43 | 3.57 |
| 1983 | 0 | -25 | -32.14 | 71.43 | 32.14 | 7.14 |
| 1984 | -10.71 | -25 | -53.57 | 57.14 | 39.29 | 7.14 |
| 1985 | -3.57 | -17.86 | -39.29 | 75 | 67.86 | 25 |
| 1986 | 0 | -7.14 | -32.14 | 78.57 | 60.71 | 35.71 |
| 1987 | -3.57 | -3.57 | -46.43 | 71.43 | 46.43 | 14.29 |
| 1988 | 0 | 0 | 0 | 85.71 | 35.71 | 3.57 |
| 1989 | -25 | -60.71 | -85.71 | 50 | 42.86 | 10.71 |
| 1990 | 0 | -12.90 | -61.29 | 12.90 | 3.23 | 3.23 |
| 1991 | 0 | -3.23 | -9.68 | 54.84 | 35.48 | 9.68 |
| 1992 | 0 | -19.35 | -77.42 | 58.06 | 19.35 | 3.23 |
| 1993 | -22.58 | -87.10 | -93.55 | 58.06 | 19.35 | 6.45 |
| 1994 | -3.23 | -6.45 | -32.26 | 64.52 | 22.58 | 22.58 |
| 1995 | 0 | -3.23 | -12.90 | 80.65 | 64.52 | 38.71 |
| 1996 | 0 | -6.45 | -25.81 | 87.10 | 48.39 | 6.45 |
| 1997 | -3.23 | -22.58 | -48.39 | 41.94 | 19.35 | 0 |
| 1998 | -9.68 | -41.94 | -74.19 | 45.16 | 51.61 | 16.13 |
| 1999 | 0 | -3.23 | -12.90 | 80.65 | 67.74 | 45.16 |
| 2000 | 0 | -12.90 | -83.87 | 22.58 | 3.23 | 0 |
| 2001 | 0 | 0 | -41.94 | 48.39 | 25.81 | 25.81 |
| 2002 | -38.71 | -70.97 | -96.77 | 16.13 | 9.68 | 3.23 |
| 2003 | -35.48 | -87.10 | -80.65 | 12.90 | 0 | 0 |
| 2004 | -16.13 | -38.71 | -54.84 | 51.61 | 25.81 | 0 |
| 2005 | -3.23 | -12.90 | -77.42 | 67.74 | 38.71 | 29.03 |
| 2006 | 0 | -3.23 | -32.26 | 61.29 | 45.16 | 12.90 |
| 2007 | -25.81 | -41.94 | -77.42 | 25.81 | 6.45 | 3.23 |
| 2008 | 0 | -6.45 | -51.61 | 29.03 | 16.13 | 6.45 |
| 2009 | -3.23 | -9.68 | -41.94 | 83.87 | 58.06 | 38.71 |
| 2010 | 0 | -12.90 | -38.71 | 64.52 | 38.71 | 19.35 |
| 2011 | 0 | -22.58 | -67.74 | 74.19 | 35.48 | 12.90 |
| 2012 | -41.94 | -74.19 | -96.77 | 6.45 | 0 | 0 |
| 2013 | -3.23 | -16.13 | -41.94 | 90.32 | 70.97 | 51.61 |
| 2014 | 0 | 0 | -12.90 | 80.65 | 64.52 | 96.77 |
| 2015 | 0 | -3.23 | -32.26 | 67.74 | 48.39 | 32.26 |
| 2016 | -3.23 | -22.58 | -54.84 | 51.61 | 32.26 | 12.90 |
| 2017 | -12.90 | -41.94 | -90.32 | 6.45 | 6.45 | 3.23 |
| 2018 | 0 | -9.68 | -29.03 | 93.55 | 51.61 | 22.58 |
| 2019 | -22.58 | -41.94 | -70.97 | 35.48 | 6.45 | 0 |
| 2020 | -25.81 | -54.84 | -83.87 | 51.61 | 22.58 | 25.81 |
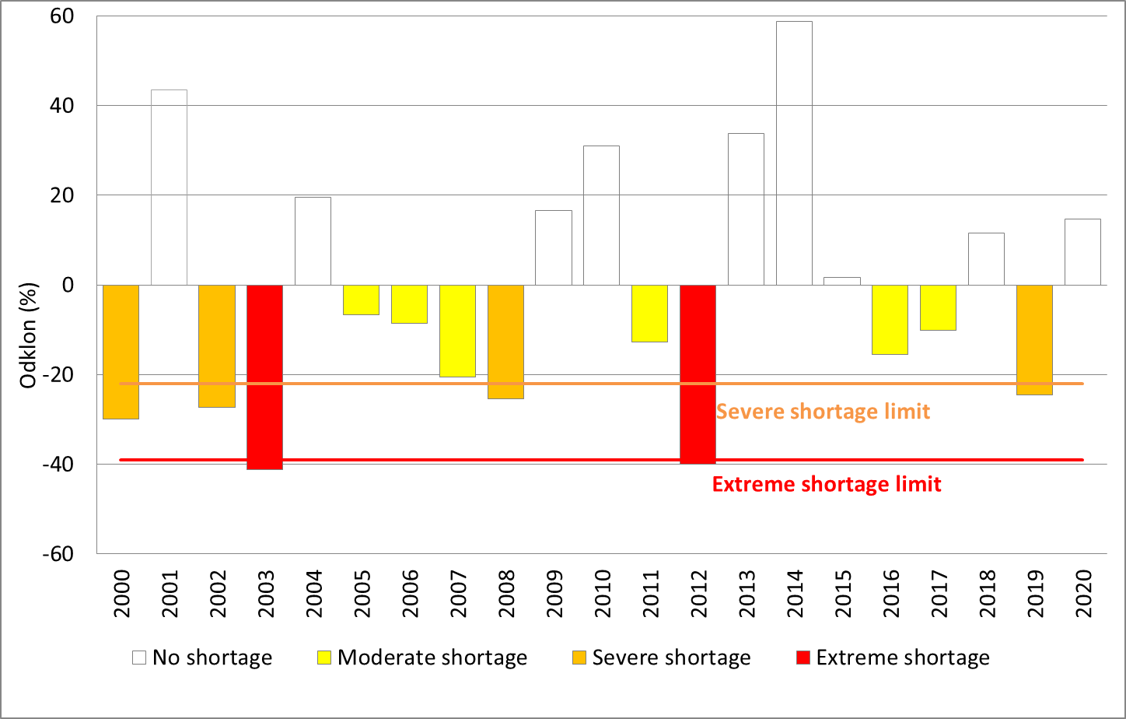
Figure PP13-3: Deviation of the annual amount of vertical groundwater supply with precipitation infiltration from the reference period
Sources:
Water balance model mGROWA, Slovenian Environment Agency, 2021 (May, 2021)
| 1972 | 1973 | 1974 | 1975 | 1976 | 1977 | 1978 | 1979 | 1980 | 1981 | 1982 | 1983 | 1984 | 1985 | 1986 | 1987 | 1988 | 1989 | 1990 | 1991 | 1992 | 1993 | 1994 | 1995 | 1996 | 1997 | 1998 | 1999 | 2000 | 2001 | 2002 | 2003 | 2004 | 2005 | 2006 | 2007 | 2008 | 2009 | 2010 | 2011 | 2012 | 2013 | 2014 | 2015 | 2016 | 2017 | 2018 | 2019 | 2020 | |||
| Obdobno povprečje mGROWA 1991-2020 (v mm) | Periodic average of mGROWA 1991-2020 (in mm) | mm | 316,553 | 316,553 | 316,553 | 316,553 | 316,553 | 316,553 | 316,553 | 316,553 | 316,553 | 316,553 | 316,553 | 316,553 | 316,553 | 316,553 | 316,553 | 316,553 | 316,553 | 316,553 | 316,553 | 316,553 | 316,553 | 316,553 | 316,553 | 316,553 | 316,553 | 316,553 | 316,553 | 316,553 | 316,553 | 316,553 | 316,553 | 316,553 | 316,553 | 316,553 | 316,553 | 316,553 | 316,553 | 316,553 | 316,553 | 316,553 | 316,553 | 316,553 | 316,553 | 316,553 | 316,553 | 316,553 | 316,553 | 316,553 | 316,553 |
| Odstopanje od povprečja (mm) | Deviation from average (mm) | mm | 68,191 | -47,988 | 4,708 | -7,323 | -6,072 | -8,683 | -4,789 | 68,643 | 31,898 | -1,889 | -1,462 | -32,165 | 49,247 | -13,863 | 46,192 | 13,811 | 35,338 | -86,024 | -81,581 | 44,058 | -19,476 | 15,450 | -0,825 | 48,126 | 41,194 | -101,888 | 75,953 | -11,365 | -94,673 | 137,392 | -86,456 | -130,621 | 61,768 | -20,867 | -26,926 | -65,019 | -80,429 | 52,576 | 98,143 | -40,393 | -126,581 | 106,891 | 186,099 | 5,322 | -49,268 | -32,161 | 36,378 | -77,530 | 46,213 |
| Letno napajanje podzemne vode (odstopanje od dolgoletnega povprečja) | Deviation from the average (%) | % | 22 | -15 | 1 | -2 | -2 | -3 | -2 | 22 | 10 | -1 | 0 | -10 | 16 | -4 | 15 | 4 | 11 | -27 | -26 | 14 | -6 | 5 | 0 | 15 | 13 | -32 | 24 | -4 | -30 | 43 | -27 | -41 | 20 | -7 | -9 | -21 | -25 | 17 | 31 | -13 | -40 | 34 | 59 | 2 | -16 | -10 | 11 | -24 | 15 |
| Močan primanjkljaj napajanja podzemne vode | Severe groundwater supply shortage | % | -22 | -22 | -22 | -22 | -22 | -22 | -22 | -22 | -22 | -22 | -22 | -22 | -22 | -22 | -22 | -22 | -22 | -22 | -22 | -22 | -22 | -22 | -22 | -22 | -22 | -22 | -22 | -22 | -22 | -22 | -22 | -22 | -22 | -22 | -22 | -22 | -22 | -22 | -22 | -22 | -22 | -22 | -22 | -22 | -22 | -22 | -22 | -22 | -22 |
| Izreden primanjkljaj napajanja podzemne vode | Extreme groundwater supply shortage | % | -39 | -39 | -39 | -39 | -39 | -39 | -39 | -39 | -39 | -39 | -39 | -39 | -39 | -39 | -39 | -39 | -39 | -39 | -39 | -39 | -39 | -39 | -39 | -39 | -39 | -39 | -39 | -39 | -39 | -39 | -39 | -39 | -39 | -39 | -39 | -39 | -39 | -39 | -39 | -39 | -39 | -39 | -39 | -39 | -39 | -39 | -39 | -39 | -39 |
Methodology
Date of data source summarization


