[EN25] Energy import dependency

Key message

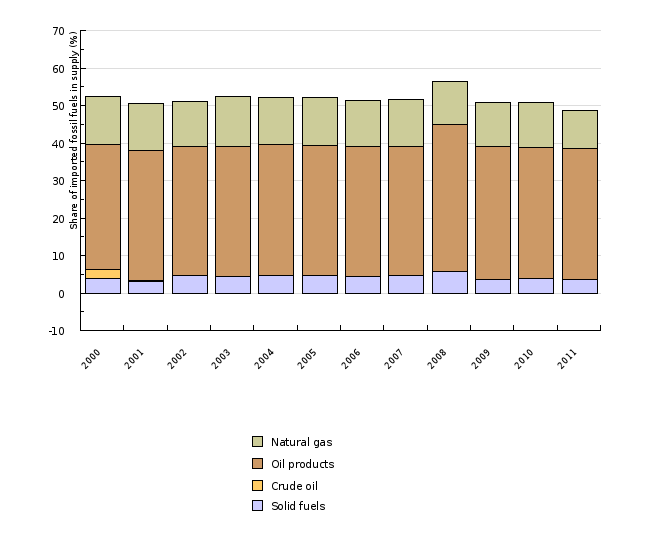
The import dependence of Slovenia has been decreasing in the past three years due to the reduction of use of imported solid fuels and natural gas, but also due to increase in statistical use of RES and the year without any refitting in NEK in the year 2011. The most problematic is the import dependence on gaseous fuels, since Slovenia is strongly dependant on imports from Russia and Algeria.
Definition
The indicator Energy Import Dependence analyses several aspects determining the reliability of energy supply:
• dispersion of energy imports by fuel (imports of fuel by countries),
• energy import dependence by fuel (percentage of imports of individual fuels),
• contribution of individual fuel to import dependence of a country (net import with regard to the total energy supply).
The indicator can be shown in relative (share of individual sectors in total final energy consumption) or absolute units. For the indication in absolute units, the thousand tonnes of oil equivalent (ktoe) is used.
Charts
Statistical Office of the RS, 2012; Jožef Stefan Institute, 2012.
| 2000 | 2001 | 2002 | 2003 | 2004 | 2005 | 2006 | 2007 | 2008 | 2009 | ||
|---|---|---|---|---|---|---|---|---|---|---|---|
| Solid fuels | % | 3.74 | 3.14 | 4.55 | 4.46 | 4.73 | 4.56 | 4.53 | 4.56 | 5.74 | 3.64 |
| Crude oil | % | 2.46 | 0.07 | 0.07 | -0.01 | -0.01 | -0.01 | -0.01 | -0.01 | -0 | -0 |
| Oil products | % | 33.47 | 34.72 | 34.39 | 34.68 | 34.74 | 34.79 | 34.5 | 34.48 | 39.15 | 35.46 |
| Natural gas | % | 12.63 | 12.68 | 12.11 | 13.23 | 12.72 | 12.84 | 12.4 | 12.6 | 11.45 | 11.81 |
| Import dependency in gross inland consumption | % | 52.3 | 50.61 | 51.11 | 52.36 | 52.18 | 52.19 | 51.42 | 51.64 | 56.33 | 50.9 |
| 2010 | 2011 | ||||||||||
| Solid fuels | % | 3.91 | 3.58 | ||||||||
| Crude oil | % | -0.01 | -0.01 | ||||||||
| Oil products | % | 34.84 | 34.98 | ||||||||
| Natural gas | % | 11.98 | 10.22 | ||||||||
| Import dependency in gross inland consumption | % | 50.73 | 48.78 |
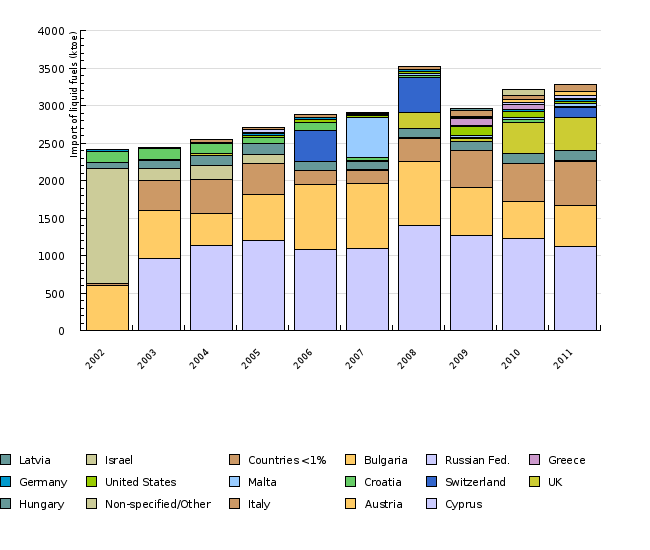
Statistical Office of the RS, 2012; Jožef Stefan Institute, 2012.
| 2002 | 2003 | 2004 | 2005 | 2006 | 2007 | 2008 | 2009 | 2010 | 2011 | ||
|---|---|---|---|---|---|---|---|---|---|---|---|
| Cyprus | ktoe | 0 | 963.83 | 1134.28 | 1193.51 | 1073.54 | 1093.08 | 1398.53 | 1267.67 | 1226.37 | 1115.04 |
| Austria | ktoe | 593.37 | 629.62 | 429.59 | 618.76 | 879.13 | 867.58 | 855.89 | 635.47 | 491.89 | 550.21 |
| Italy | ktoe | 34.9 | 409.36 | 456.1 | 415.39 | 174.94 | 171.46 | 303.48 | 499.36 | 505.53 | 592.36 |
| Non-specified/Other | ktoe | 1536.6 | 153.31 | 178.86 | 113.36 | 5.29 | 13.36 | 15.31 | 3.97 | 7.29 | 4.15 |
| Hungary | ktoe | 69.62 | 106.26 | 133.8 | 147.47 | 115.54 | 112.32 | 126.71 | 119.52 | 133.89 | 143.62 |
| UK | ktoe | 0 | 0 | 26.45 | 0 | 4.07 | 0 | 203.67 | 27.47 | 410.05 | 431.47 |
| Switzerland | ktoe | 0 | 13.76 | 0 | 0 | 410.61 | 2.2 | 474.19 | 1.1 | 0 | 135.33 |
| Croatia | ktoe | 145.58 | 152.46 | 137.98 | 80.34 | 113.56 | 40.1 | 17.82 | 17.66 | 38.07 | 14.35 |
| Malta | ktoe | 0 | 0 | 0 | 0 | 0 | 541.57 | 27.47 | 30.52 | 30.52 | 33.58 |
| United States | ktoe | 0 | 0 | 0 | 27.52 | 35.16 | 23.69 | 26.75 | 122.16 | 72.75 | 30.47 |
| Germany | ktoe | 27.06 | 0 | 13.31 | 27.32 | 28.66 | 19.87 | 26.27 | 11.62 | 30.16 | 32.26 |
| Greece | ktoe | 0 | 0 | 0 | 12.21 | 0 | 0 | 0 | 90.56 | 67.15 | 13.23 |
| Russian Fed. | ktoe | 0 | 5.17 | 0 | 48.84 | 2.2 | 8.8 | 5.5 | 12.1 | 20.9 | 33.52 |
| Bulgaria | ktoe | 0 | 0 | 0 | 0 | 0 | 0 | 0 | 17.8 | 39.68 | 54.73 |
| Countries | ktoe | 11 | 12.1 | 33.55 | 15.58 | 31.59 | 17.11 | 42.74 | 71.88 | 60.65 | 89.32 |
| Israel | ktoe | 0 | 0 | 0 | 0 | 0 | 0 | 0 | 1.04 | 72.31 | 0 |
| Latvia | ktoe | 0 | 0 | 0 | 0 | 0 | 0 | 0 | 33.58 | 0 | 0 |
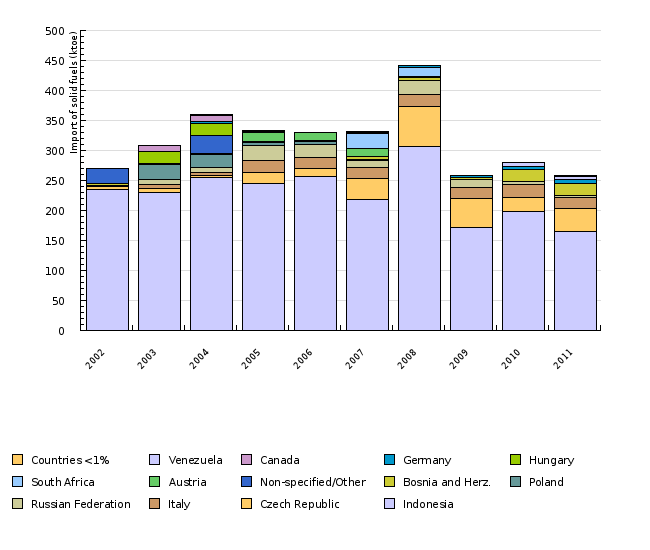
Statistical Office of the RS, 2012; Jožef Stefan Institute, 2012.
| 2002 | 2003 | 2004 | 2005 | 2006 | 2007 | 2008 | 2009 | 2010 | 2011 | ||
|---|---|---|---|---|---|---|---|---|---|---|---|
| Indonesia | ktoe | 235.15 | 230.65 | 255.23 | 245.07 | 256.49 | 218.14 | 306.26 | 171.39 | 198.02 | 164.41 |
| Czech Republic | ktoe | 5.34 | 6.26 | 2.96 | 18.23 | 12.8 | 35.73 | 66.89 | 49.01 | 24.02 | 39.64 |
| Italy | ktoe | 1.44 | 5.64 | 4.94 | 20.82 | 19.68 | 18.34 | 19.84 | 17.65 | 21.47 | 18.43 |
| Russian Federation | ktoe | 0 | 8.36 | 8.55 | 23.51 | 21.19 | 10.92 | 24.26 | 13.13 | 4.23 | 3.03 |
| Poland | ktoe | 0 | 26.36 | 21.06 | 6.44 | 5.61 | 1.82 | 0 | 0 | 0 | 0 |
| Bosnia and Herz. | ktoe | 2.72 | 1.16 | 2.86 | 0 | 0.71 | 4.55 | 5.03 | 3.6 | 20.43 | 20.2 |
| Non-specified/Other | ktoe | 25.34 | 0 | 29.56 | 0.98 | 0 | 0 | 0 | 0 | 0.36 | 0 |
| Austria | ktoe | 0 | 0 | 0 | 15.63 | 12.72 | 13.29 | 1.41 | 0.7 | 0 | 0 |
| South Africa | ktoe | 0 | 0 | 0 | 0 | 0 | 26.08 | 14.56 | 0 | 0 | 0 |
| Hungary | ktoe | 0 | 20.44 | 19.04 | 0 | 0 | 0 | 0.7 | 0 | 0 | 0 |
| Germany | ktoe | 0 | 0 | 3.53 | 0.59 | 0.62 | 1.31 | 2.52 | 2.55 | 4.73 | 6.24 |
| Canada | ktoe | 0 | 9.87 | 10.58 | 0 | 0 | 0 | 0 | 0 | 0 | 0 |
| Venezuela | ktoe | 0 | 0 | 0 | 0 | 0 | 0 | 0 | 0 | 6.64 | 5.45 |
| Countries | ktoe | 0 | 0 | 2.12 | 1.56 | 0.62 | 1.21 | 0.61 | 0 | 0 | 0.61 |
Statistical Office of the RS, 2012; Jožef Stefan Institute, 2012.
| 2002 | 2003 | 2004 | 2005 | 2006 | 2007 | 2008 | 2009 | 2010 | 2011 | ||
|---|---|---|---|---|---|---|---|---|---|---|---|
| Russian Federation | ktoe | 542.56 | 599.93 | 595.01 | 614.93 | 509.63 | 517.27 | 460.71 | 446.79 | 447.45 | 392.47 |
| Algeria | ktoe | 362.62 | 400.59 | 396.96 | 410.55 | 321.49 | 326.31 | 294.81 | 269.97 | 314.18 | 188.07 |
| Austria | ktoe | 0 | 0 | 0 | 0 | 164.23 | 166.71 | 195.33 | 158.31 | 142.81 | 179.9 |
| Italy | ktoe | 0 | 0.93 | 0.91 | 1.82 | 0 | 1.53 | 21.71 | 45.02 | 47.6 | 57.23 |
| Croatia | ktoe | 0 | 1.27 | 0.91 | 0.91 | 0 | 1.07 | 0.91 | 0.98 | 0 | 0 |
Goals
- provision of reliability of energy supply;
- increase of reliability of energy supply, which is possible by decreasing the dependence on imported fuels and increasing the number of suppliers.
Methodology
Data for Slovenia
Objectives summarised by: Resolucija o Nacionalnem energetskem programu (ReNEP) (Resolution on the National Energy Programme, Official Gazette of the RS, No. 57/04) and the proposal of the climate-energy package.
Source database or source: SI-STAT Data Portal of the Statistical Office of the Republic of Slovenia: Energy balance – import, export, energy supply for solid, liquid and gaseous fuels. A joint questionnaire, communicated annually by SORS and EUROSTAT, for data on the import of fuels by countries.
Data administrator: Statistical Office of the Republic of Slovenia.
Date of acquisition for this indicator: 10 November 2012.
Methodology and frequency of data collection: The data were prepared on an annual basis. For the previous year, the data are available at the end of the current year.
Data processing methodology: The import dependence on fuel is calculated as a quotient of the import of fuel and the fuel supply at the level of Slovenia.
The import dependence at the state level is calculated as a quotient of the sum of imported fossil fuels and total energy supply at the state level.
The annual growth for the indicator is sometimes shown in percentage points. A percentage point is a unit used for the comparison of different rates of growth. A percentage point includes an absolute comparison calculated by the formula (nthis year)–(nlast year)=16 %–15 %=1 % (for instance: if last year the growth was 15 % and this year 16 %, then this year the growth was higher by 1 percentage point). The difference in growth can also be expressed in a relative comparison using the formula [(nthis year/nlast year)*100]–100=[(16 %/15 %)*100]–100=6.7 %, where the growth is indicated in percentages.
Information concerning data quality:
- Advantages and disadvantages of the indicator: The basic source of information is one institution (SORS, EUROSTAT) for the entire time series. This enables a more qualitative analysis of the events in the considered period.
- Relevance, accuracy, robustness, uncertainty:
Reliability of the indicator (archive data): The indicator is reliable.
Uncertainty of the indicator (scenarios/projections): Scenarios and projections are not available.
- Overall assessment (1 = no major comments, 2 = data to be considered with reservation):
Relevance: 1
Accuracy: 1
Completeness over time: 2
Completeness over space: 1
Other sources and literature:
- Wikipedia, 2012a. Nord Stream.
- Wikipedia, 2012b. Nabucco pipeline.
- Wikipedia, 2012c. South Stream.


