[VD08] Drinking water quality 

Key message

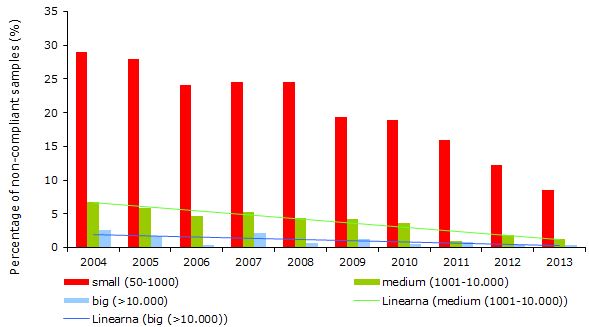
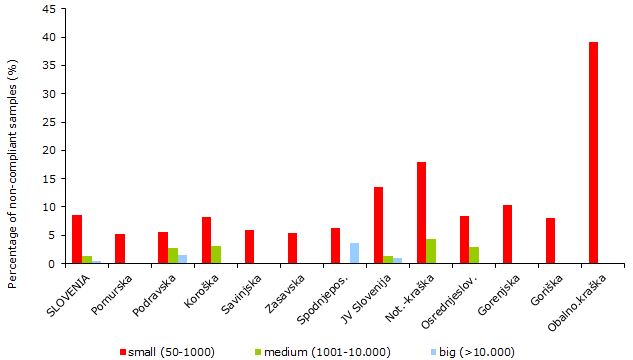
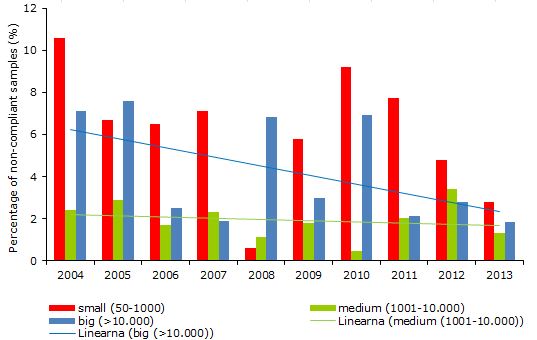
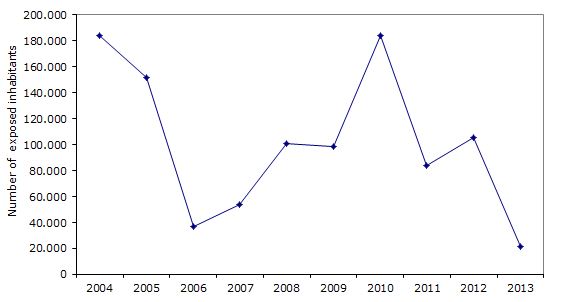
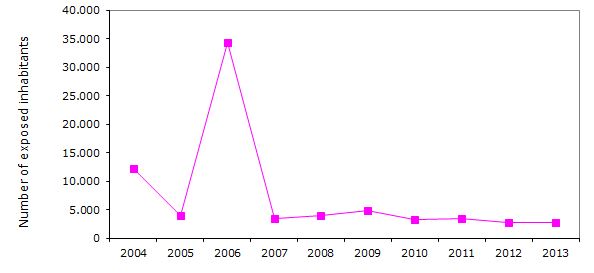
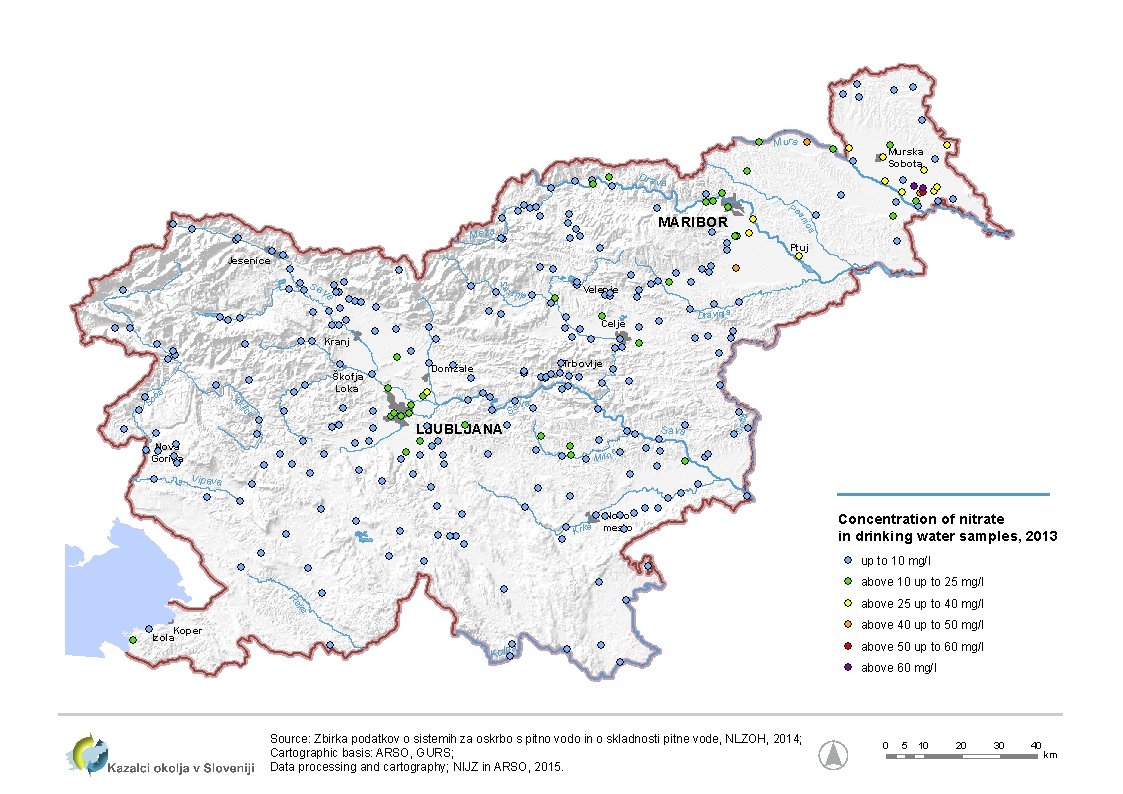
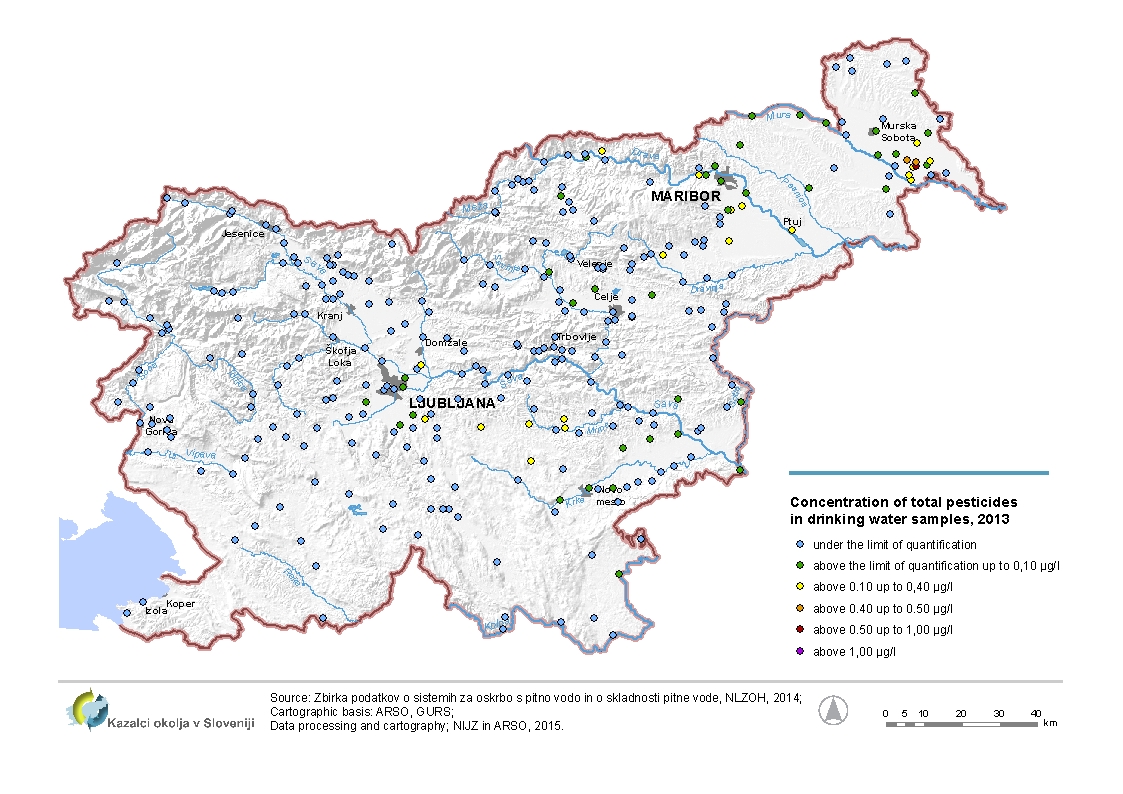
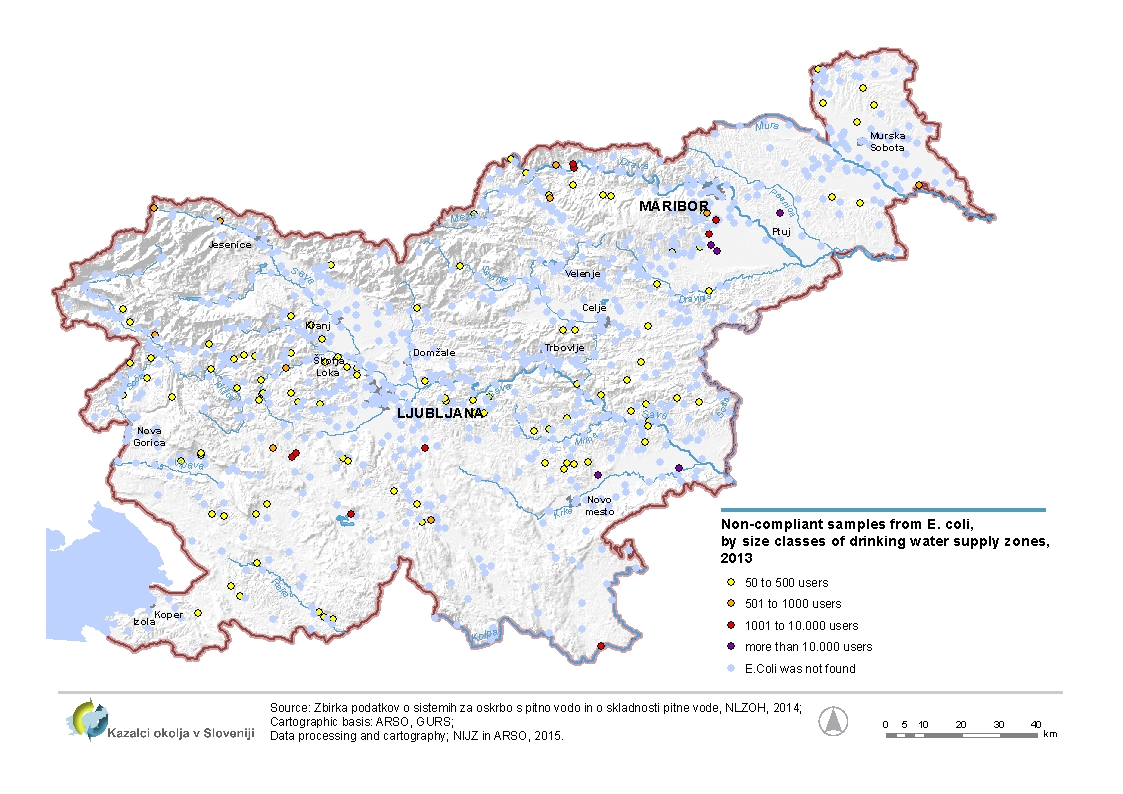
Larger supply zones in general have adequate drinking water quality. From a preventive health point of view, because of the frequent or permanent faecal contamination, the most problematic small supply zones, serving the residents 50-1000 (especially 50-500, serving around 100,000 residents) and supply zones with surface water, among which are also included the karst sources of drinking water. The samples results of chemical parameters indicate contamination of drinking water with pesticides and nitrates. The monitoring of drinking water does not include systems for drinking water supply serving less than 50 persons (about 150,000 residents). Audit monitoring to determine chemical parameters were not carried out for around 248,000 residents. The quality of drinking water in the period 2004-2013 has improved slightly.
Charts
IVZ RS, 2005 - 2008; ZZV MB, 2009-2013; NLZOH, 2014
| 6,7 | 5,8 | 4,6 | 5,3 | 4,44711538461539 | 4,26829268292683 | 3,67647058823529 | 1 | 1,8 | 1,33333333333333 | ||
|---|---|---|---|---|---|---|---|---|---|---|---|
| total | % | 19 | 18.4 | 10.3 | 10.9 | 10.2974828375 | 8.45207253886 | 9.04638432728 | 7.6 | 6.7 | 4.33871932974 |
| 9 | 675 | ||||||||||
| total | % | 145 | 3342 |
IVZ RS, 2005 - 2008; ZZV MB, 2009-2013; NLZOH, 2014
| SLOVENIA | Pomurska | Podravska | Koroška | Savinjska | Zasavska | Spodnjepos. | JV Slovenija | Not.-kraška | Osrednjeslov. | ||
|---|---|---|---|---|---|---|---|---|---|---|---|
| small (50-1000) | nmb. | 8.6 | 5.3 | 5.5 | 8.3 | 5.9 | 5.4 | 6.3 | 13.5 | 17.9 | 8.5 |
| medium (1001-10.000) | % | 1.3 | - | 2.8 | 3.1 | - | - | - | 1.4 | 4.3 | 2.9 |
| big (>10.000) | nmb. | 0.4 | - | 1.4 | - | - | - | 3.7 | 1 | - | - |
| total | nmb. | 4.3 | 2.9 | 2.7 | 6.5 | 2.8 | 2.8 | 5 | 5.9 | 8.7 | 3.3 |
| Gorenjska | Goriška | Obalno.kraška | |||||||||
| small (50-1000) | nmb. | 10.4 | 8.1 | 39.1 | |||||||
| medium (1001-10.000) | % | - | - | - | |||||||
| big (>10.000) | nmb. | - | - | - | |||||||
| total | nmb. | 5 | 5.4 | 9.2 |
IVZ RS, 2005 - 2008; ZZV MB, 2009-2013; NLZOH, 2014
IVZ RS, 2005 - 2008; ZZV MB, 2009-2013; NLZOH 2014.
| 2004 | 2005 | 2006 | 2007 | 2008 | 2009 | 2010 | 2011 | 2012 | 2013 | ||
|---|---|---|---|---|---|---|---|---|---|---|---|
| µg/l | 0.2 | 0.2 | 0.2 | 0.3 | 0.2 | 0.2 | 0.2 | 0.2 | 0.2 | 0.2 | |
| µg/l | - | 1 | 1.4 | 0.5 | 0.4 | 0.4 | 0.1 | 0.1 | |||
| µg/l | - | - | - | - | - | - | 0.2 | ||||
| µg/l | 0.3 | 0.3 | 0.4 | 0.3 | 0.3 | 0.3 | 0.4 | 0.4 | 0.2 | 0.6 | |
| µg/l | - | - | - | - | - | 0.2 | - | ||||
| µg/l | 0.3 | - | - | - | - | - | - | ||||
| µg/l | - | - | - | - | - | - | 0.1 | ||||
| µg/l | - | 0.2 | - | - | - | - | - | ||||
| µg/l | - | 0.6 | - | - | 0.1 | 0.7 | - | 0.1 | 0.2 | ||
| µg/l | - | - | - | - | 0.1 | - | - | ||||
| µg/l | - | - | - | 0.2 | - | - | - | ||||
| µg/l | - | 0.5 | - | - | - | - | - | 0.2 | |||
| µg/l | - | - | - | - | - | - | - | 0.1 | |||
| µg/l | - | 0.9 | 1.4 | 0.6 | 0.7 | 0.7 | 0.6 | - | 0.6 | ||
| 183881 | 151297 | 36999 | 53544 | 100689 | 98611 | 183690 | 83996 | 105443 | 21686 |
IVZ RS, 2005 - 2008; ZZV MB, 2009-2013; NLZOH, 2014.
Zbirka podatkov o sistemih za oskrbo s pitno vodo in o skladnosti pitne vode, Nacionalni laboratorij za zdravje, okolje in hrano (NLZOH), 2014; podlage Agencija RS za okolje, GURS; Obdelava: Nacionalni inštitut za javno zdravje in Agencija RS za okolje, 2015
Zbirka podatkov o sistemih za oskrbo s pitno vodo in o skladnosti pitne vode, Nacionalni laboratorij za zdravje, okolje in hrano (NLZOH), 2014; podlage Agencija RS za okolje, GURS; Obdelava: Nacionalni inštitut za javno zdravje in Agencija RS za okolje, 2015.
Zbirka podatkov o sistemih za oskrbo s pitno vodo in o skladnosti pitne vode, Nacionalni laboratorij za zdravje, okolje in hrano (NLZOH), 2014; podlage Agencija RS za okolje, GURS; Obdelava: Nacionalni inštitut za javno zdravje in Agencija RS za okolje, 2015.


