[ZD05] Access to safe drinking water

Key message

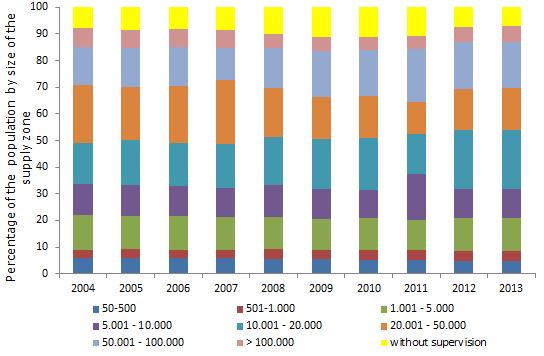
In Slovenia, in 2013, 93 % of the population was supplied from drinking water supply systems, which was conducted quality monitoring of drinking water at the point of use, at the tap of user. The quality of drinking water is unknown for about 7 % of the Slovenian residents; these are supplied less than 50 persons (eg. their individual/own sources of drinking water, rainwater), or for other reasons were not included in the monitoring (eg. an incomplete recovery). In the cities, all the residents supplying with drinking water at which monitoring is carried out. Access to safe drinking water in the period 2004-2013 has improved slightly.
Charts
IVZ, 2005-2008; ZZV MB, 2009-2013 ; NLZOH, 2014
| 2004 | 2005 | 2006 | 2007 | 2008 | 2009 | 2010 | 2011 | 2012 | 2013 | ||
|---|---|---|---|---|---|---|---|---|---|---|---|
| 50-500 | No. | 119622 | 120712 | 115467 | 115692 | 111761 | 110155 | 104785 | 103307 | 100230 | 99464 |
| 501-1.000 | No. | 60545 | 63495 | 63881 | 65618 | 73197 | 74009 | 79237 | 75845 | 78483 | 74297 |
| 1.001 - 5.000 | No. | 257466 | 249602 | 252175 | 249523 | 248623 | 236644 | 241403 | 231986 | 253814 | 258608 |
| 5.001 - 10.000 | No. | 237706 | 233540 | 229876 | 220533 | 236392 | 227033 | 218627 | 358774 | 220651 | 223251 |
| 10.001 - 20.000 | No. | 304223 | 334488 | 323988 | 334102 | 369044 | 381635 | 396784 | 306982 | 454777 | 454777 |
| 20.001 - 50.000 | No. | 431573 | 403647 | 431688 | 481406 | 373443 | 324145 | 324145 | 246601 | 321241 | 323921 |
| 50.001 - 100.000 | No. | 292000 | 292000 | 292000 | 241000 | 300494 | 353743 | 353774 | 406507 | 357657 | 357657 |
| > 100.000 | No. | 137000 | 137000 | 137000 | 137000 | 104600 | 104600 | 104600 | 104600 | 118700 | 118700 |
| without supervision | No. | 156869 | 166630 | 162441 | 174532 | 205075 | 230371 | 225906 | 217894 | 150709 | 148145 |
| 50-500 | % | 6 | 6 | 5.7 | 5.7 | 5.5 | 5.4 | 5.1 | 5 | 4.9 | 4.8 |
| 501-1.000 | % | 3 | 3.2 | 3.2 | 3.2 | 3.6 | 3.6 | 3.9 | 3.7 | 3.8 | 3.6 |
| 1.001 - 5.000 | % | 12.9 | 12.5 | 12.6 | 12.4 | 12.3 | 11.6 | 11.8 | 11.3 | 12.3 | 12.6 |
| 5.001 - 10.000 | % | 11.9 | 11.7 | 11.4 | 10.9 | 11.7 | 11.1 | 10.7 | 17.5 | 10.7 | 10.8 |
| 10.001 - 20.000 | % | 15.2 | 16.7 | 16.1 | 16.5 | 18.2 | 18.7 | 19.4 | 15 | 22.1 | 22.1 |
| 20.001 - 50.000 | % | 21.6 | 20.2 | 21.5 | 23.8 | 18.5 | 15.9 | 15.8 | 12 | 15.6 | 15.7 |
| 50.001 - 100.000 | % | 14.6 | 14.6 | 14.5 | 11.9 | 14.9 | 17.3 | 17.3 | 19.8 | 17.4 | 17.4 |
| > 100.000 | % | 6.9 | 6.8 | 6.8 | 6.8 | 5.2 | 5.1 | 5.1 | 5.1 | 5.8 | 5.8 |
| without supervision | % | 7.9 | 8.3 | 8.1 | 8.6 | 10.1 | 11.3 | 11 | 10.6 | 7.3 | 7.2 |
IVZ, 2005-2008; ZZV MB, 2009-2013; NLZOH, 2014
| 2004 | 2005 | 2006 | 2007 | 2008 | 2009 | 2010 | 2011 | 2012 | 2013 | ||
|---|---|---|---|---|---|---|---|---|---|---|---|
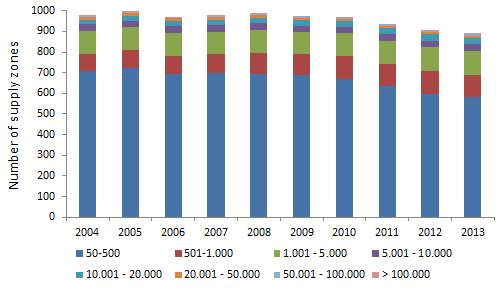
| 50-500 | No. | 706 | 721 | 692 | 697 | 695 | 688 | 669 | 634 | 597 | 583 |
| 501-1.000 | No. | 85 | 90 | 90 | 91 | 102 | 102 | 113 | 108 | 111 | 105 |
| 1.001 - 5.000 | No. | 112 | 109 | 111 | 111 | 110 | 105 | 108 | 111 | 115 | 118 |
| 5.001 - 10.000 | No. | 32 | 32 | 32 | 31 | 33 | 33 | 32 | 33 | 32 | 32 |
| 10.001 - 20.000 | No. | 22 | 24 | 23 | 24 | 26 | 27 | 28 | 28 | 31 | 31 |
| 20.001 - 50.000 | No. | 15 | 14 | 15 | 16 | 13 | 12 | 12 | 11 | 11 | 11 |
| 50.001 - 100.000 | No. | 4 | 4 | 4 | 3 | 4 | 5 | 5 | 5 | 5 | 5 |
| > 100.000 | No. | 1 | 1 | 1 | 1 | 1 | 1 | 1 | 1 | 1 | 1 |
| No. | 977 | 995 | 968 | 974 | 984 | 973 | 968 | 931 | 903 | 886 |
NLZOH, 2014
| Slovenija | Pomurska | Podravska | Koroška | Savinjska | Zasavska | Spodnjeposavska | JV Slovenija | Notranjsko-kraška | Osrednjeslovenska | ||
|---|---|---|---|---|---|---|---|---|---|---|---|
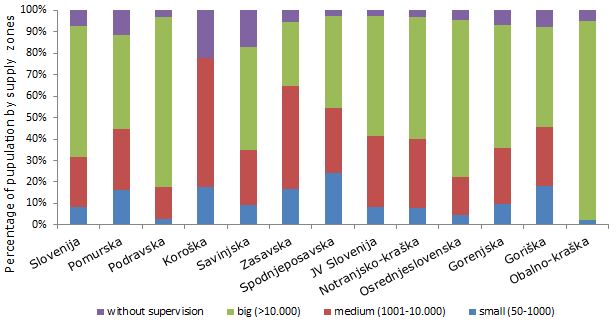
| small (50-1000) | % | 8.44 | 16.231 | 2.726 | 17.458 | 9.148 | 16.696 | 24.066 | 8.2 | 8 | 4.83 |
| medium (1001-10.000) | % | 23.405 | 28.667 | 15.158 | 60.54 | 25.898 | 48.083 | 30.232 | 33.038 | 31.742 | 17.647 |
| big (>10.000) | % | 60.96 | 43.743 | 79.199 | 0 | 47.711 | 29.884 | 42.958 | 56.252 | 57.056 | 72.812 |
| without supervision | % | 7.196 | 11.36 | 2.917 | 22.003 | 17.243 | 5.338 | 2.745 | 2.51 | 3 | 4.712 |
| Gorenjska | Goriška | Obalno-kraška | |||||||||
| small (50-1000) | % | 9.573 | 18.08 | 2.048 | |||||||
| medium (1001-10.000) | % | 26 | 27.74 | 0 | |||||||
| big (>10.000) | % | 57.083 | 46.378 | 92.91 | |||||||
| without supervision | % | 7 | 7.802 | 5.042 |
NLZOH, 2014


