[SE08] Ecological footprint

Key message

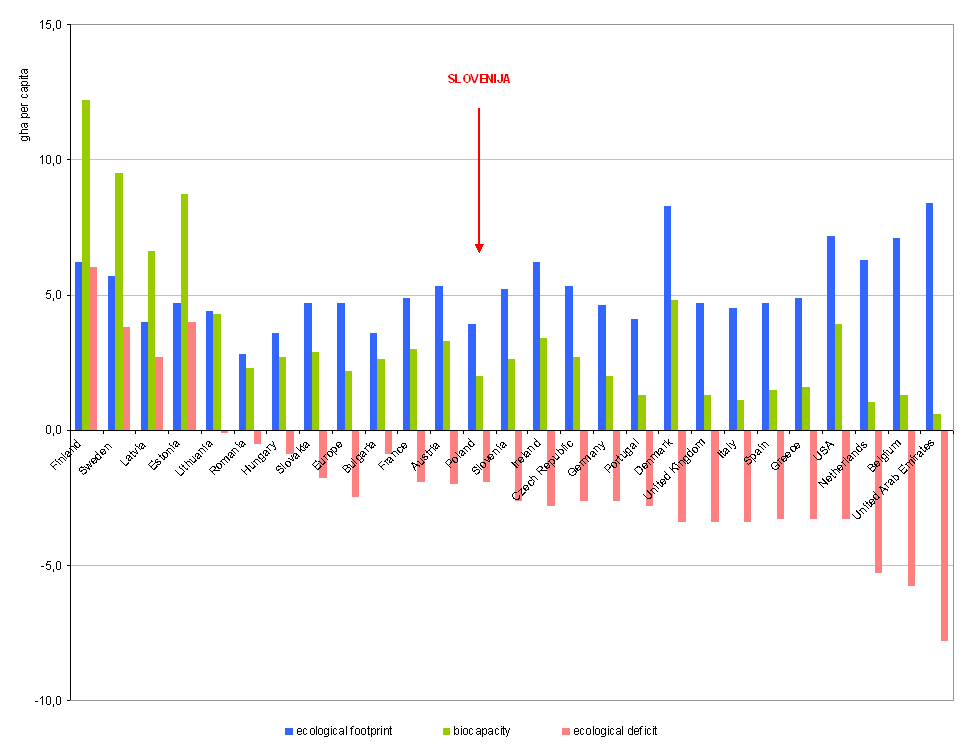
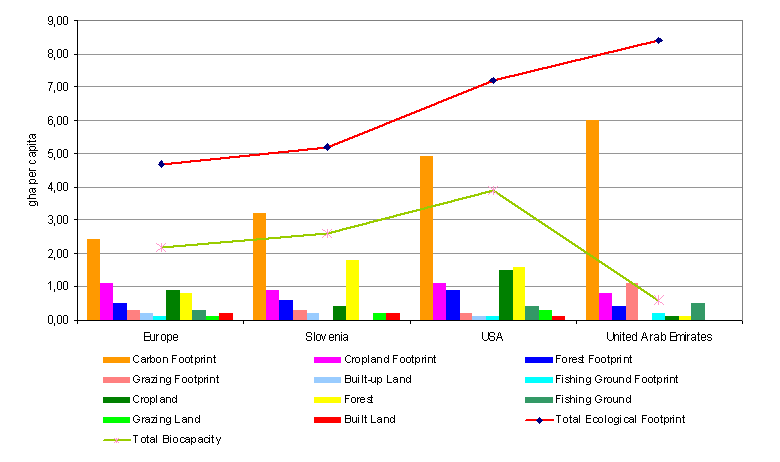
Slovenia’s ecological footprint is not kept within acceptable limits, which causes an imbalance between demand (for food, fuels, wood and fibres) and biological self-regeneration capacity. With an ecological footprint of 5.2 gha/per capita, Slovenia exceeds the EU average of 4.7 gha/per capita. Demand is almost twice as high as the biological capacity, with overuse of non-renewable energy sources (fossil fuels) in the energy sector being the main cause of environmental impacts.
Definition
This indicator shows the ecological footprint, biocapacity and environmental deficit in Slovenia, some European countries, the USA and the United Arab Emirates. The ecological footprint, biocapacity and environmental deficit are expressed in a standardised unit of biologically productive area, i.e. global hectare (gha) per capita.
An ecological footprint is a land area required by a population to sustain its way of life. Carbon dioxide emissions and ocean surface area are part of the footprint. An ecological footprint compares biologically productive areas with all available areas, including the sea. The complexity of the ecological footprint and aspects that are taken into account in its calculation are presented in the figure below.
Source: GFN, Footprint for Nations, 2011
Biocapacity represents the area of land or sea that is required for the production of food, fibres and wood and for absorption of carbon dioxide and is capable of self-regeneration. Considering that each global hectare generates an equal amount of biological value, productivity of a global hectare equals the average productivity of the entire global biologically productive area. In this calculation, only the current productivity of the biosphere is taken into account (without its reduction from potential degradation, which will be reflected in reduced biocapacity in the future).
Environmental deficit is a value calculated as the difference between the ecological footprint and biocapacity or biological capacity. By using the ecological footprint calculation, we can estimate how many planets would be required for the survival of the current global population when the current quality of life, current development of technology and bioproductive capacity of the earth are taken into account.
Ecological footprint is an indicator of sustainable development. The European Commission presented it to the European Parliament within the framework of revising the sustainable development strategy (June 2005), primarily with the intention of emphasising its importance in monitoring the environmental component of development. Since ecological footprint does not consider water, which is used excessively by the entire global population, as a renewable natural resource, the need to calculate a water footprint emerged in 2002. Ecological and water footprints represent part of the information essential to planning sustainable development. Therefore, they can be used as indicators that complement each other as they reflect the sustainability of global consumption, thus essentially affecting the value of natural capital.
Charts
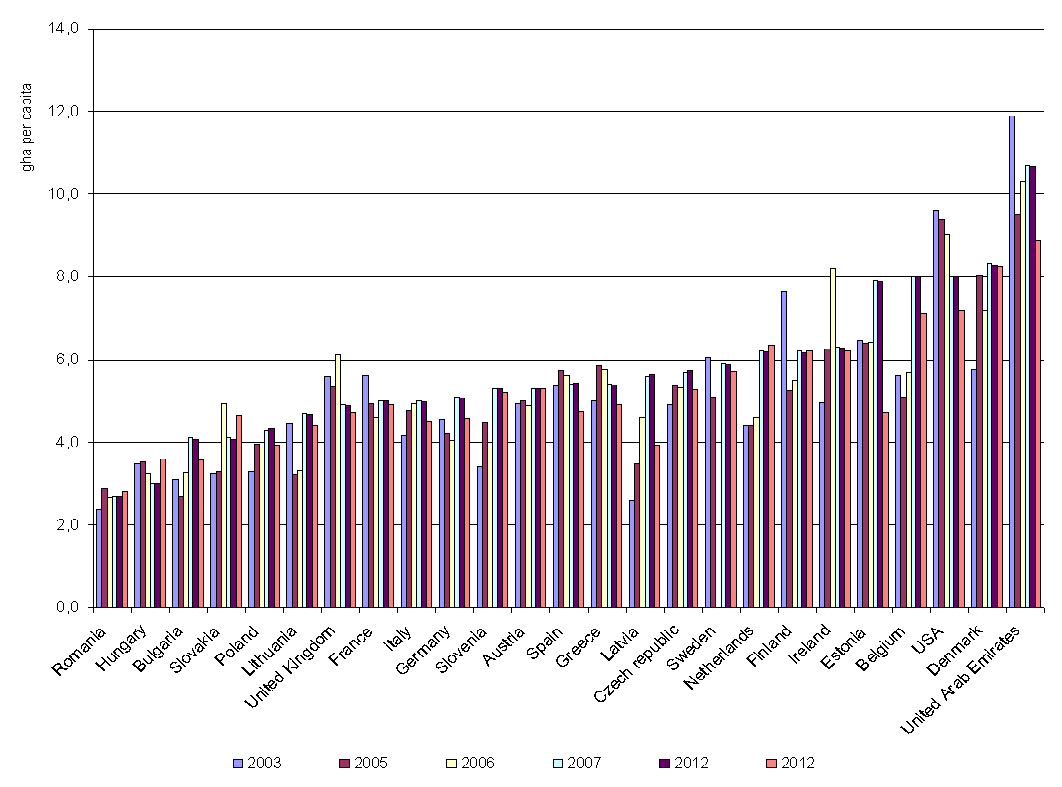
GFN, Footprint for Nations, 2013
| Romania | Hungary | Bulgaria | Slovakia | Poland | Lithuania | United Kingdom | France | italy | Germany | ||
|---|---|---|---|---|---|---|---|---|---|---|---|
| 2003 | gha per capita | 2.4 | 3.5 | 3.1 | 3.2 | 3.3 | 4.4 | 5.6 | 5.6 | 4.2 | 4.5 |
| 2005 | gha per capita | 2.9 | 3.5 | 2.7 | 3.3 | 4 | 3.2 | 5.3 | 4.9 | 4.8 | 4.2 |
| 2006 | gha per capita | 2.7 | 3.2 | 3.3 | 4.9 | 3.9 | 3.3 | 6.1 | 4.6 | 4.9 | 4 |
| 2007 | gha per capita | 2.7 | 3 | 4.1 | 4.1 | 4.3 | 4.7 | 4.9 | 5 | 5 | 5.1 |
| Slovenia | Austria | Spain | Greece | Latvia | Czech republic | Sweden | Netherlands | Finland | Ireland | ||
| 2003 | gha per capita | 3.4 | 4.9 | 5.4 | 5 | 2.6 | 4.9 | 6.1 | 4.4 | 7.6 | 5 |
| 2005 | gha per capita | 4.5 | 5 | 5.7 | 5.9 | 3.5 | 5.4 | 5.1 | 4.4 | 5.2 | 6.3 |
| 2006 | gha per capita | 3.9 | 4.9 | 5.6 | 5.8 | 4.6 | 5.3 | np | 4.6 | 5.5 | 8.2 |
| 2007 | gha per capita | 5.3 | 5.3 | 5.4 | 5.4 | 5.6 | 5.7 | 5.9 | 6.2 | 6.2 | 6.3 |
| Estonia | Belgium | USA | Denmark | United Arab Emirates | |||||||
| 2003 | gha per capita | 6.5 | 5.6 | 9.6 | 5.8 | 11.9 | |||||
| 2005 | gha per capita | 6.4 | 5.1 | 9.4 | 8 | 9.5 | |||||
| 2006 | gha per capita | 6.4 | 5.7 | 9 | 7.2 | 10.3 | |||||
| 2007 | gha per capita | 7.9 | 8 | 8 | 8.3 | 10.7 |
GFN, Footprint for Nations, 2013
| Finland | Sweden | Latvia | Estonia | Lithuania | Romania | Hungary | Slovakia | Europe | Bulgaria | ||
|---|---|---|---|---|---|---|---|---|---|---|---|
| ecological footprint | gha per capita | 6.2 | 5.9 | 5.6 | 7.9 | 4.7 | 2.7 | 3 | 4.1 | 4.7 | 4.1 |
| biocapacity | gha per capita | 12.5 | 9.7 | 7.1 | 9 | 4.4 | 2 | 2.2 | 2.7 | 2.9 | 2.1 |
| ecological deficit | gha per capita | 6.3 | 3.9 | 1.4 | 1.1 | -0.3 | -0.8 | -0.8 | -1.4 | -1.8 | -1.9 |
| France | Austria | Poland | Slovenia | Ireland | Czech Republic | Germany | Portugal | Denmark | United Kingdom | ||
| ecological footprint | gha per capita | 5 | 5.3 | 4.3 | 5.3 | 6.3 | 5.7 | 5.1 | 4.5 | 8.3 | 4.9 |
| biocapacity | gha per capita | 3 | 3.3 | 2.1 | 2.6 | 3.5 | 2.7 | 1.9 | 1.3 | 4.9 | 1.3 |
| ecological deficit | gha per capita | -2 | -2 | -2.3 | -2.7 | -2.8 | -3.1 | -3.2 | -3.2 | -3.4 | -3.6 |
| Italy | Spain | Greece | USA | Netherlands | Belgium | United Arab Emirates | |||||
| ecological footprint | gha per capita | 5 | 5.4 | 5.4 | 8 | 6.2 | 8 | 10.7 | |||
| biocapacity | gha per capita | 1.1 | 1.6 | 1.6 | 3.9 | 1 | 1.3 | 0.8 | |||
| ecological deficit | gha per capita | -3.8 | -3.8 | -3.8 | -4.1 | -5.2 | -6.7 | -9.8 |
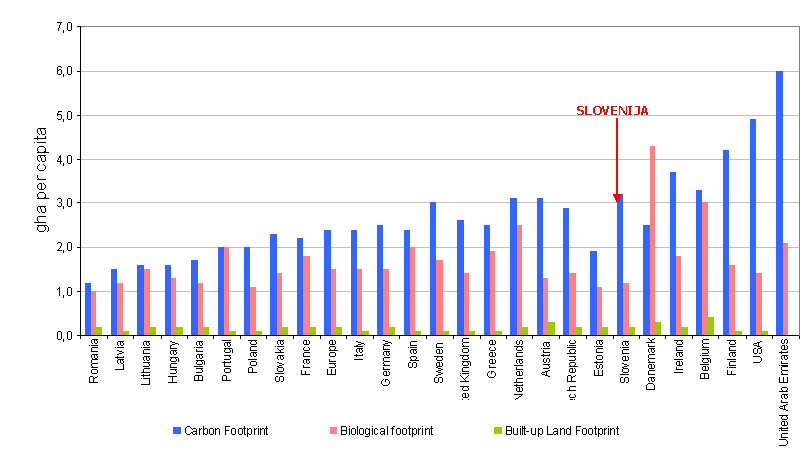
GFN, Footprint for Nations, 2013
| Romania | Latvia | Lithuania | Hungary | Bulgaria | Portugal | Poland | Slovakia | France | Europe | ||
|---|---|---|---|---|---|---|---|---|---|---|---|
| Biological Footprint | gha per capita | 1.32 | 1.43 | 1.65 | 1.66 | 1.73 | 2.07 | 2.26 | 2.3 | 2.51 | 2.54 |
| Carbon Footprint | gha per capita | 1.29 | 4.14 | 2.81 | 1.19 | 2.24 | 2.34 | 2.01 | 1.6 | 2.26 | 2.02 |
| Built-up Land Footprint | gha per capita | 0.1 | 0.07 | 0.2 | 0.14 | 0.11 | 0.06 | 0.09 | 0.15 | 0.24 | 0.12 |
| Italy | Germany | Spain | Sweden | United Kingdom | Greece | Netherlands | Austria | Czech Republic | Estonia | ||
| Biological Footprint | gha per capita | 2.66 | 2.7 | 2.73 | 2.73 | 2.87 | 2.92 | 2.99 | 3.13 | 3.27 | 3.3 |
| Carbon Footprint | gha per capita | 2.23 | 2.19 | 2.62 | 3.04 | 1.88 | 2.37 | 3.05 | 1.91 | 2.3 | 4.39 |
| Built-up Land Footprint | gha per capita | 0.1 | 0.19 | 0.07 | 0.11 | 0.15 | 0.11 | 0.15 | 0.26 | 0.17 | 0.19 |
| Slovenia | Danemark | Ireland | Belgium | Finland | USA | United Arab Emirates | |||||
| Biological Footprint | gha per capita | 3.42 | 3.47 | 3.72 | 3.87 | 4.31 | 5.57 | 8.1 | |||
| Carbon Footprint | gha per capita | 1.72 | 4.52 | 2.4 | 3.68 | 1.74 | 2.35 | 2.54 | |||
| Built-up Land Footprint | gha per capita | 0.16 | 0.27 | 0.17 | 0.45 | 0.11 | 0.07 | 0.04 |
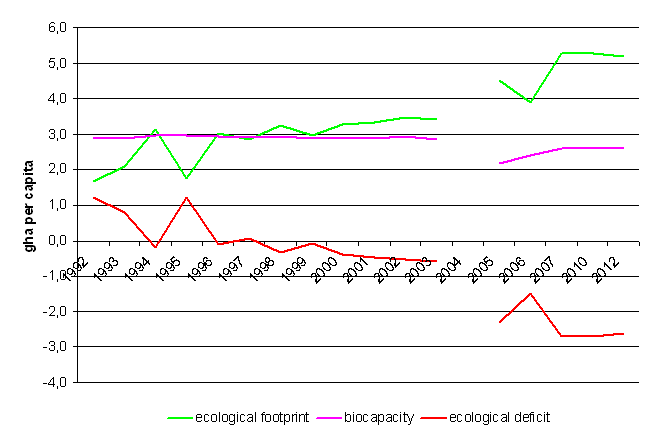
GFN, Footprint for Nations, 2013
| 1992 | 1993 | 1994 | 1995 | 1996 | 1997 | 1998 | 1999 | 2000 | 2001 | ||
|---|---|---|---|---|---|---|---|---|---|---|---|
| ecological footprint | gha per capita | 1.7 | 2.1 | 3.2 | 1.7 | 3 | 2.8 | 3.3 | 3 | 3.3 | 3.3 |
| biocapacity | gha per capita | 2.9 | 2.9 | 3 | 3 | 2.9 | 2.9 | 2.9 | 2.9 | 2.9 | 2.9 |
| ecological deficit | gha per capita | 1.2 | 0.8 | -0.2 | 1.2 | -0.1 | 0.1 | -0.3 | -0.1 | -0.4 | -0.4 |
| 2002 | 2003 | 2004 | 2005 | 2006 | 2007 | ||||||
| ecological footprint | gha per capita | 3.5 | 3.4 | 4.5 | 3.9 | 5.3 | |||||
| biocapacity | gha per capita | 2.9 | 2.8 | 2.2 | 2.4 | 2.6 | |||||
| ecological deficit | gha per capita | -0.5 | -0.6 | -2.3 | -1.5 | -2.7 |
GFN, Footprint for Nations, 2013
| 1992 | 1993 | 1994 | 1995 | 1996 | 1997 | 1998 | 1999 | 2000 | 2001 | ||
|---|---|---|---|---|---|---|---|---|---|---|---|
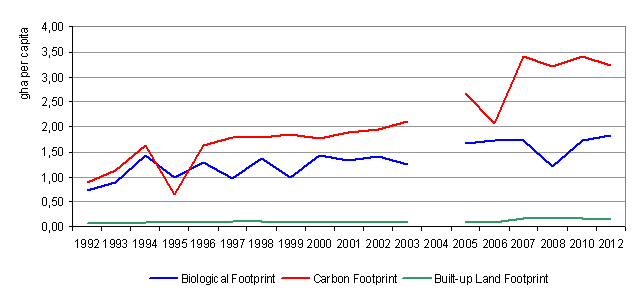
| Biological Footprint | gha per capita | 0.74 | 0.89 | 1.43 | 1 | 1.29 | 0.97 | 1.36 | 1 | 1.43 | 1.33 |
| Carbon Footprint | gha per capita | 0.88 | 1.13 | 1.63 | 0.65 | 1.63 | 1.79 | 1.8 | 1.86 | 1.78 | 1.9 |
| Built-up Land Footprint | gha per capita | 0.07 | 0.07 | 0.09 | 0.09 | 0.09 | 0.1 | 0.1 | 0.09 | 0.09 | 0.08 |
| Total Ecological Footprint | gha per capita | 1.69 | 2.09 | 3.15 | 1.74 | 3.01 | 2.86 | 3.26 | 2.95 | 3.3 | 3.31 |
| 2002 | 2003 | 2004 | 2005 | 2006 | 2007 | ||||||
| Biological Footprint | gha per capita | 1.42 | 1.24 | 1.67 | 1.73 | 1.72 | |||||
| Carbon Footprint | gha per capita | 1.95 | 2.1 | 2.68 | 2.07 | 3.42 | |||||
| Built-up Land Footprint | gha per capita | 0.1 | 0.07 | 0.11 | 0.09 | 0.16 | |||||
| Total Ecological Footprint | gha per capita | 3.47 | 3.42 | 4.46 | 3.89 | 5.3 |
GFN, Footprint for Nations, 2013
| Europe | Slovenia | USA | United Arab Emirates | ||
|---|---|---|---|---|---|
| Cropland Footprint | gha per capita | 1.06 | 1 | 1.08 | 1.35 |
| Grazing Footprint | gha per capita | 0.19 | 0.15 | 0.14 | 0.43 |
| Forest Footprint | gha per capita | 0.55 | 0.5 | 1.03 | 0.47 |
| Fishing Ground Footprint | gha per capita | 0.22 | 0.07 | 0.1 | 0.29 |
| Carbon Footprint | gha per capita | 2.54 | 3.42 | 5.57 | 8.1 |
| Built-up Land | gha per capita | 0.12 | 0.16 | 0.07 | 0.04 |
| Total Ecological Footprint | gha per capita | 4.7 | 5.3 | 8 | 10.7 |
| Cropland | gha per capita | 0.89 | 0.38 | 1.58 | 0.09 |
| Grazing Land | gha per capita | 0.18 | 0.24 | 0.26 | 0 |
| Forest | gha per capita | 1.46 | 1.83 | 1.55 | 0.09 |
| Fishing Ground | gha per capita | 0.25 | 0 | 0.41 | 0.63 |
| Built Land | gha per capita | 0.12 | 0.16 | 0.07 | 0.04 |
| Total Biocapacity | gha per capita | 2.9 | 2.6 | 3.9 | 0.8 |
Goals
- To protect the Earth's biocapacity in order to preserve the quality and diversity of life, while limiting the use of natural resources;
- to reduce the environmental deficit of the planet and consequently pressures on the environment;
- to prevent and reduce environmental pollution and to encourage sustainable production and consumption in order to decouple economic growth from pressures on the environment (transport, energy, construction, use of natural resources);
- to use resources more efficiently and to reduce the environmental intensity of consumption per inhabitant.
Comment
The global ecological footprint has increased from 1.7 gha per capita in 1961 (first calculation) to 2.7 gha per capita in 2012 (latest available data). The increase can be largely attributed to a greater carbon footprint, which is a consequence of increasing use of energy per capita. The countries with the greatest ecological footprint are United Arab Emirates (8.7 gha/capita), Denmark (8.3 gha/capita) and USA (8 gha/capita). Assuming that the biocapacity or biological capacity of our planet is 1.8 gha/capita, the global ecological footprint in 2008 exceeded the global biocapacity by 0.9 gha/capita or by approximately half the Earth's biological capacity. Therefore, the ecological deficit has been increasing since the 1970s. An increasing ecological deficit means that natural capital is used faster than it is capable of replenishing itself, resulting in the decreasing biocapacity of the planet in the long run.
Although Europe is the smallest continent, its contribution to the ecological footprint is considerable due to high population density and consumption per capita. In 2008, the ecological footprint doubled when compared to 1961 when demand almost equalled biocapacity. The ecological footprint of Europe in 2008 (4.7 gha/capita) exceeded its biological capacity (3 gha/capita). This means that the current consumption rate in Europe is too high to allow the demand to be met with the available resources. Therefore, Europe depends on import from other parts of the world.
The greatest contributor to the ecological footprint in 2008 was the carbon footprint, followed by the biological resources footprint (agricultural land, forests, pastures and fishing grounds) and the infrastructure footprint (built-up areas). In Denmark, Estonia and Belgium, the carbon and biological footprints are above 3 gha/capita. Most EU countries are in ecological deficit, except Finland, Sweden, Latvia and Estonia, where biocapacity is high due to extensive forest areas.
In 2012, Slovenia's ecological footprint (5.2 gha/capita) was above the European average. The ecological footprint of Slovenia had been fluctuating in the period 2003–2012, largely as a result of carbon footprint fluctuation. Compared to 1992, the ecological footprint increased by 3.5 gha/capita in 2012. From 1999 onwards, Slovenia has been in ecological deficit. In 1999, the ecological deficit in Slovenia amounted to 0.1 gha/capita, reaching 2.7 gha/capita by 2007. In the period 1992–2012, biological resources, carbon as well as the infrastructure footprints were increasing. The greatest growth was recorded in the carbon footprint, which reached 3.2 gha/capita in 2012, which is almost 4-times more than in 1992. As we can see, carbon started to gradually decline after 2010, when it amounted to 3.4 gha/capita.
The ecological footprint indicates that environmental problems cannot be studied and addressed individually, as the use of natural resources is a global problem. The key question is to what extent can Europe rely on natural resources from outside, considering the fact that the demand for natural resources is constantly increasing. Namely, their consumption doubles their self-regeneration capacity. Food demand will undoubtedly accelerate the development of new agricultural and building land. Due to intensification of agriculture, increased pressures on water resources and soils can be expected, while abandonment of agriculture in areas with poorer soils can result in abandonment of land under extensive cultivation and the decline of biodiversity. Nevertheless, the advantage of such processes includes a higher capacity to provide the ecosystemic function of forests (carbon sequestration). Due to clear links between the use of agricultural land and global trends in agriculture, which are in close correlation with environmental trends, agricultural and environmental policies will need to be revised more thoroughly in the future.
Slovenia has great physical-geographic and environmental capacities as well as diverse and sufficiently preserved natural capital, which we must continue to preserve in the future. One of the ways to enable its preservation is through the reduction of our ecological footprint, which can be achieved through, among other things, greater self-sufficiency and import of raw materials, food and energy (Plut, 2009). Thus, prudent management of natural capital and ecosystemic services offers, more than ever, the benefit of addressing many environmental priority issues and connecting many economic activities that affect them.
The ecological footprint is predicted to become a key indicator of sustainable development and a basis for decision-making in all fields, particularly within national governments. Therefore, national footprint accounts are very important. Countries that manage and keep records of availability of biological productivity within their boundaries, while monitoring their own consumption, will have an advantage over other countries due to increasingly limited resources. The ecological footprint is thus becoming one of the most globally successful and widely used communication, educational and policy-planning tools.


