[ZD15] Dietary intake of certain metals

Key message

The estimated average dietary intakes of metals (lead, cadmium, mercury) do not exceed the tolerable reference intakes. Metals in selected categories of food very rarely exceeded the limits set by law, but there are some occasional cases and such foods often originate from the more industrial polluted areas. Therefore, it is necessary to adopt regular monitoring programs for metals in foods and the appropriate long-term measures in the case of exceedances.
Definition
Charts
Poročila o izvajanju posameznih nalog, povezanih z uradnim nadzorom, ki ga izvajajo pristojni organi ( v letu 2013 Uprava RS za varno hrano, veterinarstvo in varstvo rastlin) za leta 2010, 2011, 2012 in 2013 in podatki SURS, Anketa o porabi živil 2010, 2012.
| 2010 | 2011 | 2012 | 2013 | ||
|---|---|---|---|---|---|
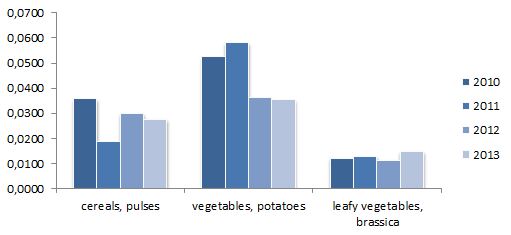
| cereals, pulses | µg/kg bw/day | 0 | 0 | 0 | 0 |
| vegetables, potatoes | µg/kg bw/day | 0.1 | 0.1 | 0 | 0 |
| leafy vegetables, brassica | µg/kg bw/day | 0 | 0 | 0 | 0 |
Poročila o izvajanju posameznih nalog, povezanih z uradnim nadzorom, ki ga izvajajo pristojni organi ( v letu 2013 Uprava RS za varno hrano, veterinarstvo in varstvo rastlin) za leta 2010, 2011, 2012 in 2013 in podatki SURS, Anketa o porabi živil 2010, 2012.
| 2010 | 2011 | 2012 | 2013 | ||
|---|---|---|---|---|---|
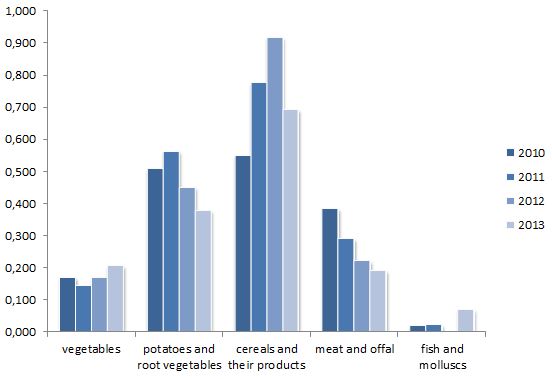
| vegetables | µg/kg bw/week | 0.17 | 0.15 | 0.17 | 0.21 |
| potatoes and root vegetables | µg/kg bw/week | 0.51 | 0.56 | 0.45 | 0.38 |
| cereals and their products | µg/kg bw/week | 0.55 | 0.78 | 0.92 | 0.69 |
| meat and offal | µg/kg bw/week | 0.38 | 0.29 | 0.22 | 0.19 |
| fish and molluscs | µg/kg bw/week | 0.02 | 0.02 | 0 | 0.07 |
Poročila o izvajanju posameznih nalog, povezanih z uradnim nadzorom, ki ga izvajajo pristojni organi ( v letu 2013 Uprava RS za varno hrano, veterinarstvo in varstvo rastlin) za leta 2010, 2011, 2012 in 2013 in podatki SURS, Anketa o porabi živil 2010, 2012.
| 2010 | 2011 | 2012 | 2013 | Average | ||
|---|---|---|---|---|---|---|
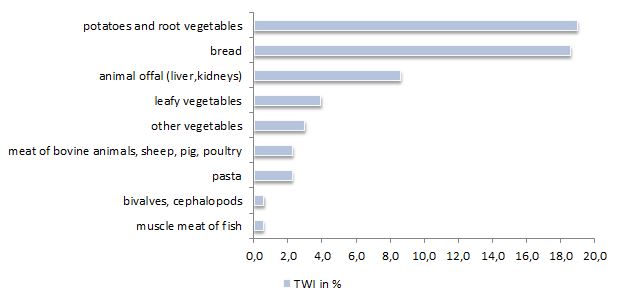
| muscle meat of fish | % | 0.235 | 0.235 | 0 | 1.69 | 0.54 |
| bivalves, cephalopods | % | 0.554 | 0.68 | 0 | 1.08 | 0.578 |
| pasta | % | 1.297 | 1.83 | 2.16 | 3.67 | 2.239 |
| meat of bovine animals, sheep, pig, poultry | % | 4.002 | 3.391 | 0 | 1.65 | 2.261 |
| other vegetables | % | 2.505 | 2.038 | 3.065 | 4.32 | 2.982 |
| leafy vegetables | % | 4.29 | 3.768 | 3.726 | 3.93 | 3.928 |
| animal offal (liver,kidneys) | % | 11.377 | 8.215 | 8.867 | 5.97 | 8.607 |
| bread | % | 12.37 | 17.455 | 20.605 | 24.01 | 18.61 |
| potatoes and root vegetables | % | 20.38 | 22.512 | 18.043 | 15.11 | 19.011 |
Poročila o izvajanju posameznih nalog, povezanih z uradnim nadzorom, ki ga izvajajo pristojni organi ( v letu 2013 Uprava RS za varno hrano, veterinarstvo in varstvo rastlin) za leta 2010, 2011, 2012 in 2013 in podatki SURS, Anketa o porabi živil 2010, 2012.
| µg Hg/week | µg Hg/kg bw/week | TWI share | ||
|---|---|---|---|---|
| Fish (fresh and frozen) | No. | 3.934 | 0.066 | 0.05 |
| Canned fish | No. | 4.302 | 0.072 | 0.055 |
WHO, Europe, Exposure of children to chemical hazards in food, Fact Sheet No.4.4, May 2007
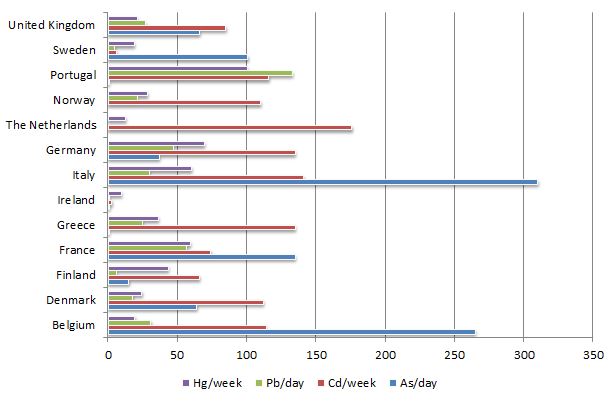
| As/day | Cd/week | Pb/day | Hg/week | ||
|---|---|---|---|---|---|
| Belgium | µg | 265 | 114 | 31 | 19.4 |
| Denmark | µg | 64 | 112 | 18 | 24.5 |
| Finland | µg | 15 | 66 | 6 | 43.4 |
| France | µg | 135 | 74.3 | 56.8 | 59.34 |
| Greece | µg | 0.045 | 135 | 25 | 36.19 |
| Ireland | µg | 0.97 | 2.73 | 1 | 9.59 |
| Italy | µg | 310 | 141 | 30 | 60.2 |
| Germany | µg | 37 | 135 | 47 | 69.37 |
| The Netherlands | µg | 176 | 12.6 | ||
| Norway | µg | 110 | 21 | 28.4 | |
| Portugal | µg | 0.001 | 116 | 133 | 100.66 |
| Sweden | µg | 101 | 6.4 | 5 | 18.9 |
| United Kingdom | µg | 66 | 85 | 27 | 21.14 |


