[PP14] Agricultural droughts

Key message

The frequency of agricultural drought in Slovenia has been increasing in recent decades. In the last twenty years, we have recorded 6 droughts that affected Slovenia at the scale of a natural disaster. Drought is occurring with increasing intensity and in areas and seasons where there have been no problems in the past. An additional risk for agricultural drought are rapidly developing droughts in summer ("flash droughts"), which occur especially during heat waves. Projections show that trend of increasing frequency and intensity of agricultural drought will continue in the future.pp
Charts
Slovenian Environment Agency, 2021 (14. 06. 2021)
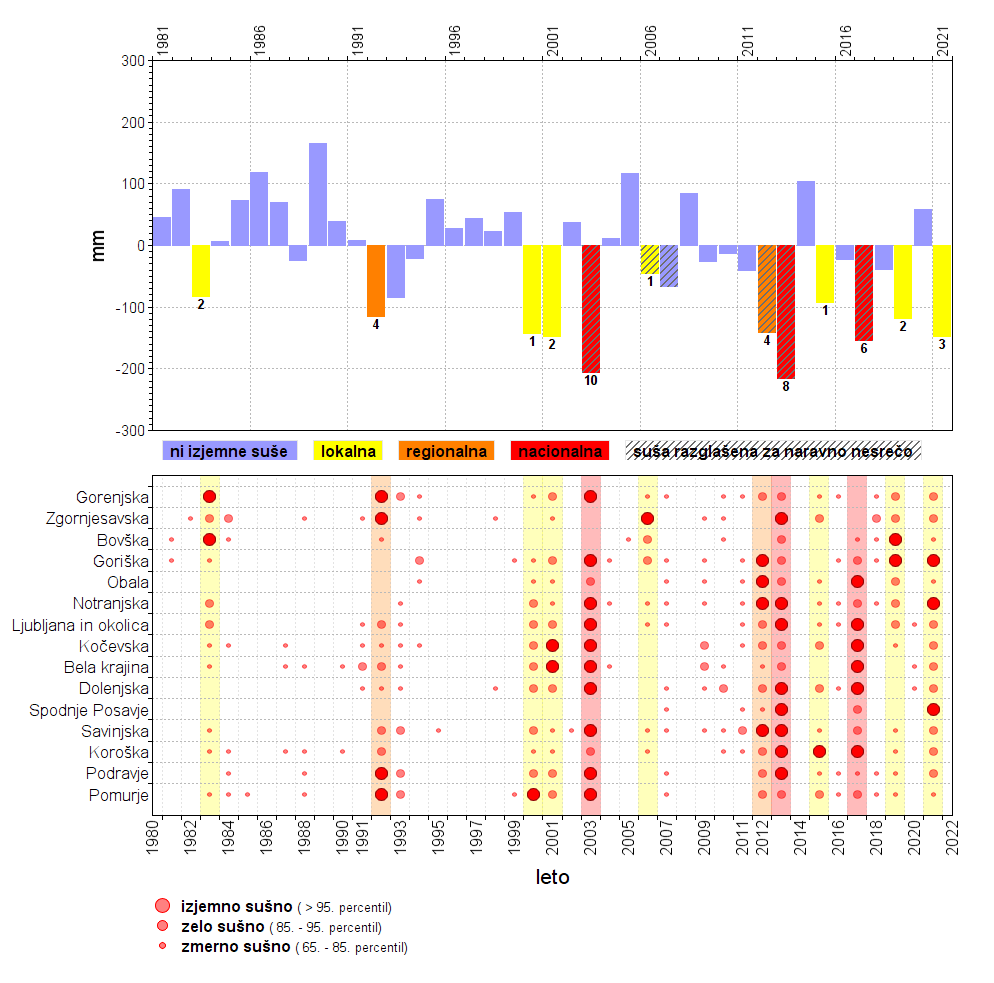
In the upper of the two graphs, the column size corresponds to values of average summer meteorological water balance for Slovenia in individual years, the number below the column represents the number of regions with extreme agricultural drought that year, the column colour indicates the spatial extent of extreme drought conditions in Slovenia, and the stripes are added on columns for years when drought was declared a natural disaster on the basis of Natural Disaster Recovery Act. The spatial dimension of exceptional agricultural drought does not necessarily coincide with the size of the average water balance deficit for Slovenia or the government declaration of drought as a national disaster. For example, in 2007 water balance deficit was recorded for Slovenia, however it was more or less evenly distributed, so no region experienced a water balance deficit that would exceed 95th percentile. A similar range of deficit for Slovenia was recorded in 2006, but it was mostly present in one region where deficit exceeded 95th percentile. This can also be seen from the lower of the two graphs in Figure 1 above, in which drought intensity is expressed in percentileclass of summer meteorological water balance at representative regional stations. The number of extremely dry regions per year in the lower part Figure 1 is consistent with the number in the upper part of Figure 1. The agricultural drought indicator clearly shows concentration of droughts as well as an increase in spatial dimension of extreme droughts since year 2000. In that period, drought was most severe in years 2003, 2013 and 2017.
| 1961 | 1962 | 1963 | 1964 | 1965 | 1966 | 1967 | 1968 | 1969 | 1970 | 1971 | 1972 | 1973 | 1974 | 1975 | 1976 | 1977 | 1978 | 1979 | 1980 | 1981 | 1982 | 1983 | 1984 | 1985 | 1986 | 1987 | 1988 | 1989 | 1990 | 1991 | 1992 | 1993 | 1994 | 1995 | 1996 | 1997 | 1998 | 1999 | 2000 | 2001 | 2002 | 2003 | 2004 | 2005 | 2006 | 2007 | 2008 | 2009 | 2010 | 2011 | 2012 | 2013 | 2014 | 2015 | 2016 | 2017 | 2018 | 2019 | 2020 | 2021 | |
| mm | 73,9 | -32,3 | 89,3 | 91,1 | 186,3 | 160,4 | -74,8 | 146,5 | 214,4 | 80,1 | -50,3 | 127,2 | 16,7 | 157,4 | 180,3 | -10,8 | 119,5 | 86,4 | 84,6 | 122,4 | 45,3 | 90,6 | -82,5 | 6,3 | 73,1 | 118,3 | 69,1 | 0,4 | 165,4 | 38,6 | 25,6 | -115,1 | -84,9 | -20,7 | 74 | 27,7 | 44,1 | 22,8 | 53,4 | -143,2 | -146,8 | 37,4 | -205,8 | 61,4 | 116,4 | -45,8 | -50 | 86,9 | -26,2 | -19,6 | -40,5 | -140,6 | -215,7 | 118,2 | -92,2 | -22,1 | -154,7 | -38,2 | -117,9 | 58,4 | -147,9 |
| numner of regions | 0 | 0 | 0 | 0 | 0 | 0 | 0 | 0 | 0 | 0 | 0 | 0 | 0 | 0 | 0 | 0 | 0 | 0 | 0 | 0 | 0 | 0 | 2 | 0 | 0 | 0 | 0 | 0 | 0 | 0 | 0 | 4 | 0 | 0 | 0 | 0 | 0 | 0 | 0 | 1 | 2 | 0 | 10 | 0 | 0 | 1 | 0 | 0 | 0 | 0 | 0 | 4 | 9 | 0 | 1 | 0 | 6 | 0 | 2 | 0 | 3 |


